Long-term Trends of Volatile Organic Compounds over the Texas, USA in the Past Two Decades
←
→
Page content transcription
If your browser does not render page correctly, please read the page content below
E3S Web of Conferences 259, 01003 (2021)                                                     https://doi.org/10.1051/e3sconf/202125901003
ICESD 2021

    Long-term Trends of Volatile Organic Compounds over the
    Texas, USA in the Past Two Decades
    Ruizhe Liu*
    University of Maryland,United States

                  Abstract. Volatile organic compounds (VOCs) are organic compounds in the air that have low vapor
                  pressure. VOCs can be emitted from a variety of sources including biogenic, anthropogenic and pyrogenic
                  processes. VOCs are precursors of aerosols and tropospheric O3, which harm human health. However, the
                  potential of VOCs forming secondary air pollutants varies by species. Here, we analyze the long-term trends
                  of source, concentration and reactivity of six classes of VOCs from 1995 to 2018 over Texas, USA. VOCs
                  emission from petroleum and related companies in Texas kept increasing these years. Among the VOCs
                  tracers of oil and gas companies, the concentration of ethane kept increasing until 2015. Despite the increase
                  of oil and gas related VOCs, the concentration of total VOCs and reactivity-weighted VOCs have decreased
                  in the past two decades. We further investigate the seasonality of VOC reactivities, which depend on both
                  temperature and VOC concentration. We find that VOC reactivity generally is highest in fall and lowest in
                  spring, and such seasonality does not change over the two decades.

  1 Introduction                                                         Approximately 7960 kton was reduced from 1990 to
                                                                         2017. (Figure 1) For different sources of the emission,
  Generally, volatile organic compounds (VOCs) refer to                  highway vehicles contributed much less in 2017. In
  those that can evaporate under normal temperature and                  addition, most sources lead to less emission now such as
  pressure, or indoor atmospheric conditions[1]. The                     violent utilization and off-highway vehicles. However,
  common species include acetone, benzene, ethane,                       the amount of emission from petroleum and related
  toluene, and so on[1]. In nature, VOCs contribute to                   industries was becoming much larger in these years in
  communication between plants and animals, doing good                   the United States. The main petroleum products are
  to nature. As for humans, however, even breathing low                  divide into three primary categories: fuels(i.e. motor
  levels of VOCs may lead to increase people’s risk of                   gasoline, fuel oil), finished non-fuel products(i.e.
  health problems such as eye, nose and throat irritation,               solvents), and chemical industry feedstocks(i.e. ethane,
  headaches, nausea, and even cancer. [1,2]. Other than                  propane).[9] Air sample was collected in the Marcellus
  water-soluble chemicals, volatile chemicals can be                     Shale southwestern Pennsylvania, results indicated that
  inhaled and absorbed through the skin because of                       the majority of C2-C8 alkanes were originated from
                                                                         unconventional natural gas.[10] Considerable emission
  vaporization, displaying a higher possibility of health
                                                                         of VOCs from petroleum and related industries also
  effects[3]. [2] Inhalation of trimethyl benzenes, xy-lenes,
                                                                         increases the production of ozone. Gilman et al. [2013]
  benzene, and alkanes can cause unconsciousness at
                                                                         reported that approximately half (55 ± 18%) of VOCs
  higher exposures. [4]. In atmospheric chemistry, VOCs                  initiated the ozone production cycle is originated from
  cause formation of surface ozone a major air pollutant                 oil and gas production.[11] At the Boulder Atmospheric
  harmful to human health. lung function can be reduced                  Observatory, C2-C6 alkanes dominated the reaction of
  in a high level of ozone. [5][6] Besides, ozone is a                   VOCs and hydroxyl radical (OH) because of their large
  greenhouse gas. VOCs produce tropospheric ozone                        abundances.
  through photochemical reactions with the reactive
  hydroxyl radical(OH). The product can be combined
  with anthropogenic NOx to produce ozone. In urban
  summer, hourly average concentrations of tropospheric
  ozone can be about 150 ppbv after solar noon.[7]
     Vehicle and oil and gas production are recognized as
  two important sources of VOC emission in 20th century.
  Over the U.S., vehicular emission has been reduced by
  59% since the control of on-road vehicle emission was
  introduced.[8] VOC emission in the United States
  decreased significantly over the past two decades.                                                      (a)

    *
        Corresponding author: evanlrz@163.com

© The Authors, published by EDP Sciences. This is an open access article distributed under the terms of the Creative Commons Attribution
License 4.0 (http://creativecommons.org/licenses/by/4.0/).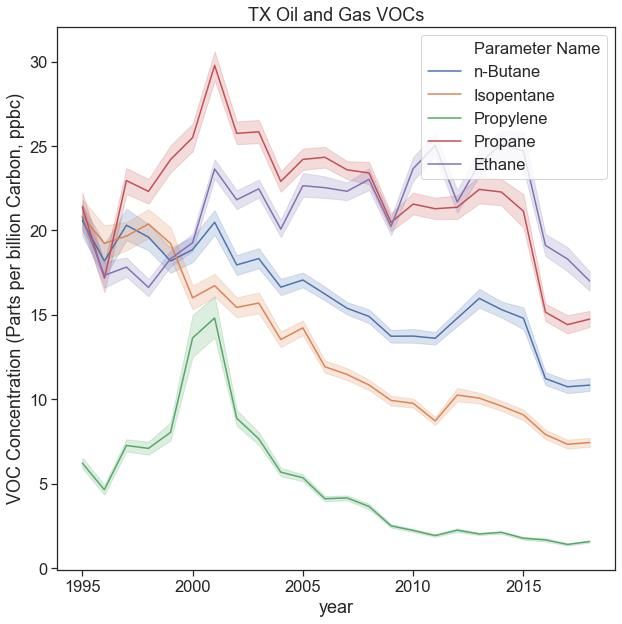
ICESD 2021
E3S Web of Conferences 259, 01003 (2021) https://doi.org/10.1051/e3sconf/202125901003
ICESD 2021
The emission data are accessed from the National
Emissions Inventory (NEI), which is an exhaustive
estimate of VOC emissions from the emissions sources.
Emissions from 1991 to 1995 are not available on a state
tier level. 1996-2001 emissions were calculated for given
NEI years. Emissions in 1996 are given and results in
1998 were estimated through 1996 NEI as a base year. [1]
Similar approaches were used to get 2000 and 2001
based on 1999 NEI. 2002, 2005, 2008, 2011, and 2014
were given years so the rest years were estimated using
inter interpolation.
(b) The emission data are accessed from the National
Emissions Inventory (NEI), which is an exhaustive
Fig. 1. (a) Sectoral Emission Trends of VOCs in Texas; estimate of VOC emissions from the emissions sources.
(b) Sectoral Emission Trends of VOCs in the United
Emissions from 1991 to 1995 are not available on a state
tier level. 1996-2001 emissions were calculated through
In USA, the emission of VOCs in the United States
methodologies for given NEI years. Emissions in 1996
has declined from 22042 kton in 1995 to 16202 kton in
are given and results in 1998 were estimated through
2017(Figure 1) while the emission trends in Texas
1996 NEI as a base year. Similar approaches were used
changed anomalously, 1766kton in 1990 to 1865kton in
to get 2000 and 2001 based on 1999 NEI. 2002, 2005,
2017(Figure 1). A series of changes in the long term
2008, 2011, and 2014 were estimated directly from the
trend of VOC emission in Texas caused our interest. The
survey, and the rest years were estimated using
daily concentration of VOCs in each site was measured
interpolation.
at Photochemical Assessment Monitoring Stations
(PAMS). We investigate the long-term trends of VOC
emissions and concentration from major sectors: 2.2 PAMS observations
petroleum and related industries, other industrial
processes, solvent utilization, storage and transport, The VOCs daily concentration data are acquired from
waste disposal and recycling, highway vehicles, off- Photochemical Assessment Monitoring Stations (PAMS),
highway vehicles, miscellaneous, wildfires, and which are part of the State Implementation Plan (SIP)
prescribed fires. Furthermore, we explore how the monitoring networks for the enhanced monitoring of
concentration of various VOCs from major sectors have ozone, NOx, and VOCs. Five sites for a large area have
changed in the past two decades. been consistent in the minimum network to make data
At La Porte in Texas, the abundance of various kinds sufficient to satisfy plenty of essential monitoring
of VOCs (i.e. ethene, propene, 1-butene, C2-C4 alkanes) objectives. The five sites contained: upwind and
background characterization site, maximum ozone
are due to emissions from the petrochemical industry.
precursor emissions impact site, maximum ozone
C1-C3 aldehydes generally dominated air mass reactivity.
concentration site, and extreme downwind monitoring
Roadway vehicle emissions were generally dominated
site. A total of 56 target hydrocarbons are measured
by most aromatics and long-chain alkanes.[12] Higher every one or three hours during the ozone season.
ozone production rates were measured in the region with Formaldehyde, acetaldehyde, and acetone are collected
a high concentration of VOCs. Berkowitz et al. indicated in maximum ozone precursor emissions impact site on a
that VOC samples in Houston were raised when 3-hour basis.
O3/t>20 ppb per 15 min and simulated ozone
production can be 50 ppb per hour when air pass through
eastern Houston with rich emission of VOCs.[13] In
Northeast Texas, photochemical modeling of emission in
2012 showed increases up to 5 ppb in 8-hour ozone
design values due to development in the Haynesville
Shale.[14] Many studies indicate that the VOCs
emissions show a clear seasonal cycle (VOCs trends in
Dallas seasonally, VOCs trends in lower polar
Troposphere seasonally), which motivates us to study
how the trends of reactivities of VOCs with OH (VOCR)
changed.
2 Experiments
2.1. Emission inventory data
Fig. 2. Site distribution(red points) in Texas.
2
ICESD 2021
E3S Web of Conferences 259, 01003 (2021)                                              https://doi.org/10.1051/e3sconf/202125901003
ICESD 2021

      In PAMS data, there were 109 sites including 46              3.2.1 Seasonality
  cities in the Texas States. (Fig. 2) The cities with most
  data include Houston, El Paso, Dallas, Deer Park,                There is a clear seasonal trend (Fig. 3): VOC
  Odessa, and Corpus Christi. The data of each site are not        concentrations peak in January, while the smallest
  complete from 1995 to 2018, such as Cleveland Ave at             concentration happened in June. These are linked to the
  Clark Dr (1995 to 2014), 3810 Huisache Street (1997 to           source and chemical lifetime of VOCs. The lifetime of
  2014). We filtered all the data higher than 3 times of           VOCs is shorter in summer because some kinds of
  standard deviation plus the median, which are considered         VOCs are more active in a higher temperature, which
  as outliers.                                                     means these VOCs can be easily converted to other
                                                                   intermediate species. This kind of VOCs reaction is
                                                                   temperature-dependent while there is also VOCs reaction
  2.3 Calculation of VOC reactivities                              which is temperature-independent, with no change with
                                                                   temperature rise or down. Hence, more VOCs are
  For aldehydes and ketones, aromatics and Temperature-
                                                                   reacted to produce HOx in the summer, leading to less
  independent Alkane, their values of kT are constant,
                                                                   VOCs concentration in summer in Texas. In addition, the
  independent of temperature. Alkene, aromatics, C1-C2
                                                                   light intensity can also affect the VOCs activity as ozone
  aldehydes and temperature-dependent alkane are fit as
                                                                   is formed in the reaction of oxygen and O(3P) atom, and
  exponential functions of temperature. The equations
                                                                   the O(3P) atom is from the decomposition of NO2
  below are used to get each VOCR value. Daily
                                                                   absorbing photons. In winter, the photolysis is not strong
  temperatures in each place are from EPA documents.
                                                                   because of less light duration and intensity, making
                                                                   decreased photochemistry in the process of ozone
  3 Results                                                        formation. In terms of anthropogenic point, the natural
                                                                   gas industrial consumption always peaks in winter,
                                                                   leading to the peak of the VOCs concentrations. The
  3.1 VOC emissions                                                natural gas industrial consumption, one of the main
  Emissions from Texas increased sharply from 1434kton             sources of VOCs, shows a seasonal trend, most
  in 2005 to 2361kton in 2008 (Fig. 1). After reaching the         consumption between November and January and less
                                                                   consumption in June, September, and October. Although
  maximum in 2008, the trends of emissions still
                                                                   the consumption in summer is not the least, more active
  experienced rising and falling from 2008 to 2014, then
                                                                   reaction rate because of highlight intensity and the
  kept about 1800kton after 2014. From Fig. 1, we can see
                                                                   temperature seems the main reason making the least
  that most emission sectors are highway and off-highway           emission appear in June. Overall, the seasonality of VOC
  vehicles, solvent utilization, and petroleum and related         concentrations reflects the combined effects of
  industries. In the beginning, highway vehicle emission           meteorology and emissions.
  was larger than any other sector in 1990. However, with
  the increasing trend from petroleum industries and
  decreasing trend from vehicles, petroleum, and related
  industries became the most dominant emission source.
       In the beginning, the highway vehicles emission were
  larger than any other sectors in 1990s. However, with the
  increasing trend from petroleum industries and
  decreasing trend from vehicles, petroleum, and related
  industries became the most emission source in the latest
  years. The solvent utilization emissions changed from
  326 kton in 1990 to 242 kton in 2017, leading to a rising
  trend from 2005 to 2008 then dropping. On the contrary,
  the petroleum and related industries emission has
  increased from 183kton in 1990 increased sharply to
  1104kton. The number of gas and gas condense wells
  increased in Texas from 1990(50867 numbers) to
  2014(14292 numbers), particularly more than 40000
  numbers rising from 2010(95014 numbers) to
  2011(139368 numbers). For Texas natural gas industrial
  consumption, there was a general decline showing from
  1997(2049 trillion cubic feet) to 2009(1198 trillion cubic       Fig.3. Seasonal cycle of the five most abundant VOCs in Texas
  feet) following by a slowly growing till 2018(1821
  trillion cubic feet).
                                                                   3.2.2 Long-term trends

  3.2 VOCs concentration                                           From Fig. 4, we can see that the trend of VOCs emission
                                                                   from solvent utilization is not constant, full of up and
                                                                   down. From the development tendency of the VOCs

                                                               3
ICESD 2021
E3S Web of Conferences 259, 01003 (2021) https://doi.org/10.1051/e3sconf/202125901003
ICESD 2021
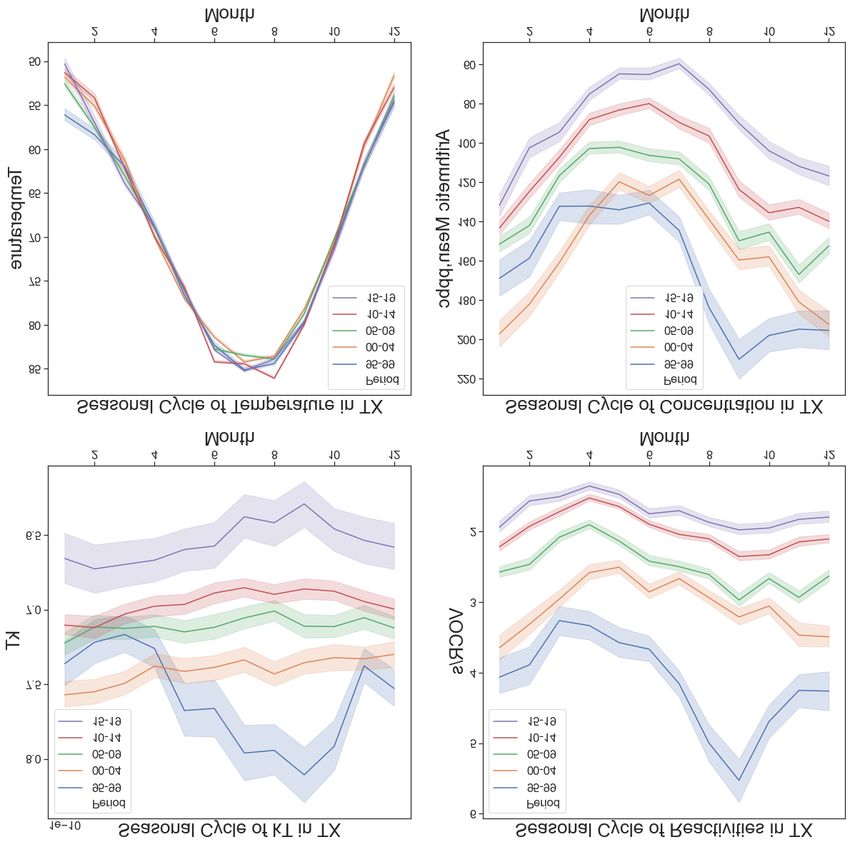
which are tracers of solvent (Fig. 1), we can find that Among the VOC species shown in Fig. 4, ethane, n-
most of them keep decreasing and toluene decreased butane, isopentane, propane and propylene were tracers
most in around 2000. of oil and gas. Their trends show changes of
consumption of oil and gas these years. (Fig. 4) N-
To track the sources VOCs from solvent utilization, we butane and isopentane were the main tracers of gasoline
conduct such analysis at each site in Texas. Many and the decline of the abundance showed decreasing
refineries were near Cleveland Ave at Clark Dr. There consumption of gasoline. The two main sources of
were many refineries in Jefferson and many solvent propylene are from the steam cracking of liquid
utilizations around Houston, so 3355 Grandview Ave feedstocks and from off-gases produced in fluid catalytic
and 32nd St has high VOCs concentration, and there was cracking (FCC) units in refineries. The up in
a solvent near the 3810 Huisache Street and 1713 2nd approximately 2000 and then downtrends in Fig. 4 mean
Street, so these two streets had higher VOCs. Isobutane that those technologies with a high concentration of
and isopentane are the main VOCs from solvents, most propylene happening were popular in around 2000 then
abundant species on the figure. However, the out of date generally. Ethane is a tracer of natural gas use
concentrations of VOCs vary among spatially among and the source of propane is from nature oil gas use and
sites, for the following reasons. First, isobutane is also oil and gas production. The concentrations of these two
the tracer of consumer products and both of them are species are much greater than others may because more
tracers of gasoline, so more vehicles in Houston cause consumption of natural gas use in recent years and they
more emissions in 3355 Grandview avenue. Second, are both non-reactive gases. Barrett and Monahans
there may be more consumer product companies around. streets and 800 S San Marcial street are the places with
Third, from the trends of these figures, it seems that the the most concentration of VOCs from petroleum
solvent utilizations near Houston have been controlled, industries because there are oil and natural gas
showing decreasing trends and the solvent near the last 2 companies around there. The low concentration of VOCs
streets is becoming more and more important, increasing from vehicle and solvent suggests that the main sources
since 2010 in the last 2 figures. of the sites are from oil and natural gas use.
3.3 VOCs reactivities
3.3.1 Long-term trends
The concentration of VOCs affects reactivities. From
2005, the concentration of VOCs kept decreasing,
making reactivities decrease consistently. The arithmetic
mean and VOC reactivity from 1995 to 2004 was larger
than the following periods, from 2005 to 2019(Fig. 5),
leading reactivities of VOCs in these ten years
significantly high. The arithmetic mean from 1995 to
1999 in September is 51 ppbc larger than the following 5
years, making the largest difference in the figure.
Correspondingly, the largest difference in VOCR
(a) seasonal cycle was also between these two periods, 2.3
s-1. The great gap between 2000 to 2004 and 2005 to
2009 appears in January, all above 40 ppbc. In response,
the VOCR in January from 2005 to 2009 decreasing 2.3
s-1, reducing most in the seasonal cycle comparing to the
last five years. The reductions in the latest three periods
(2005 to 2009, 2010 to 2014, 2015 to 2019) decreased in
both concentration and reactivities of VOCs.
3.3.2 Seasonality
VOCR is largely dependent on temperature. In Fig. 5,
from January to April in the period (2000 to 2004), the
concentration of VOCs was larger than the previous 5
years (1995 to 1999) while VOCR in this period (2000
to 2004) was lower. To further understand the effect of
temperature on each type of VOCs, VOCs in this
(b) research were divided into 7 classes: aldehydes and
Fig. 1. (a) Trends of VOCs from solvent in Texas; ketones, alkene, aromatics, biogenic VOC, C1-C2
(b)Trends of VOCs from oil and gas in Texas. aldehydes, temperature-dependent alkane, and
temperature-independent alkane. C1-C2 aldehydes and
4ICESD 2021
E3S Web of Conferences 259, 01003 (2021) https://doi.org/10.1051/e3sconf/202125901003
ICESD 2021
temperature-dependent alkane were most affected by environment and VOCR of other types would not change
temperature: with rising temperature, the value VOCR of with temperature.
C1-C2 aldehydes would be increase while that of Reactivities in all the periods in the figure, except
temperature-dependent alkane would be lower (Fig. 6). from 2000 to 2004, were at their peak in September and
This discovery illustrated VOCR of C1-C2 aldehydes fell to the lowest in March or April. As mentioned,
was greater in the period from 1995 to 1999, given which are due to the combined effects of temperature
higher temperature and arithmetic mean of C1-C2 and concentration. Although temperature reached a peak
aldehydes in winter and spring. On the contrary, in July, the concentration of VOCs is at around the
temperature-dependent alkane has an opposite response lowest points. In September, the concentration rose fast
to temperature: higher VOCR at a lower temperature. and the temperature was still remaining a high value, so
Thus, greater arithmetic means of temperature-dependent the reactivities reach the peak. Comparing to the
alkane in the period (2000 to 2004) and the lower arithmetic mean in July in each period, the values in
temperature could benefit the VOCR of this class. September increased 45.8%, 34.7%, 39.3%, 38.2% and
To make further analysis of season trends of 52.5% in 1995 to 1999, 2000 to 2004, 2005 to 2009,
properties of VOCR, the trends of kT, VOCR, 2015 to 2019, respectively. In contrast, the relative
temperature, and arithmetic mean of each class have reduction of temperatures in September were 6.2%, 7.2%,
been shown. (Fig. 5) There are three kinds of trends of 5.6%, 5.33%, and 6.7%, much lower than the changes in
VOCR in a seasonal cycle: the values of VOCR of C1- concentration. Similarly, values of reactivities dropped
C2 aldehydes and biogenic VOCs were greater in a to the lowest points because the concentration and
warmer temperature, the VOCR of temperature- temperature are both at a low level.
dependent alkane and alkene were greater in a cold
a. b.
c. d.
Fig. 5. Seasonal cycle of kT(a), reactivities(b), temperature(c) and concentration(d) in Texas(95-99 refers to period from 1995 to
1999; 00-04 refers to period from 2000 to 2004; 05-09 refers to period from 2005 to 2009;10-14 refers to period from 2010 to 2014;
15-19 refers to period from 2015 to 2019).
5ICESD 2021
E3S Web of Conferences 259, 01003 (2021) https://doi.org/10.1051/e3sconf/202125901003
ICESD 2021
a. b.
c. d.
Fig. 6. Seasonal cycle of kT(a), reactivities(b), temperature(c), and concentration(d) of each class in Texas.
4 Conclusions
The trend in the periods from 2000 to 2004 was an
exception, being at peak in winter and dropping to the
lowest point in summer. We inferred that the unusual We find distinct seasonal cycle of VOC concentration
trend happened because of relatively lower temperature and VOC reactivity in Texas. VOC concentrations peak
especially in summer in this period (Fig. 6). Cooler in winter, which is due to the consumption of the natural
temperature in summer caused the VOCR of biogenic gas and longer lifetime of VOCs industries in winter.
VOCs to be lower comparing with other periods. The Besides, solvents and petroleum and related industries
VOCR values of biogenic VOCs (2000 to 2004) from also contribute to the overall VOCs, which is evidence
June to October kept the lowest in all the periods (Table from large amount of Isobutane and isopentane (tracers
1), making total VOCR in summer in this period not be of solvent related VOCs). Reactivities generally peak in
high as other periods. Furthermore, VOCR of alkene in September and fall to the lowest point in March or April.
the period (2000-2004) was also higher, particularly in In September, the concentration rose fast and the
winter given a cold environment. From November to temperature was still remaining a high value, so the
February, the reactivities are more than 1.00 s-1 (Table reactivities reach the peak. Different classes of VOCs
1), greatest value in all periods except former 5 years, show variations in seasonal cycle: the values of VOCR
1995 to 1999. What’s more, the weight of Alkene in all of C1-C2 aldehydes and biogenic VOCs were greater in
the classes in 00 to 04 was much larger (20.9%) than a warmer temperature, the VOCR of temperature-
1995 to 1999(18.0%), 2005 to 2009(17.5%), 2010 to dependent alkane and alkene were greater in a cold
2014(13.6%) and 2015 to 2019(11.3%), which means environment and VOCR of other types would not change
the alkene in 2000 to 2004 distributed more on the total with temperature. The concentration of ethane has
VOCR trends. In the same way, the weight of biogenic increased in the past two decades because of increasing
VOCs in 2000 to 2004 (6.0%) was much lower than in consumption of oil and gas use, but the overall VOC
other periods except 1995 to 1999. Hence, higher concentration shows declining trends. The long-term
concentration of alkene leads to the VOCR values in decrease in VOC concentrations largely lead to decrease
winter was much higher while less biogenic VOCs have of overall VOC reactivities. Overall, we conclude that
a lower weight on total VOCR and make the max value the emission control has led significant reduction of the
move to January. hazardous VOC concentration, and also less potential to
form secondary pollutants.
6ICESD 2021
E3S Web of Conferences 259, 01003 (2021) https://doi.org/10.1051/e3sconf/202125901003
ICESD 2021
Table 1. Seasonal VOCR of Each Class in Each Five Years
Period Class VOCR(/s)
JAN to MAR APR to JUN JUL to OCT to SUM
SEP DEC
1995 to 1999 Aldehydes and ketones 0.108 0.100 0.168 0.134 0.509
Alkene 1.262 0.968 1.066 1.313 4.608
Aromatics 0.787 0.744 1.168 0.908 3.607
Biogenic VOC 0.105 0.419 0.564 0.195 1.283
C1-C2 aldehydes 1.870 2.329 2.515 2.176 8.890
Temperature-dependent Alkane 1.237 1.036 1.446 1.539 5.258
Temperature-independent 0.196 0.170 0.255 0.211 0.832
Alkane
Sum 5.564 5.766 7.182 6.476 24.99
2000 to 2004 Aldehydes and ketones 0.089 0.067 0.067 0.095 0.318
Alkene 1.081 0.761 0.738 1.047 3.627
Aromatics 0.520 0.418 0.454 0.526 1.919
Biogenic VOC 0.078 0.344 0.457 0.133 1.011
C1-C2 aldehydes 1.064 1.263 1.603 1.220 5.149
Temperature-dependent Alkane 1.348 0.909 1.016 1.360 4.634
Temperature-independent 0.143 0.112 0.116 0.145 0.515
Alkane
Sum 4.324 3.873 4.451 4.526 17.17
2005 to 2009 Aldehydes and ketones 0.059 0.045 0.054 0.066 0.224
Alkene 0.685 0.520 0.534 0.695 2.433
Aromatics 0.368 0.278 0.358 0.446 1.451
Biogenic VOC 0.077 0.370 0.570 0.154 1.171
C1-C2 aldehydes 0.732 1.066 1.275 0.914 3.987
Temperature-dependent Alkane 1.045 0.806 0.995 1.223 4.070
Temperature-independent 0.130 0.103 0.133 0.153 0.519
Alkane
Sum 3.096 3.189 3.918 3.652 13.86
2010 to 2014 Aldehydes and ketones 0.040 0.031 0.039 0.050 0.160
Alkene 0.453 0.318 0.337 0.454 1.562
Aromatics 0.280 0.201 0.244 0.312 1.038
Biogenic VOC 0.058 0.351 0.535 0.123 1.066
C1-C2 aldehydes 0.731 0.890 1.103 0.804 3.528
Temperature-dependent Alkane 0.996 0.678 0.862 1.119 3.655
Temperature-independent 0.115 0.084 0.111 0.135 0.444
Alkane
Sum 2.672 2.553 3.231 2.997 11.45
2015 to 2019 Aldehydes and ketones 0.035 0.024 0.024 0.037 0.120
Alkene 0.331 0.231 0.239 0.345 1.145
Aromatics 0.247 0.184 0.209 0.289 0.930
Biogenic VOC 0.055 0.406 0.634 0.158 1.254
C1-C2 aldehydes 0.679 0.775 0.990 0.821 3.265
Temperature-dependent Alkane 0.899 0.569 0.623 0.908 2.998
Temperature-independent 0.095 0.069 0.082 0.109 0.355
Alkane
Sum 2.341 2.258 2.801 2.667 10.07
7ICESD 2021
E3S Web of Conferences 259, 01003 (2021) https://doi.org/10.1051/e3sconf/202125901003
ICESD 2021
References
1. Technical Overview of Volatile Organic 13. Berkowitz, C. M., Jobson, T., Jiang, G., Spicer, C.
Compounds: https://www.epa.gov/indoor-air- W., & Doskey, P. V. (2004). Chemical and
quality-iaq/technical-overview-volatile-organic- meteorological characteristics associated with rapid
compounds#3 (12 April 2017) increases of O3 in Houston, Texas. Journal of
2. Volatile Organic Compounds in Your Home: Geophysical Research: Atmospheres, 109(D10).
https://www.health.state.mn.us/communities/enviro DOI: 10.1029/2003JD004141
nment/air/toxins/voc.htm (15 June 2020) 14. Kemball-Cook, S., Bar-Ilan, A., Grant, J., Parker, L.,
3. Colborn, T., Kwiatkowski, C., Schultz, K., & Jung, J., Santamaria, W., ... & Yarwood, G. (2010).
Bachran, M. (2011). Natural gas operations from a Ozone impacts of natural gas development in the
public health perspective. Human and ecological Haynesville Shale. Environmental Science &
risk assessment: An International Journal, 17(5), Technology, 44(24), 9357-9363. DOI:
1039-1056; DOI: 10.1080/10807039.2011.605662 10.1021/es1021137
4. McKenzie, L. M., Witter, R. Z., Newman, L. S., &
Adgate, J. L. (2012). Human health risk assessment
of air emissions from development of
unconventional natural gas resources. Science of
the Total Environment, 424, 79-87. DOI:
10.1016/j.scitotenv.2012.02.018
5. Eubanks, L. P. (2006). Chemistry in context:
Applying chemistry to society. McGraw-Hill
Education; pp 45
6. Goldstein, A. H., & Galbally, I. E. (2007). Known
and unexplored organic constituents in the earth's
atmosphere. DOI: 10.1021/es072476p
7. Schnell, R. C., Oltmans, S. J., Neely, R. R., Endres,
M. S., Molenar, J. V., & White, A. B. (2009).
Rapid photochemical production of ozone at high
concentrations in a rural site during winter. Nature
Geoscience, 2(2), 120-122. DOI:10.1038/ngeo415
8. EPA, U. (2000) National air pollutant emission
trends 1900–1998. US Environmental Protection
Agency.
9. Heminway, S. (1995). Profile of the Petroleum
Refining Industry. EPA Office of Compliance
Sector Notebook Project, US Environmental
Protection Agency, Washington.
10. Swarthout, R. F., Russo, R. S., Zhou, Y., Miller, B.
M., Mitchell, B., Horsman, E., ... & Sive, B. C.
(2015). Impact of Marcellus Shale natural gas
development in southwest Pennsylvania on volatile
organic compound emissions and regional air
quality. Environmental science & technology, 49(5),
3175-3184. DOI: 10.1021/es504315f
11. Gilman, J. B., Lerner, B. M., Kuster, W. C., & De
Gouw, J. A. (2013). Source signature of volatile
organic compounds from oil and natural gas
operations in northeastern Colorado. Environmental
science & technology, 47(3), 1297-1305. DOI:
10.1021/es304119a
12. Jobson, B. T., Berkowitz, C. M., Kuster, W. C.,
Goldan, P. D., Williams, E. J., Fesenfeld, F. C., ...
& Riemer, D. (2004). Hydrocarbon source
signatures in Houston, Texas: Influence of the
petrochemical industry. Journal of Geophysical
Research: Atmospheres, 109(D24). DOI:
10.1029/2004JD004887
8You can also read