More About Pay than About Performance - Trends to Watch for during the 2021 ASX Proxy Season - Diligent Corporation
←
→
Page content transcription
If your browser does not render page correctly, please read the page content below

More About Pay than
About Performance
Trends to Watch for during the 2021 ASX Proxy Season

JULY 2021 | DILIGENTINSTITUTE.COM

More About Pay than About Performance: Trends to Watch for the 2021 ASX Proxy Season 2
Executive
Summary
In this paper, we analyse changes to chief executive officer (CEO) pay considering the COVID-19 pandemic,
as well as trends in remuneration components and performance measures.
Executive remuneration is a vital issue for stakeholders and investors, specifically regarding pandemic-era
pay cuts and the inclusion of environmental, social and governance (ESG) performance metrics.
Data and insights from CGLytics (a Diligent brand), provide a current executive pay landscape for both the
ASX 300 and the ASX 100. This report gives stakeholders insights into the relative positioning and alignment
of CEO total realised pay (TRP) against the total shareholder return (TSR) over one- and three-year periods.
This report also provides essential information on the executive remuneration practices of Australian
companies and sheds light on stakeholder concerns to better understand corporate governance trends
in the Australian market for the upcoming 2021 proxy season.
Key Takeaways
Across all 47 companies that initiated COVID-19 pay The consumer discretionary sector had six strikes
cuts, the average CEO TRP increased by 11%. against their remuneration reports in FY2020, the
highest among all sectors.
Average CEO TRP of ASX 300-listed companies
decreased by 10.5% from FY2019 to FY2020. 99 ASX 300 companies had an aligned relative
positioning of remuneration and performance
Long-term incentive (LTI) components rose
over three years, while 103 companies have overpaid
by 14% from FY2018 to FY2020, while base salary
their CEOs and 80 companies have paid their
and short-term incentive (STI) components
CEOs conservatively.
dropped by 3% and 17%, respectively.
The number of ASX 300-listed and ASX 100-listed
The combined TRP of the top five highest-paid
companies that introduced ESG performance
CEOs is AUD 266 million, a 54% increase from
metrics has increased to 20% and 21%,
FY2019.
respectively, in the last year.
32 ASX 300-listed companies received strikes
against their remuneration reports in FY2020
compared to 24 companies in FY2019.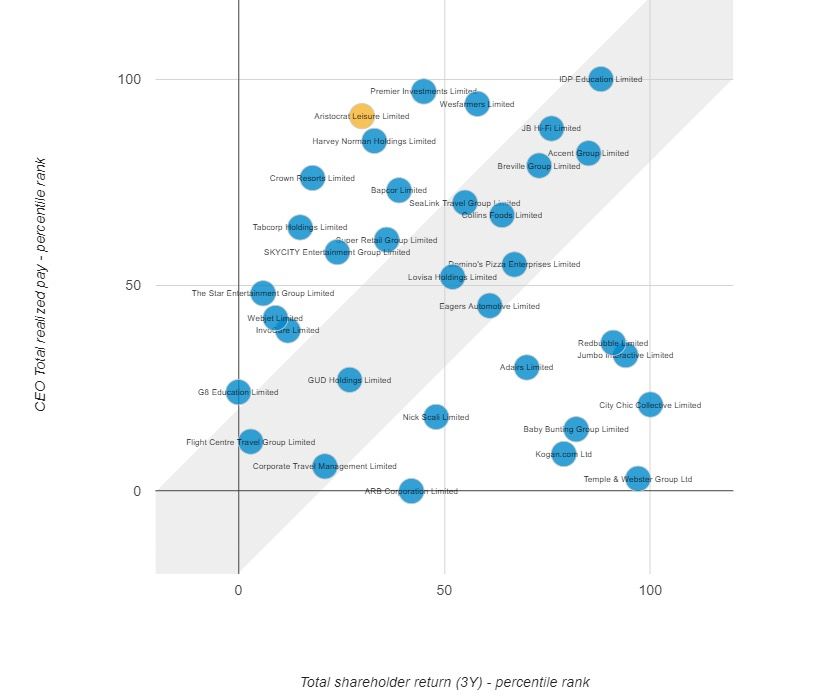
More About Pay than About Performance: Trends to Watch for the 2021 ASX Proxy Season    3

Background

The COVID-19 pandemic has brought about drastic                 These practices were seen across many industries
changes for the Australian workforce. These changes             and sectors including finance, healthcare,
have created a balancing act between employers,                 communications, mining, professional services and
who want to keep their businesses operational, and              retail. Yet, the Australian Tax Office (ATO) has not
employees, who want to retain their jobs and ensure             made a conclusive statement on this potential misuse
their own safety.                                               of JobKeeper funds, stating that analysis into how
                                                                companies utilised funding was beyond the
The Australian government tried to stabilise the
                                                                ATO’s scopeii.
pandemic-stricken economy by providing employers
and employees with an AUD 90 billion JobKeeper                  According to the ATO, the largest economic subsidy
subsidy scheme. Many companies considering                      scheme in Australia’s history signed up more than
redundancies and pay cuts opted into the JobKeeper              3.6 million people during the peak of the pandemic
subsidy to survive. However, as the funds were                  before decreasing to 1.54 million in the later months
allocated, issues arose over how the subsidy was                of 2020iii. Despite the subsidies, Australia has yet to
given out and used by companies.                                make a full recovery. The end of JobKeeper, leading
                                                                to the unemployment and underemployment of
The subsidy’s eligibility criteria required companies
                                                                over 600,000 peopleiv; industries that rely on large
to demonstrate a 30%–50% projected decline in
                                                                gatherings and travel still struggling to recover; and
sales, with little regard as to how those projections
                                                                the potential misuse of JobKeeper funding have all
were calculatedi. Our data suggests that the six
                                                                contributed to a slow and irregular recovery for the
largest JobKeeper recipients in the ASX paid their
                                                                Australian economy.
CEOs a combined sum of AUD 10.5 million in the form
of fixed pay and STIs. Their combined TSR was also
down to (120.50%) from 98.4% in 2019. Some ASX
300 companies paid dividends to their shareholders
while receiving JobKeeper payments.
More About Pay than About Performance: Trends to Watch for the 2021 ASX Proxy Season 4
Projected 2020 vs Actual 2020
CEO Pay Cut Recap Did the Announced CEO Pay Cuts Happen?
In CGLytics’ 2019 proxy season report, Comparison analysis of the projected and actual CEO
“Avoiding a First Strike During a Pandemic,” TRP has shown that 24 companies decreased their
we reported that 60 of the ASX 300 companies TRP, while 23 companies have increased their TRP
announced CEO pay cuts from March 2020 despite promising CEO pay cuts.
until August 2020. Fifty-four of those companies
Across all 47 companies, the average TRP
disclosed the proposed percentage cuts.
percentage change was an increase of 11%.
Of those 54 companies, 65% promised to cut CEO 24 companies decreased CEO total realised pay.
base salary, 31% committed to a cut in both CEO base
23 companies increased CEO total realised pay.
salary and STIs, and 4% proposed cuts only to STIs.
The average percentage change in CEO total
CGLytics calculated these companies’ projected
realised pay was an increase of 11%.
2020 CEO TRP based on the pay cuts announced
and using their 2019 realised compensation. When
comparing projected and actual 2020 CEO pay,
it is important to note that we have removed seven
companies that have since dropped off the ASX 300,
bringing the sample size to a total of 47 companies.
The chart indicates that 15 companies increased
Total Realised Pay: Projected 2020 vs. Actual 2020 their CEO TRP by up to 50%, while eight companies
Source: CGLytics
had increases of over 50%. A majority of the eight
companies reported that the increase in CEO TRP
17% was due to a vesting of long-term incentives (LTI). Two
companies received strikes of more than 45% voting
35%
against their respective 2020 remuneration reports.
33% Comparatively, 16 companies decreased their CEO
15% TRP by up to 50%, with another seven companies
reducing their CEO TRP by more than 50%. Despite
its lower CEO TRP, one of the seven companies
Companies with up to 50% decrease nonetheless received a 45% strike against its
Companies with up to 50% increase
Companies with more than 50% decrease
remuneration report, because it was one of the 25
Companies with more than 50% increase ASX 300-listed companies that paid out bonuses
while also collecting JobKeeper paymentsv.More About Pay than About Performance: Trends to Watch for the 2021 ASX Proxy Season 5
Which Components Were Affected?
CEO remuneration largely comprises three Thirty-four companies increased their CEO base
components: base salary, short-term incentives and salaries despite 25 of the 34 companies having
long-term incentives. When comparing projected indicated planning base salary reductions. On the
and actual 2020 CEO TRP, the 47 companies that other hand, 12 companies decreased their base
announced pay cuts had a 36% increase in average salaries. Eight companies increased their STIs
base salary, a 14% decrease in STIs and a 7% while 20 companies decreased them. Lastly, seven
decrease in LTIs. companies increased their LTIs while 12 companies
STI components were the most negatively affected. decreased the LTI component of the TRP. The
STI component was the most negatively affected,
Base salary components had the highest growth.
demonstrating that many companies decided to
21 companies had no change in LTI growth. withhold the payment of annual bonuses over cutting
base salaries and deferring the vesting of LTI plans.
2020: Projected vs. Actual Compensation
Source: CGLytics
30
25 24
No. of Companies
21
19
20
15 14
12
11
10
10
7
7
6 6
5
1 1 1 1
0
≤50% >50% ≤50% >50% No ≤50% >50% ≤50% >50% No ≤50% >50% ≤50% >50% No
increase increase decrease decrease change increase increase decrease decrease change increase increase decrease decrease change
Base Salary Short-term Incentive Long-term Incentive
ComponentMore About Pay than About Performance: Trends to Watch for the 2021 ASX Proxy Season 6
The healthcare sector had the biggest average base salary increase.
The industrials sector had the largest average STI increase.
The communications sector had the largest average LTI increase.
The consumer staples sector had the largest overall TRP cuts, with an average decrease of 20% across all
three components. One company in the consumer staples sector forwent 30% of its CEO salary and received
no cash for STIs in 2020vi.
The energy sector saw the highest overall increase, with an average 30% surge across all components. One
energy company received an over 50% strike against its 2020 remuneration report despite its promised pay
cuts. The company was reported to have allocated 67.5% of all STIs to its CEO and executives, with 37% given
in cash and 63% deferred as equity. This was all done while more than 400 workers were made redundant
during the pandemicviiviii. This may be an indication that this company was overpaying its executives while
struggling to pay for employee wagesix.
Actual 2019 vs Actual 2020
CEO Pay Cut Recap
Below, we compare the actual 2019 and 2020 CEO TRP for the whole of the ASX 300, regardless of whether
they initiated CEO pay cuts. We have only included 281 companies in our ASX300 analysis, as 19 companies
did not provide CEO remuneration data from either 2019 or 2020.
There was a 10.5% decrease in
the average CEO TRP from 2019 to 2020. Actual 2019 vs. Actual 2020:
ASX 300 CEO Total Realised Pay
54% of ASX 300 companies Source: CGLytics
lowered their CEO TRP in 2020.
STI was the most negatively impacted
component for the ASX 300 in 2020. 16%
One hundred and fifty-two companies (54% of the 32%
ASX 300) decreased CEO TRP while one hundred
and twenty-nine (46% of the ASX 300) increased it.
38%
The large-scale decrease in CEO TRP is in part 14%
certainly due to the pandemic, as 2018 and 2019
data indicates that 84% of ASX 300 companies
displayed trends of increasing CEO TRP.
≤50% increase ≥50% decrease
>50% increase >50% decreaseMore About Pay than About Performance: Trends to Watch for the 2021 ASX Proxy Season 7
Which Components Were Affected?
54% of ASX 300 companies This chart indicates that STIs are the most negatively
increased their CEO base salary in 2020. affected remuneration component among ASX 300
51% of ASX 300 companies companies. The decrease in STIs may be the result
decreased their CEO STIs in 2020. of companies wanting to preserve cash during the
pandemic but may also be due to a pre-pandemic
28% of ASX 300 companies
trend of companies emphasizing long-term value
increased their CEO LTIs in 2020.
creation (and a higher proportion of LTIs in CEO
remuneration)x. Another reason for a sharp decline
in STIs may be due to STIs being a smaller and less
valuable portion of CEO remunerationxi.
ASX 300: Actual 2019 vs 2020
Source: CGLytics
150
137
No. of Companies
105
100
80 84
69
60 62
53
50
43 45
39
28
16 17
5
0
≤50% >50% ≤50% >50% No ≤50% >50% ≤50% >50% No ≤50% >50% ≤50% >50% No
increase increase decrease decrease change increase increase decrease decrease change increase increase decrease decrease change
Base Salary Short-term Incentive Long-term Incentive
ComponentMore About Pay than About Performance: Trends to Watch for the 2021 ASX Proxy Season 8
ASX 300: Actual 2019 vs 2020
Source: CGLytics
80%
67%
63%
60%
60%
40%
40%
35%
28%
20% 18%
15%
10% 12%
Average % Change
7% 7% 8% 10%
5% 6%
2% 1% 3%
0%
0%
-1%
-7% -7%
-13%
-20% -18% -15% -16%
-30%
-40%
-39%
-60%
-80%
-90%
-100%
Communication Consumer Consumer Energy Financials Healthcare Industrials Information Materials Utilities
Services Discretionary Staples Technology
Base Salary Short-term Incentive Long-term Incentive
The information technology sector saw the largest increase in base salary.
The consumer discretionary sector saw the largest increase in STIs.
The materials sector saw the largest increase in LTIs.More About Pay than About Performance: Trends to Watch for the 2021 ASX Proxy Season 9
CEO Pay Breakdown 2018–2020
ASX 300 Average Realised CEO Pay Breakdown
Source: CGLytics
100%
80% 34%
50%
51%
60%
28%
40% 20% 16%
20%
38% 33%
30%
0%
2018 2019 2020
Base Salary STI LTI
The chart above indicates that the LTI component of executive remuneration has been increasing over the past
several years. LTIs have been the only growing component in CEO TRPs, with data from 2018 to 2020 conveying
14% growth in LTIs with a 17% and 3% decline in STIs and base salaries, respectively. The LTI to STI ratio was 1.21 in
2018 but increased to 3.18 in 2020.More About Pay than About Performance: Trends to Watch for the 2021 ASX Proxy Season 10
AGM Strikes on the Rise
Investors expected a more conservative approach Thirty-two ASX 300-listed companies received
to executive compensation in 2020, and that strikes against their remuneration reports in 2020
expectation will drive through the 2021 proxy season compared to 24 companies in 2019. Nineteen of the
as well, especially with the pandemic’s effect on 32 companies received up to 50% ‘no’ votes on their
businesses and employees. Despite companies’ remuneration reports, with 13 companies facing more
promises to take pay cuts and reductions, some than 50% ‘no’ votes on their reports in 2020.
investors were dissatisfied with remuneration reports
detailing the outcomes.
AGM Strikes
Source: CGLytics
8
No. of Companies
6
6
5 5
4 4 4
4
2
2
1 1
0
Industries
Consumer Discretionary Utilities Information Technology
Energy Financials Healthcare
Consumer Staples Materials Industrials
The consumer discretionary sector had the greatest number of strikes against remuneration reports in 2020,
followed by the healthcare and materials sectors. According to Glass Lewis, a significant cause for these
strikes may be the CEO bonuses given out by some companies despite their drop in earnings. One company
from the consumer discretionary sector was found to have been collecting JobKeeper payments when they
paid out 100% of their CEO cash bonus in 2020. Another company disclosed that they will be giving only
53% of the maximum CEO cash bonus but has noticeably increased its STIs from 2019xii.
While 26 of the 32 companies experienced one strike, six companies experienced a second strike. One
company in the materials sector experienced three strikes in three consecutive years per a report by Glass
Lewis. While holding this year’s AGM, this company received 93% ‘no’ votes against its remuneration report,
with investors showing concern over the uncapped, short-term incentives offered to the company’s CEO.More About Pay than About Performance: Trends to Watch for the 2021 ASX Proxy Season 11
Pay for Performance
The CGLytics Pay for Performance software tool shows the relative positioning of both the ASX 300 and
ASX 100 companies from 2018 to 2020 and compares the CEO’s three-year TRP against the company’s
three-year total shareholder return (TSR). We have only included 281 companies in our ASX 300 analysis, as
19 companies did not provide CEO remuneration data from either 2019 or 2020, and 98 companies in our
ASX100 analysis, as two companies did not have a three-year TSR.
ASX 300 ASX 100
99 companies (35%) have an aligned 39 companies (40%) have an aligned
relative positioning over three years, as the relative positioning over three years.
change in relative TRP and TSR is similar.
30 companies (31%) overpaid their CEOs,
103 companies (37%) have overpaid their CEOs, as CEO total realised pay is relatively
as CEO TRP is relatively higher than their higher than their company TSR.
company TSR compared to the market.
29 companies (30%) underpaid their CEOs,
80 companies (28%) have underpaid their CEOs, as CEO total realised pay is relatively
as CEO TRP is relatively lower than their lower than their company TSR.
company TSR compared to the market.
ASX 300: Pay for Performance ASX 100: Pay for Performance
Alignment (2018-2020) Alignment (2018-2020)
Source: CGLytics Source: CGLytics
40%
40% 40%
37%
35%
35% 35%
31%
30%
30% 30%
28%
25% 25%
20% 20%
15% 15%
10% 10%
5% 5%
0% 0%
Aligned Overpaid Underpaid Aligned Overpaid UnderpaidMore About Pay than About Performance: Trends to Watch for the 2021 ASX Proxy Season 12
CEO Pay for Performance Alignment
After COVID-19 Pay Cuts
CGLytics compared the projected and actual CEO pay (TRP) and company performance (TSR) alignments of
the ASX 300 and ASX 100 companies for the year 2020. The projected 2020 figures used in this analysis
are based on 2019 data and take into consideration the promised pay cuts resulting from the pandemic.
The analysis indicates that the expected COVID-19 pay cuts made by the companies did not contribute to
aligning companies’ CEO pay and company performance. Furthermore, the data shows that the ASX 300
has a higher proportion of companies that overpaid their CEOs when compared to the ASX 100.
ASX 300 ASX 100
There was a 19% decrease in aligned companies. CGLytics created the same CEO pay for performance
There was a 16% increase in companies that analysis for ASX 100 companies using the same data.
overpaid their CEOs. There was a 6% decrease in aligned companies.
There was a 3% increase in companies that There was a 7% increase in companies that overpaid
underpaid their CEOs. their CEOs
There was a 3% increase in companies that
underpaid their CEOs.
ASX 300: Projected 2020 vs Actual 2020 ASX 100: Projected 2020 vs Actual 2020
Source: CGLytics Source: CGLytics
45% 45%
43%
41%
40% 40% 40%
36%
35% 35%
33%
31%
29% 30% 30% 29%
30% 30%
28% 28%
25% 25%
20% 20%
15% 15%
10% 10%
5% 5%
0% 0%
Aligned Overpaid Underpaid Aligned Overpaid Underpaid
Projected 2020 Actual 2020 Projected 2020 Actual 2020More About Pay than About Performance: Trends to Watch for the 2021 ASX Proxy Season 13
CEO Three-Year Pay for
Performance Positioning
(ASX 100)
2018-2020 Pay for Performance Alignment (ASX 100)
CEO Total Realised Pay vs TSR
Source: CGLytics
3Y Sum Total Realised Pay
(percentile ranking)
100th
50th
0th
0th 50th 100th
Performance Indicator TSR
(percentile ranking)More About Pay than About Performance: Trends to Watch for the 2021 ASX Proxy Season 14
The retail and consumer goods companies are 12 companies are aligned.
represented under the consumer discretionary 13 companies overpaid their CEOs.
sector and represent one of the most severely
Nine companies underpaid their CEOs.
impacted sectors in Australia. Subsequently,
ASX 300 companies in the consumer discretionary Among the six consumer discretionary companies
sector show a high degree of misalignment. that received strikes, four of them overpaid their
CEOs. This indicates that a company’s executive
compensation alignment may influence
shareholder voting.
CEO One-Year Pay for Performance Positioning (Consumer Discretionary Industry)
Source: CGLytics
CEO Total Realised Pay
(percentile ranking)
3Y Total Shareholder Return
(percentile ranking)More About Pay than About Performance: Trends to Watch for the 2021 ASX Proxy Season 15 Governance Trends Going into 2021 Proxy Season AGMS The two-strike rule introduced to Australia in 2011 has This proposed rule has provoked reluctance from fostered greater company accountability regarding some advisory firmsxv. Glass Lewis stated that there executive pay. With shareholders thus having more was little evidence to suggest the existence of voting power over executive remuneration, they have such serious problems as to garner the proposal sought professional services from proxy advisory of a new rulexvi. Furthermore, the Australian Securities firms to provide non-binding recommendations. and Investments Commission (ASIC) conducted Although the two-strike rule balanced the status quo a multi-year consultation and field study that between investors and companies, a new proposed concluded issues regarding advisory firm proxy rule by the Australian Federal Treasury (AFT) influence over investors are largely overstatedxvii. could significantly impact the existing two-strike Holding online/virtual AGMs was not permitted under rulexiii. According to the proposal, proxy advisory the Corporations Act. However, this has changed in firms would be required to make their advice current circumstances due to restrictions on travelling available to companies five days before it is and social distancing. Based on guidance published available to their clients. by ASIC, most companies held their AGMs in a hybrid Furthermore, Australia’s major advisory firms would form, where both physical presence and virtual have to demonstrate that they are ‘meaningfully facilities are enabled. This has subsequently resulted independent’ from superannuation funds to in many companies altering their constitution to promote greater transparencyxiv. accommodate this new method of holding AGMs. This new proposal is still in its early stages and has not had any assumed impact on corporate governance. The new rule intends to promote greater transparency between investors and the board and may help companies prepare for and mitigate the risk of second strikes.
More About Pay than About Performance: Trends to Watch for the 2021 ASX Proxy Season   16

Climate Change
A significant trend over the past several years is investor focus on environmental, social and governance (ESG)
issues, particularly climate change and the promotion of diversity in corporate leadership. With widespread
awareness of climate change and multinational climate agreements such as the Paris Agreement, companies
and investors have placed a considerable emphasis on becoming carbon-neutralxviii.
This environmental issue was brought up as one of the voting items for an energy company in their 2020
AGM. More than 50% of shareholders voted for a climate change resolutionxix. This is a prime example of
how committed investors can be to ensure company operations transition to less carbon-intensive means
and ultimately aim to be carbon neutralxx . While it remains uncertain what impact regulators will have
regarding environmental issues, investors and their expectations are enough to push businesses in a more
environmentally friendly direction.
Beyond the previously mentioned strategies, there have been various multinational initiatives to hold
companies accountable for their environmental impact. Global Reporting Initiative (GRI), which is used by over
2,000 organisations worldwide, and the Task Force on Nature-Related Financial Disclosures (TNFD) are two
examples of such initiatives aimed at supporting investors to finance environmentally friendly companiesxxi.
While these initiatives are in the early stages, they may have considerable influence over corporate
governance in the future.
More About Pay than About Performance: Trends to Watch for the 2021 ASX Proxy Season                                      17

ESG Performance Measures
A method used by companies to demonstrate their
commitment to ESG issues is to incorporate them                        No. of Companies with ESG-related
                                                                       KPIs by Index
into executive key performance indicators (KPIs).                      Source: CGLytics

Our analysis demonstrates how companies have                           120
                                                                                                                                                115
implemented ESG metrics into executive KPIs in
                                                                       100
2019 and in 2020. The number of companies that                                                                                     95

have introduced ESG performance metrics has                            80

increased over the last year, with a 24% increase
                                                                       60                                    57
for ASX 100 companies and a 21% increase for                                                  46

ASX 300 companies. Across ASX 300 companies,                           40

115 companies have applied ESG metrics, resulting                      20

in a total of 38% of the ASX 300 now employing
                                                                       0
ESG metrics.                                                                                       ASX 100                           ASX 300

                                                                                                         2019                2020

Although climate change is considered the principal
subject matter within the ESG sphere, the largest                     Distribution of ESG-related KPIs
                                                                      Source: CGLytics
classification goes to the social element of ESG.
These classifications include policies surrounding
                                                                                        160
such issues as health and safety, diversity and                                                                                148

inclusion, and workplace culture.                                                       140
                                                                                                                    129
                                                                     No. of Companies

                                                                                        120

                                                                                        100

                                                                                        80

                                                                                        60                   58

                                                                                        40          35
                                                                                                                                                      28
                                                                                        20                                                     14

                                                                                        0
                                                                                                   Environmental          Social               Governance

                                                                                                             2019                  2020
More About Pay than About Performance: Trends to Watch for the 2021 ASX Proxy Season 18
As the number of companies that have introduced ESG metrics is increasing, the weighting given to these
metrics also indicates some growth; however, the overall weights still seem moderate.
Aggregating all KPIs and their weights that were applied at ASX 300 companies, the average weight of
social indicators stood at 5.3% in 2019 and 6.3% in 2020. Environmental metrics accounted for 1.5% in 2019
and 2.1% in 2020, which indicates 42% growth in the weighting of these indicators in course of one year.
Governance metrics reached 1.1% in 2020.
The aggregated weighting of environmental, social and governance factors stood at 9.5% in 2020, which is
higher than the weight in 2019 by 1.9 percentage points. This may be an indication that ESG metrics will
play a more prominent role within performance indicators.
Average Weightings of ESG KPIs (%)
Source: CGLytics
7%
6.3%
6%
5.3%
5%
4%
3%
2.1%
2%
1.5%
1.1%
1% 0.8%
0%
Environmental Social Governance
2019 2020More About Pay than About Performance: Trends to Watch for the 2021 ASX Proxy Season 19
When comparing the use of ESG metrics in KPIs across industries, the carbon-intensive sectors have
introduced a higher usage rate. The energy sector incorporated the greatest number of ESG metrics,
followed by the materials and industrials sectors in 2019. However, the utilities sector has shown the
greatest growth in ESG metric utilisation, from only 9% in 2019 to 15% in 2020. The carbon-intensive
industries and sectors arguably place greater importance on ESG metrics given their greater need to
reach carbon neutrality targets.
Average Utilisation of ESG-related KPIs by Sector
Source: CGLytics
18%
16%
16% 15%
14%
14%
12% 11% 11%
10%
10% 9% 9% 9%
8%
8% 7% 7%
6% 5%
4% 3% 3%
2% 2% 2%
2% 1%
0%
0%
Information Utilities Industrials Materials Financials Energy Healthcare Consumer Communication Consumer
Technology Discretionary Services Staples
2019 2020
In summary, our data shows that several companies have already included some ESG-related indicators
in the executive performance evaluation, and the number of these companies has grown over the past
few years. In addition, the weight of ESG metrics has also seen some growth and further growth is expected
in the forthcoming years. This is in line with the increasing demand from investors for companies to disclose
ESG goal setting.More About Pay than About Performance: Trends to Watch for the 2021 ASX Proxy Season 20
Resources
i
https://www.smh.com.au/business/companies/shame-on-companies-that-use-jobkeeper-subsidy-to-pay-
executive-bonuses-20210127-p56xab.html
ii
https://www.abc.net.au/news/2021-02-12/ato-and-jobkeeper/13145990
https://www.abc.net.au/news/2021-03-29/jobkeeper-ends-what-now-for-australian-businesses/100031668
iii
March 2021
iv
http://www.roymorgan.com/findings/8722-australian-unemployment-estimates-may-2021-202106040743
v
https://www.smh.com.au/business/markets/asx-to-fall-scene-set-for-fiery-crown-agm-20201022-p567fq.html
https://client.cglytics.com/media/documents/6d/a1/6da109962fca6565a3028fa874703814d73c23e3/2020.
vi
pdf?v=1600297989
https://client.cglytics.com/media/documents/dd/7b/dd7b729cb42c6b62c9bbd4a3d06e9eab09b4ad1b/2020.
vii
pdf?v=1614211263
https://cdn-api.markitdigital.com/apiman-gateway/ASX/asx-research/1.0/file/2924-02250164-
viii
2A1234051?access_token=83ff96335c2d45a094df02a206a39ff4
ix
https://www.abc.net.au/news/2020-04-17/ceo-pay-cuts-during-coronavirus-should-not-impress-us/12149380
x
https://aicd.companydirectors.com.au/membership/company-director-magazine/2020-back-editions/october/
so-your-board-and-ceo-took-a-pay-cut-during-the-pandemic-now-what
xi
https://www.abc.net.au/news/2020-04-17/ceo-pay-cuts-during-coronavirus-should-not-impress-us/12149380
https://client.cglytics.com/media/documents/db/d9/dbd936eb61d5de91b3fac2f8d71b36e6cc38577b/2020.
xii
pdf?v=1600733786
xiii
https://treasury.gov.au/sites/default/files/2021-04/c2021-169360_consultation_paper.pdf
xiv
https://treasury.gov.au/sites/default/files/2021-04/c2021-169360_consultation_paper.pdf
xv
https://www.manifest.co.uk/australian-investors-hit-out-at-planned-proxy-rules/
xvi
https://www.glasslewis.com/call-for-comment-on-australian-treasurys-counter-productive-proxy-reforms/
xvii
https://www.glasslewis.com/call-for-comment-on-australian-treasurys-counter-productive-proxy-reforms/
xviii
https://unfccc.int/process-and-meetings/the-paris-agreement/the-paris-agreement
Freeburn, Lloyd and Ramsay, Ian, An Analysis of ESG Shareholder Resolutions in Australia (October 5,
xix
2020). University of New South Wales Law Journal, Vol. 44, No. 3, 2021, forthcoming, Available at SSRN:
https://ssrn.com/abstract=3859264
xx
https://www.manifest.co.uk/oil-giants-under-pressure-a-turning-point-for-esg-investing/
xxi
https://www.manifest.co.uk/new-commitments-to-biodiversity-from-government-and-business/Acknowledgements Authors:
ALEX CO
Senior Analyst (APAC)
ANDRAS NYESTE
Senior Analyst (EMEA)
EDNA TWUMWAA FRIMPONG
Head of International Research, Diligent Institute
Quantitative Analysis:
Danai Kekatou
Data Science Analyst at CGLytics,
a Diligent brand
Design:
Stephanie Lane
Graphic Designer, Steph Lane Designs
© 2020 Diligent Corporation. “Diligent” is a trademark of Diligent Corporation, registered in the US Patent and Trademark Office. “Diligent Boards” and
the Diligent logo are trademarks of Diligent Corporation. All third-party trademarks are the property of their respective owners. All rights reserved.You can also read