GrassCheck GB End of year report - Year 1: 2019
←
→
Page content transcription
If your browser does not render page correctly, please read the page content below
1

                                            GrassCheck GB

                               End of year report – Year 1: 2019

Project outline and aims

GrassCheck GB is a project run by AFBI, Rothamsted Research and
CIEL, with sponsorship and involvement from several prominent
industry partners. Support is received from the red meat levy
boards in each GB region; AHDB Beef & Lamb, QMS and HCC.
During year 1 GrassCheckGB was also sponsored by Germinal,
Handley Enterprises Ltd, Sciantec Analytical and Waitrose &
Partners. The project also involves data collection from a network
of collaborative farms including Beef, Sheep and Dairy producers
around GB.

The current project is running from 2019-2021 and aims to
provide a detailed understanding of grass growth potential
across GB, as well as identifying the actual variability in grass
production and utilisation on commercial farms, to identify and
better understand the key drivers behind these on-farm.

GrassCheck GB publishes a weekly bulletin containing grass
growth and quality information for the last 7 days, alongside
management notes to assist GB grassland farmers with
management decisions throughout the grazing season.

A total of 50 commercial livestock farms spread around GB
(Figure 1) are participating in the project, with a diverse mixture
                                                                      Figure 1: GrassCheck GB Farm
of production systems, land types and management styles, all
                                                                      locations. Blue = Dairy farms, red =
providing grass and weather data from a broad spectra of GB
                                                                      Beef & Sheep farms.
farms. Farms are split into 4 geographic regions: South England
(SE), North England (NE), Scotland and Wales.

As well as collecting weekly grass growth rate data through AgriNet Grass, a grassland management software
for farms, all GrassCheckGB farms have internet-connected automated weather stations installed, monitoring
on-farm weather conditions 24/7, and uploading detailed weather information to a cloud-based data storage
system every 30 minutes.
2
Executive Summary
Highlights from the 2019 grazing season:
On-farm grassland productivity from grazing pastures in the 2019 grazing season (March-October)
averaged 11.012 t DM/ha across all GrassCheckGB farms, just over 1 t behind the long-term average
of 12.175 t DM/ha.
On average, dairy farm yields were highest at an average of 13.940 t DM/ha compared to 9.663 t
DM/ha on average from Beef & Sheep farms
Differences in regional yields recorded appeared largely linked to weather conditions experienced
throughout the season, being lowest in the South of England (10.262 t DM/ha) where the most
extreme dry conditions were recorded during the summer months, during which time average daily
growth rates dropped as low as 22.1 kg DM/ha/d, followed by below-average growth in the autumn
when very heavy rainfall was recorded (averaging 140% of expected rainfall from August-October).
Average yields from grazing paddocks in the North of England, Wales and Scotland were 11.363,
11.125 and 11.298 t DM/ha respectively, where recorded grass growth rates were closer to the 2019
GB average throughout this season.
Grass utilisation during 2019 was high across all farms, averaging 79%. Individual farm utilisation
figures ranged from 47-99%. The highest figures represent farms that were consistently achieving
residuals close to 1500 kg DM/ha, with close grazing management (including some sheep farms, for
which grazing would target residuals 600 followers and an average of 16.8K impressions
per month (April-October) from tweets published. The GrassCheckGB website recorded on average
239 unique visitors per month, with a total of 452 average visits per month.
3

2019 GB Grass Growth Summary

The 2019 grazing season began with exceptionally high growth rates, measuring well above the long-term
average for March in all 4 regions across the GrassCheckGB project. The highest March grass growth rates
were seen on GrassCheckGB dairy farms, reaching 38 kg DM/ha/d on the 22nd March, compared to 22.6 kg
DM/ha/d on GrassCheck beef & sheep farms, and the long-term average of 15.7 kg DM/ha/d for the same
week. Overall, growth peaked on GrassCheckGB Dairy farms on May 24th, at 77.8 kg DM/ha, and on beef &
sheep farms on June 7th at 68.9 kg DM/ha. The long-term grass growth curve peaks at 73.9 kg DM/ha in the
first week of June. The 2019 growth curves recorded for GrassCheckGB dairy and beef & sheep farms is shown
in Figure 1, compared to long-term average figures.

                                90

                                80

                                70
  Grass growth (kg DM/ha/day)

                                60

                                50

                                40

                                30

                                20

                                10

                                0
                                01-Mar   01-Apr        01-May   01-Jun      01-Jul      01-Aug       01-Sep       01-Oct   01-Nov

                                                  Dairy farms      Beef & Sheep farms            Long-term growth curve

Figure 1: GrassCheckGB grass growth curve from March to October 2019, average growth estimated weekly
across all GrassCheckGB dairy farms, beef & sheep farms, and long-term average weekly grass growth rates
for GB.

Average grass growth was also summarised weekly on a regional basis, and regional growth curves, including
growth data from all farms within each region (regardless of production system, but adjusted to account for
any unbalance between numbers of beef & sheep or dairy farms present), is shown below in Figures 2A-D.
Overall, between March and October 2019 the highest average grass yield from GrassCheckGB weekly growth
rate summary figures was recorded from the NE, at 11.363 t DM/ha. Farms in Scotland recorded average grass
production of 11.298 t DM/ha, closely followed by Welsh farms, growing an average of 11.125 t DM/ha from
grazing land. Farms in SE recorded only 10.262 t DM/ha in 2019, largely owing to well below average grass
growth in July and early August, and in the autumn also (Figure 2B). The overall GB average grass yield
recorded from grazing paddocks for the 2019 season from March to October was 11.012 t DM/ha, about 1 t
below the long-term average of 12.175 t DM/ha.
4
A) Regional grass growth 2019 - N. England
90
80
70
60
kg DM/ha/day
50
40
30
20
10
0
01/03/2019 20/04/2019 09/06/2019 29/07/2019 17/09/2019
Long-term growth curve Average farm growth NE
B) Regional grass growth 2019 - S. England
90
80
70
60
kg DM/ha/day
50
40
30
20
10
0
01/03/2019 20/04/2019 09/06/2019 29/07/2019 17/09/2019
Long-term growth curve Average farm growth SE5
C) Regional grass growth 2019 - Wales
90
80
70
60
kg DM/ha/day
50
40
30
20
10
0
01/03/2019 20/04/2019 09/06/2019 29/07/2019 17/09/2019
Long-term growth curve Average farm growth Wales
D) Regional grass growth 2019 - Scotland
90
80
70
60
kg DM/ha/day
50
40
30
20
10
0
01/03/2019 20/04/2019 09/06/2019 29/07/2019 17/09/2019
Long-term growth curve Average farm growth Scot
Figure 2: Regional average grass growth recorded weekly in March-October 2019, compared to the average
for all GrassCheckGB farms and to the long-term average. A) Northern England (NE), B) Southern England (SE),
C) Wales, D) Scotland.6
Monthly grass growth performance
In all regions during March the grass yields recorded were above the long-term average, and highest in the
SE which saw growth at 190% of the long-term average. The mild winter and spring conditions experienced
in early 2019 (Met Office, 2019a, 2019b) will have contributed to increased grass growth in March and the
preceding winter months. This trend continued into April in Scotland and SE, but yields fell slightly below the
long-term average in NE and Wales. May and June yields were closer to the long-term average, but July saw
all regions except NE saw yields drop significantly. Autumn grass yields from grazing paddocks again fell
below the long-term average, and were consistently lowest in SE.
Regional average grass yields per month in 2019
2500
2000
1500
Kg DM/ha
1000
500
0
March April May June July August September October
Scotland NE SE Wales LT
Figure 3: Regional average grass yields per month across GrassCheck GB farms, compared to the long-term
average GB yield per month. Yields are calculated based on the grass growth data entered into AgriNet for
each GrassCheck GB farm, and from the long-term GB grass growth rate. Regions shown are; Scotland, the
north of England (NE), the south of England (SE), Wales, and the long-term (LT) GB average.7
Grass performance by sector
The GrassCheckGB grass growth curves published in each weekly bulletin were separated into growth rates
on Dairy and Beef & Sheep farms (Figure 1). This was primarily to account for expected differences in the grass
production intensities between these sectors, and because dairy systems are also largely located in areas with
lowland, productive pastures rather than the more upland sites which are typical of many British Beef & Sheep
farms. Values for the average total grass grown across GrassCheckGB Dairy and Beef & Sheep farms between
March and October 2019 were 13.940 t DM/ha and 9.663 t DM/ha respectively, compared to the long-term
GB average of 12.175 t DM/ha. Differences in the monthly grass grown between farms in each of these sectors
is shown in Figure 4.
Average grass yields for each sector (Dairy or Beef & Sheep) in 2019
3000
2500
2000
kg DM/ha
1500
1000
500
0
March April May June July August September October
Beef Dairy Longterm Av.
Figure 4: Average monthly grass yields recorded on GrassCheckGB farms in 2019 between March and October
by production sector (Dairy or Beef & Sheep).8
Individual farm grass performance
Annual grass production across the grazing platforms on individual GrassCheckGB farms varied greatly. Total
yields recorded on GrassCheckGB dairy farms ranged from 8.6-16.7 t DM/ha, and on beef & sheep farms from
5.2-14.1 t DM/ha. These values include only farms for which a complete dataset covering March-October was
available. The variation in total grass production for grazing across all dairy farms is shown in figure 5, and for
Beef & sheep farms in Figure 6. Faded columns on each of these graphs indicate values from farms which were
excluded from the overall averages stated above for various reasons in order to ensure a fair comparison.
Dairy farms - Grass yields March-October '19
18000
16000
14000
12000
10000
kg DM/ha
8000
6000
4000
2000
0
GC61
GC74
GC55
GC56
GC57
GC58
GC59
GC60
GC62
GC52
GC68
GC69
GC70
GC71
GC100
GC96
GC97
GC98
GC99
GC73
GC84
GC85
GC86
South England North England Scotland Wales
Figure 5: Total grass yields (from grazing) recorded for March-October 2019 on GrassCheckGB dairy farms.
B&S farms - Grass yields March-October '19
14000
12000
10000
kg DM/ha
8000
6000
4000
2000
0
GC88
GC51
GC54
GC63
GC64
GC65
GC67
GC53
GC66
GC72
GC87
GC89
GC90
GC91
GC92
GC93
GC94
GC95
GC75
GC76
GC77
GC78
GC79
GC80
GC81
GC82
GC83
South England North Scotland Wales
England
Figure 6: Total grass yields (from grazing) recorded for March-October 2019 on GrassCheckGB beef & sheep
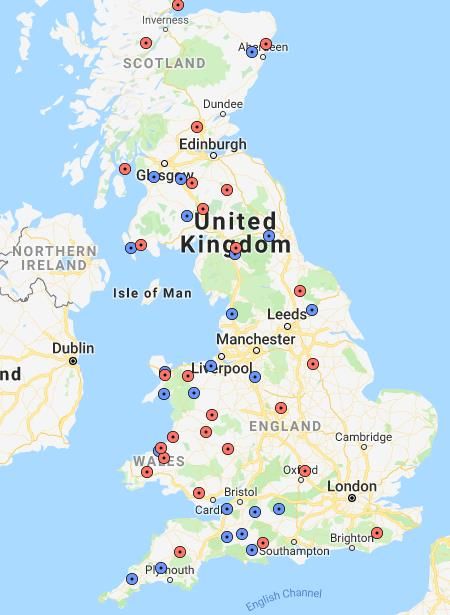
farms.9 Factors influencing grass yields A multitude of factors are important to consider when assessing pasture performance. These include the age of grass leys, reseeding history and seed mix composition, paddock soil type and topography, nitrogen and other mineral fertiliser inputs, manure and slurry applications, soil nutrient status, testing history, pH and any degree of soil compaction, as well as the grazing management of each paddock throughout the season. The AgriNet farm management software through which GrassCheckGB grass performance data is obtained provides additional metrics available to farmers to aid them in making assessments of paddock performance across their grazing platform. The AgriNet ‘best paddocks’ function indicates the range of yields achieved across all paddocks (including silage production) where this data has been entered into AgriNet, and can highlight poor-performing areas. An example of the ‘Best Paddocks’ chart is shown below in Figure 7 from the Rothamsted Research GrassCheck51 account. In the supplementary individual reports provided to individual GrassCheckGB farmers they are advised to review this area of their AgriNet account and consider the performance shown for various fields across the platform alongside knowledge of paddock histories. Further discussion around this area at farmer meetings and through WhatsApp is encouraged. Figure 7: Example best paddocks card available in the AgriNet farm management software online platform. GrassCheck 51 (Rothamsted Research).
10

Grass Utilisation on-farm

The average grass utilisation achieved by each GrassCheckGB farm where grazing events were recorded between March and October 2019 was calculated as
the percentage of the offtake from the available grazing cover over 1500 kg DM/ha (representative of a 4 cm post-grazing residual) and is shown in Figure 8.

  100.0

   90.0

   80.0

   70.0

   60.0

   50.0

   40.0

   30.0

   20.0

   10.0

    0.0
           GC53
           GC66
           GC72
           GC87
           GC94
           GC93
           GC89
           GC91
           GC92
           GC95
           GC90
           GC88
           GC65
           GC67
           GC64
           GC54
           GC63
           GC81
           GC76
           GC77
           GC79
           GC82
           GC83
           GC78
           GC80
           GC71
           GC68
           GC69
           GC52
           GC70
          GC100
           GC98
           GC97
           GC96
           GC99
           GC59
           GC58
           GC55
           GC57
           GC61
           GC62
           GC56
           GC60
           GC74
           GC84
           GC73
           GC85
           GC86
           North            Scotland           South England         Wales           North England    Scotland          South England         Wales
          England
                                         Beef & Sheep                                                               Dairy

Figure 8: Average utilisation of available grass >1500 kg DM/ha across all GrassCheckGB farms, for all paddocks grazed during 2019

Average utilisation across all GrassCheckGB farms in 2019 was 78.7% of grass available above 1500 kg DM/ha. Individual farm figures ranged from 47.3-98.8%.
The number of grazings recorded per paddock will have been influenced by both paddock size, stocking rate and the duration of grazing breaks, thus these
11
figures are likely to be more informative on an individual farm level when compared between years. The
average number of grazings per paddock was calculated across GrassCheckGB farms at 4.7 grazings per
paddock, with individual farm figures ranging from 1.0 - 9.6 grazings per paddock.
Several farms achieved a very high average grass utilisation of >90%, with these figures being achieved by
farms which consistently achieved low post-grazing residuals near to the target 1500 kg DM/ha (Table 1).
Whilst this ‘target’ is advised to maximise both the quality and quantity of grass re-growth through the grazing
season, to ensure a balance between grass and animal productivity several farms (particularly dairy farms) will
have set higher post-grazing residual targets for some or all stock. Conversely, with sheep grazing systems a
lower target post-grazing residual may be appropriate. Assessment of grass utilisation should therefore be
considered alongside individual farm targets, and this will be highlighted in feedback provided to individual
farms. Some of the lower grass utilisation values were returned for farms that saw difficult grazing conditions
due to drought or heavy rain at various points throughout the season, or were grazing particularly high pre-
grazing covers, meaning clearing out paddocks to a 1500 kg DM/ha grazing residual will have been more
challenging.
Table 1: Individual farm grass utilisation and grazing residual data. Values are presented as an average of all
figures collected for all paddocks detailed in AgriNet for each individual farm throughout the March-October
grazing season.
Type Region GC Av. Av. Grazings per Av. Pre- grazing Av. Post-grazing
Utilisation paddock cover cover
Beef & North GC53 65.3 1.8 2155 1712
Sheep England GC66 86.6 3.4 3100 1701
GC72 54.0 5.8 2649 2008
Scotland GC87 86.1 5.5 3065 1663
GC94 87.1 3.7 3059 1700
GC93 66.6 6.4 2862 1970
GC89 77.8 3.2 2538 1700
GC91 68.6 3.0 2869 1838
GC92 75.8 3.3 2952 1806
GC95 85.6 1.0 4330 1930
GC90 75.9 5.2 3496 1910
GC88 98.8 2.9 3315 1521
South GC65 93.5 3.1 3211 1544
England GC67 87.2 2.9 3283 1700
GC64 47.3 1.8 3012 2388
GC54 71.8 2.4 3090 1872
GC63 69.2 3.8 3262 2028
Wales GC81 69.0 4.2 3167 1946
GC76 66.3 3.8 2610 1854
GC77 74.1 2.8 2782 1816
GC79 78.2 5.7 2167 1627
GC82 80.0 2.7 2161 1604
GC83 89.3 4.9 3353 1643
GC78 66.1 3.7 2571 1806
GC80 86.9 4.1 2977 162612
Type Region GC Av. Av. Grazings per Av. Pre- grazing Av. Post-grazing
Utilisation paddock cover cover
Dairy North GC71 78.6 5.5 2954 1787
England GC68 83.4 2.6 3012 1694
GC69 85.4 7.8 3020 1706
GC52 92.3 6.1 2907 1559
GC70 79.5 3.7 3458 2010
Scotland GC100 90.5 7.9 3097 1620
GC98 73.6 5.7 3572 2016
GC97 93.6 6.5 2827 1555
GC96 88.5 7.8 2879 1651
GC99 87.6 3.6 2978 1630
South GC59 93.0 4.4 3196 1540
England GC58 68.4 3.8 2589 1687
GC55 77.4 5.9 3266 1841
GC57 67.4 2.2 2879 1843
GC61 61.6 1.2 2692 1883
GC62 61.2 8.3 2678 1935
GC56 81.7 5.7 2581 1658
GC60 68.3 3.3 4052 2255
Wales GC74 80.8 8.4 3724 1901
GC84 95.0 9.6 2806 1522
GC73 87.7 6.8 3043 1660
GC85 97.4 7.6 2998 1504
GC86 79.3 5.1 3297 189113
On-farm nitrogen usage: Preliminary analysis
From the 50 GrassCheckGB farms, 15 Beef and/or Sheep farms and 13 Dairy farms have provided fertiliser
application data for 2019. Of these, 14/15 and 11/13 farms provided datasets which were useable for some
preliminary analysis. An average of the N fertiliser applied across the grazing platform for grazing was obtained
from AgriNet (Figure 9). The range of N input detailed for Beef & Sheep farms was 10.5-121.9 kg N/ha, and for
Dairy farms was 20.4-276.1 kg N/ha.
Figure 9: N fertiliser summary provided by AgriNet as N kg/ha applied to grazing paddocks.
The relationship between the seasonal (March-October) grass yield from each of these farms and the kg N/ha
applied to the grazing platform (as detailed in AgriNet) is shown in figure 10. Data available for Beef & Sheep
farms showed a negative N-response trend, with yield decreasing as N input increased. This response is
contrary to what would be expected, and within the Dairy farm data a positive relationship is shown between
N application rate and grass yield produced (Figure 10). With grass yields on GrassCheckGB Beef & Sheep farms
which supplied fertiliser data ranging from 7,090-14,085 kg DM/ha, it is likely that some of the fertiliser data
available for 2019 via AgriNet which indicated this negative trend was incomplete. Further data obtained over
the coming years of the project will add to this analysis.
Comparison of grazed grass yields and N fertiliser applied per
hectare in 2019 on GrassCheckGB Dairy farms
16000
14000
Grass yield (kg DM/ha)
12000
10000
8000
Dairy
6000
Linear (Dairy)
4000
2000
0
0 50 100 150 200 250 300
Fertiliser applied (kg N/ha)
Figure 10: Comparison of grazed grass yields and N fertiliser applied per hectare in 2019 on GrassCheckGB
Dairy farms.14
2019 weather summary
Following an exceptionally warm winter, July saw weather records being
broken for the highest UK temperature recorded (38.7 °C in Cambridge on
July 25th). Across GrassCheck GB farms the highest temperature recorded
36.8 °C at GC66 in Nottinghamshire. Rainfall in 2019 was also variable, with
GB seeing 152% of the long-term average amount of rain in June, with some
areas receiving more than twice the expected June rainfall in the first half
of the month, followed by dry and hot conditions which continued through
July. The autumn months also saw significantly above-average rainfall in
many areas, with much of England and parts of Wales experiencing flooding
in October, although Scotland was drier than average. Mean monthly
temperatures recorded by the MET Office were 0.5 °C below the long-term
average (Met Office, 2019c), and regional average conditions recorded on
GrassCheckGB farms compared to the 1981-2010 long term average data Figure 11: UK MET Office
available from the Met Office for each region (Figure 11) is shown in regional map.
Appendix 1.
The mid-summer heatwave and dry weather experienced in 2019 coincided with grass growth rates across the
country dropping below the long-term average in July across Wales, Scotland and particularly for the south of
England where grass yields were only 64% of the expected production for this month based on long-term
average grass growth rates. Data from GrassCheckGB soil stations recorded extremely dry conditions on
several farms during the heatwave, especially in the SE where regional average soil moisture readings were
96.1 cb in the month of July, well above the 60 CB threshold where negative impacts on grass growth rates
may be seen. The average grass growth rate for July in the SE was just 39.7 kg DM/ha/d. Average monthly soil
conditions alongside grass growth rates for each region are shown in Table 2. However, in the north of England
less extreme temperatures and higher rainfall boosted grass growth to 118% of the long-term GB average for
this month (Figure 3), and an average growth rate of 53.3 kg DM/ha/d.
Table 2: Average regional monthly soil temperature (ST, °C), soil moisture (SM, cb) and grass growth rates
(kg DM/ha/d) recorded across GrassCheckGB farms in 2019.
SE NE Scotland Wales
Month SM ST GR SM ST GR SM ST GR SM ST GR
Mar 7.5 84.5 36.6 5.1 7.6 25.6 * * 20.7 5.0 8.2 18.8
Apr 27.5 47.1 48.2 28.2 10.2 39.6 14.9 11.2 33.1 16.1 9.9 38.3
May 73.3 31.9 62.2 51.3 11.5 67.3 31.5 11.2 63.8 44.7 12.5 65.8
Jun 46.6 83.8 59.5 25.1 14.2 63.5 15.8 13.4 68.6 21.5 14.5 66.4
Jul 96.1 43.8 39.7 67.4 16.9 53.3 32.2 16.0 65.9 73.4 17.2 53.6
Aug 51.7 72.0 43.0 15.6 16.4 54.8 12.7 15.6 58.3 26.0 16.7 50.8
Sep 57.5 103.0 34.7 54.5 13.8 47.3 11.5 13.1 41.5 18.1 14.4 46.0
Oct 5.4 122.9 21.2 7.1 10.4 23.4 5.7 9.3 23.9 6.4 11.0 27.8
*Weather data was not available for Scottish farms in March prior to the installation of the GrassCheckGB
weather stations.
The combination of cooler and wetter autumn conditions in 2019 coincided with below-average grass yields
for the months of September and October, particularly in England (Figure 3).15 Associations between grass growth rates and on-farm weather data GrassCheck GB added weather data to the weekly published bulletins from 13th May 2019. Management notes included with the weekly GrassCheckGB bulletins aimed to relate current weather trends to observed or likely impacts on grass performance across GB, where relevant. Preliminary statistical analysis has revealed that multiple meteorological factors were associated with on-farm grass growth rates during 2019. Using univariate regression analysis, solar radiation, soil moisture and temperature, average and max/min air temperature and solar energy were significantly (P≤0.002) associated with grass growth rates. However, in a multivariate analysis model considering all of these factors, only solar radiation and minimum air temperature remained as significant (P≤0.003) factors associated with grass growth rates throughout the 2019 grazing season. Rainfall and evapotranspiration were not found to be significant at any point. Further data collected throughout the course of the GrassCheckGB project will strengthen the statistical analysis of these data, and improve understanding of the relationship between meteorological factors and grass growth performance on GB commercial farms. Second-order regression analysis of weekly regional summary data generated throughout the season from May-October (following the final installation of all GrassCheckGB weather stations) returned a weak correlation of 0.16 between these two variables, but did indicate that average grass growth rates tended to decline once soil moisture readings rose above 60 cb (Figure 12). This finding supports the advisory information provided by the weather station manufactures (Davis Instruments, USA) and aligns with previous experience of this equipment indicating that at soil moisture values >60 cb a negative impact on grass growth rates may be seen. The magnitude of this impact increases as soil conditions continue to dry (and cb readings increase), such that at readings of >128 cb growth rates could be
16

Following the prolonged dry weather experienced in SE, and the heatwave which affected all of GB in July,
summary data from 29th July showed a significant dip to 22.1 kg DM/ha/d (28.2 kg below the LT average of
50.3 kg DM/ha for late July) in SE, occurring in line with minimal rainfall and very dry soil conditions. In the
week preceding this low growth rate, average regional soil moisture readings were 114.4 cb. Readings higher
than 60 cb have the potential to restrict grass growth and reduce maximum yield but this depends on local
climate and rainfall amounts, land drainage, soil type, and management practices. Table 3 gives more
information on soil moisture scores and their interpretation.

Table 3: GrassCheck soil moisture readings and interpretation.

 Soil moisture (cb)       Interpretation
 0 to 10                  Saturated soil. Occurs for a day or two after irrigation or plentiful rainfall.
 11 to 20                 The soil is adequately wet, except for coarse sandy soils which will begin to
                          dry out in this range due to their easily-draining nature.
 21 to 60                 Towards the upper end of this range irrigation or watering would now be
                          advised to maintain optimum soil moisture content, except for heavy clay
                          soils.
 61 to 100                Grass growth could be restricted in this range as plants struggle to take up
                          sufficient water from the soil. Heavy clay soils would benefit from
                          irrigation/watering.
 > 100                    Soils are extremely dry and grass growth is likely to be significantly
                          reduced at this point, impacting on yield potentials.

Regularly monitoring grass growth rates, soil temperature (in the shoulders of the season) and soil moisture
readings alongside local weather forecasts (which are available in the WeatherLink App provided as a free
download by Davis Instruments, USA) can provide information for on-farm decision support around grazing
and grassland management throughout the season, and this information was communicated where relevant
in GrassCheckGB weekly bulletins.
17 Grass Quality summary Throughout 2019 grass quality results were good overall, with metabolisable energy (ME) consistently averaging >11 MJ/kg DM. Grass dry matter (DM) was changeable (average weekly values ranged from 14.4- 29.0%), largely affected by weather conditions around sampling. From early July the proportion of water soluble carbohydrates (WSC, %) was seen to decline as crude protein (CP, %) values rose, highlighting this common trade-off in the nutrient composition of grass samples. Throughout the year CP values averaged 19.5% overall, with all weekly averages being >13.8%, which should be sufficient to meet the protein requirements of most grazing stock. The weekly variation in key grass quality parameters is shown in Figures 13 A-D. Statistical analysis (Table 3) was performed as an unbalanced ANOVA of all weekly submitted grass samples, with season of sampling (spring, summer or autumn) set as a blocking factor. Multiple comparisons were made for average values from each of the four regions using the Bonferroni correction. Significant differences (P
18

                         Weekly variation in DM (%)                                                          Weekly variation in CP (%)
  45.0                                                                                35.0
  40.0
                                                                                      30.0
  35.0
  30.0                                                                                25.0
  25.0                                                                                20.0
  20.0
                                                                                      15.0
  15.0
  10.0                                                                                10.0
   5.0                                                                                    5.0
   0.0
                                                                                          0.0

  A                                spread      average                                B                               spread      average

                        Weekly variation in WSC (%)                                                    Weekly variation in ME (MJ/kg DM)
      35.0                                                                                13.0
                                                                                          12.5
      30.0
                                                                                          12.0
      25.0                                                                                11.5
      20.0                                                                                11.0
                                                                                          10.5
      15.0                                                                                10.0
      10.0                                                                                 9.5
                                                                                           9.0
       5.0
                                                                                           8.5
       0.0                                                                                 8.0

  C                                spread      average                                D                               spread      average

Figure 13 A-D: GrassCheck GB weekly grass quality results. A = % Dry Matter, B = % Crude Protein, C = % Water Soluble Carbohydrates (sugars), D = Metabolisable Energy
(MJ/kg DM). Averages are shown as the yellow line and the difference between the highest and lowest values for samples received each week is shown by the shaded area.
19
Knowledge Transfer activities
During 2019 GrassCheckGB produced 31 bulletins covering April-October 2019. These were published in the
Farmers Guardian with a circulation of ~29.5K. The GrassCheckGB twitter page (@GrasscheckGB) also posted
each weekly bulletin, achieving on average 16.8K impressions each month (April-October), as shown in Table
4, and on the GrassCheckGB website (www.grasscheckgb.co.uk). The GrassCheckGB website recorded over
1,676 unique visitors, and 3,169 views in total during 2019. A summary of monthly website activity is detailed
in Table 5. Bulletins detailed summary data for regional grass growth rates and relevant weather information
(weekly rainfall and soil temperature in the shoulders of the season, soil moisture readings in the mid-season
period) from GrassCheckGB commercial farms.
Table 4: Monthly analytics for the GrassCheckGB twitter account during 2019 (@GrasscheckGB)
Month Tweets Impressions Profile visits Mentions New followers
February 0 836 6 1 95
March 0 264 245 19 58
April 2 10,100 674 34 171
May 6 21,100 599 56 95
June 4 18,900 215 13 32
July 4 16,500 194 8 30
August 3 12,900 176 27 31
September 5 17,000 145 21 28
October 5 20,900 142 19 35
November 0 4,012 32 18 16
December 0 996 5 2 4
Average (April-October only) 4 16,771 306 25 60
Through both the farming press and social media platforms the GrassCheckGB weekly bulletins reached a
broad audience within the farming community. By providing relevant, timely information for grassland farmers
GrassCheckGB facilitated clear knowledge transfer to support and inform grassland management decisions,
assisting farmers in increasing grass production and utilisation in their grazing systems.
Table 5: Website visitor statistics for www.grasscheckgb.co.uk during 2019.
Jan- Feb- Mar- Apr- May- Jun- Jul- Aug- Sep- Oct- Nov- Dec-
Month Total
19 19 19 19 19 19 19 19 19 19 19 19
Unique
0 0 1 37 397 409 209 12 307 304 0 0 1,676
visitors
Number
0 0 5 93 723 1,097 293 13 494 451 0 0 3,169
of visits20 Conclusions The 2019 grazing season saw very changeable weather conditions, with both extremely dry and extremely wet weather seen at times. Despite some challenging grazing conditions arising as a result of the changeable weather, on average GrassCheck GB farms have produced grass yields close to expected based on long-term average growth rates (11.012 t DM/ha, vs the long-term average of 12.175 t DM/ha). Differences were seen in the average yields grown on both a regional (NE 11.363 t DM/ha, Scotland: 11.298 t DM/ha, Wales: 11.125 t DM/ha, SE: 10.262 t DM/ha) and sector (Dairy: 13.940 t DM/ha, Beef & Sheep: 9.663 t DM/ha) basis. Individual farm yields were wide ranging, and on farms inputting regular data these ranged from 5.2 to 16.7 t DM/ha. The highly variable weather conditions recorded throughout the 2019 season both between regions, and between individual farms, can explain much of this variation, but other factors contributing to higher or lower grass production between farms will be discussed in depth at the end of year meetings, or can be a discussion topic for the GrassCheck WhatsApp forums. Further individualised supplementary results tables, including individual paddock performance in terms of grass utilisation, farm grass growth curves and monthly grass yields from the grazing platform, along with monthly weather summary data and full grass quality results for 2019 will be provided to each individual project farmers at end of year meetings during January 2020. GrassCheckGB is very thankful for the support received from all the project sponsors during Year 1. Particular thanks are also extended to the great team of GrassCheckGB project farmers for their work in providing data in support of this project. Future work Looking ahead to the 2020 season, additional commercial sponsorship was agreed at the end of 2019, and Datamars UK will be joining the GrassCheckGB project at the start of the second year. Discussions of any further potential project sponsorship opportunities will continue going forward. GrassCheckGB will continue to collect grassland performance data through our network of project farmers. This data will help us to build a greater, more comprehensive picture of on-farm grass performance across the country under a wide range of conditions. Further analysis will include a more detailed investigation of the relationships between on-farm grass growth and fertiliser and manure/slurry applications. Early in 2020 animal production data from the 2019 grazing season (milk yields from dairy, average daily liveweight gain in finishing beef/lamb stock) will be collated from GrassCheckGB project farms. Animal performance data will be compared to farm grass growth, quality and utilisation figures to investigate any relationship between grass performance, grazing management and animal performance results. The results of this will be provided as feedback to individual farms. We will continue to produce weekly bulletin publications throughout the growing season, summarising regional grass growth rates, trends in grass quality results, and weather and soil conditions. By providing timely feedback through these bulletins not only to GrassCheckGB project farmers, but to the wider GB farming community through the farming press (Farmers Guardian) and social and online media. The information and accompanying management notes contained in these bulletins will continue to support grassland farmers with grazing and grassland management decisions throughout the grazing season. The bank of grass growth and on-farm weather data being collected through this project will also be used to assess the accuracy of grass growth predictions on a 7 and 14 day basis using the existing GrazeGro prediction model (Barrett et al., 2005) developed at AFBI. The work required to adapt this model to produce accurate and reliable grass growth forecasts on a regional basis for GB will be investigated.
21

References
Barrett, P.D., Laidlaw, A.S., Mayne, C.S., 2005. GrazeGro: A European herbage growth model to predict pasture
production in perennial ryegrass swards for decision support. Eur. J. Agron. 23,

Met Office, 2019a. Seasonal summary: Winter 2018/2019.

Met Office, 2019b. Seasonal summary: Spring 2019.

Met Office, 2019c. Seasonal Summary: Autumn 2019.

Report prepared by: K. Huson and D. McConnell, AFBI.
22

Appendix 1: Comparison between long-term average climate data (MET Office, average values for the period
1981-2010) and conditions recorded on GrassCheckGB farms in 2019.

A: England, South

                Average air temperature (°C)              Rainfall (mm)
 Month          England S - 1981- 2019 Difference         England S - 1981- 2019             Difference
                2010                         (°C)         2010                               (%)
 March                 6.6           8.3           1.7               58      84.5                145.7
 April                 8.5           9.6           1.1              55.4     47.1                85.1
 May                  11.7          11.6          -0.1               57      31.9                56.0
 June                 14.5          14.4          -0.1              56.5     83.8                148.2
 July                 16.8          17.7           0.9              57.5     43.8                76.1
 August               16.7          16.7           0.1              62.3     72.0                115.5
 September            14.2          14.6           0.4              63.8     103.0               161.4
 October              10.8          10.7          -0.1               87      122.9               141.2

B: England, North

                Average air temperature (°C)               Rainfall (mm)
 Month          England N - 1981- 2019 Difference          England N - 1981- 2019           Difference
                2010                         (°C)          2010                             (%)
 March                 5.5           7.4          1.9                75.2     27.9               37.1
 April                 7.4          10.3          2.9                64.9     23.0               35.4
 May                  10.4          10.7          0.3                 61      40.6               66.6
 June                 13.1          13.7          0.6                71.9     80.1              111.4
 July                 15.2          17.0          1.8                72.3     97.9              135.3
 August               15.0          16.2         1.2               82.4           98.7          119.8
 September            12.7          13.2         0.5               80.8           115.0         142.3
 October               9.5           8.8        -0.7              100.6            98.5          97.9

C: Wales

               Average air temperature (°C)               Rainfall (mm)
 Month         Wales - 1981-2010 2019 Difference          Wales - 1981-2010    2019       Difference (%)
                                            (°C)
 March                 5.8           7.3          1.5            116.9         55.9           47.8
 April                 7.7           9.1          1.4            89.3          91.5           102.5
 May                  10.7          10.7          0.1            85.9          36.9           42.9
 June                 13.2          13.3          0.1            85.8          132.7          154.6
 July                 15.2          16.2          1.0            92.6          50.0           54.0
 August               15.0          15.8          0.8            107.4         101.7          94.7
 September            12.9          13.7          0.8            116.6         121.9          104.6
 October               9.9           9.7         -0.1            169.6         133.7          78.8
23
D: Scotland
Average air temperature (°C) Rainfall (mm)
Month Scotland - 1981- 2019 Difference Scotland - 1981- 2019 Difference (%)
2010 (°C) 2010
March 4.1 - - 141 - -
April 6.1 10.0 3.9 91.1 15.2 16.7
May 8.9 9.3 0.4 84.5 58.1 68.8
June 11.3 12.5 1.2 88.9 68.0 76.5
July 13.3 15.4 2.1 99.5 88.8 89.2
August 13.0 14.8 1.8 116.7 125.0 107.1
September 10.9 12.2 1.3 136 81.5 59.9
October 7.9 8.0 0.1 175.7 85.0 48.4You can also read