PREMIER INVESTMENTS LTD - 2017 Half Year results overview 21 March 2017
←
→
Page content transcription
If your browser does not render page correctly, please read the page content below

PREMIER INVESTMENTS LTD

2017 Half Year results overview
21 March 2017
Agenda

     Premier Investments
 1   1H17 overview                                   8    Peter Alexander performing strongly

     Premier Investments
 2   1H17 consolidated financial results             9    Online - delivering a world class platform

 3   Premier Retail delivers record sales and EBIT   10   Premier Retail summary

 4   1H17 trading overview                           11   Ordinary interim dividend

                                                          Premier Retail
 5   Premier Retail 1H17 EBIT                        12   brand by brand performance

 6   Premier Retail investing in growth              13

      Smiggle global expansion driving
 7    growth

                                                                                                       X
                                                                                                       1
2
1         Premier Investments 1H17 overview

•   Group profit
    –    Underlying net profit before tax $100.6 million, up 9.7% on 1H161,2
    –    Reported net profit after tax $71.9 million
    –    Ordinary Interim Fully Franked Dividend of 26 cps, up 13.0% (1H16: 23 cps)

•   Premier consolidated balance sheet remains strong
    –    Cash on hand of $279.2 million at end of 1H17
    –    Inventories clean at year end
    –    $58 million property purchase (over 85% debt funded) to become future Melbourne Head Office of Premier
         Retail to support continued growth. Excluding one-off relocation and make-good costs, the ongoing interest
         costs on this investment will be less than the current escalating rent expense at the existing head office
    –    Balance sheet at end of 1H17 shows investment in associate (Breville) as $218.4 million. The current market
         value of this investment $364.1 million3
    –    Franking credit pool of $206.9 million

Note:
1. Group result in 1H16 excludes non-comparable 27th week which contributed $15.2m in sales and $6.6m in EBIT. 1H17 Sales and LFL growth
    percentage is reported on comparable 26 weeks of 1H16
2. Underlying EBIT and NPBT excludes non-recurring costs incurred during 1H17 regarding the finalisation of the one-off litigation matter ($3.0m)
    included within ‘Other Expenses’ in the statutory accounts.
3. Based on share price of $10.18 on 17 March 2017.

                                                                                                                                                    3
1           Premier Investments 1H17 overview

•   Premier Retail contribution to Premier Investments Performance:
    –      Record Sales of $588.6 million, up 7.1% on 1H161
    –      Record Underlying EBIT of $93.0 million, up 10.6% on 1H161,2
    –      Record Underlying Profit before tax of $90.9 million, up 10.8% on 1H161,2
    –      1H17 LFL sales up 2.1%1 on a constant currency basis, on top of record 1H16 LFL growth
    –      Smiggle sales up 26.4% on a record 1H161 and up 81% over 2 years
    –      Peter Alexander sales up 13.8% on a record 1H161
    –      Online sales up 48.0%1 on a record 1H161 and well ahead of market growth
    –      Targeted capital investment program continues to drive future growth

        Note:
        1. Group result in 1H16 excludes non-comparable 27th week which contributed $15.2m in sales and $6.6m in EBIT. 1H17 Sales and LFL growth
            percentage is reported on comparable 26 weeks of 1H16.
        2. Underlying EBIT and NPBT excludes non-recurring costs incurred during 1H17 regarding the finalisation of the one-off litigation matter ($3.0m)
            included within ‘Other Expenses’ in the statutory accounts.

                                                                                                                                                            4
2        Premier Investments summarised consolidated income statement

                                                         26 Weeks to   27 Weeks to

$m                                                       28 Jan 2017   30 Jan 2016
Premier revenue (ex Premier Retail)                             13.2          12.8
Premier expenses (ex Premier Retail)                           (3.0)         (2.7)
Premier Retail EBIT – underlying (26 weeks)                     93.0          84.1
Finance costs                                                  (2.6)         (2.5)

Underlying net profit before tax (26 weeks)                    100.6          91.7

Premier Retail EBIT – non comparable 27th week in 1H16             -           6.6
Non-recurring costs (before tax)
    ‒ One-off litigation matter                                (3.0)             -
Reported net profit before tax                                  97.6          98.3
Income tax expense                                            (25.7)        (26.8)
Reported net profit after tax                                   71.9          71.5

                                                                                     5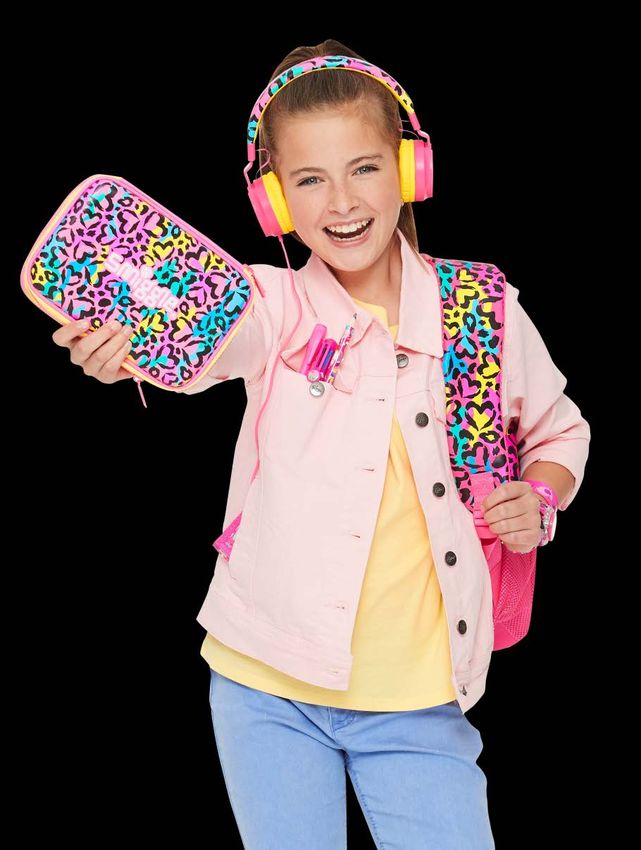
2     Premier Investments summarised consolidated balance sheet

    $m                                                 28 Jan 2017   30 Jul 2016
    Assets
    Cash and cash equivalents                               279.2         283.2
    Inventories                                             126.9         123.6
    Property, plant and equipment                           206.4         139.2
    Other assets                                             53.0          48.7
    Investment in associates                                218.4         213.4
    Intangible assets                                       854.9         854.8
    Total assets                                          1,738.8       1,662.9
    Liabilities
    Interest bearing loans and borrowings                   135.4         105.8
    Trade payables, provisions and other liabilities        228.4         218.5
    Total liabilities                                       363.8         324.3
    Equity
    Contributed equity                                      608.6         608.6
    Reserves                                                  1.5          (2.4)
    Retained earnings                                       764.9         732.4
    Total equity                                          1,375.0       1,338.6

                                                                                   6
7

3            Premier Retail delivers record sales and EBIT
•    Underlying EBIT up 10.6% to $93.0 million1,2
•    Underlying EBIT margin up 50 bps to 15.8%1,2
•    Underlying profit before tax up 10.8% to $90.9 million1,2
•    Total sales increase of 7.1% on 1H161
•    All key growth initiatives delivering
     – Smiggle global sales up 26.4%1;
             – 26 new stores opened in the UK in 1H17
             – 7 new stores opened across Asia in 1H17
             – A total of 63 new Smiggle stores opened in the last 12 months, more than one per week around the globe
     – Peter Alexander delivered a 13.8%1 lift in sales through very solid LFL growth and the opening of 3 new stores during 1H17
     – Online sales up 48.0%1, well ahead of the market growth and very profitable, with EBIT margin significantly higher than the group
          average

•    1H17 LFL sales up 2.1%1 on a constant currency basis, on top of record 1H16 LFL growth
•    Record 1H17 sales and EBIT were delivered notwithstanding significant external headwinds:
         •   Unseasonably cold October weather in Australia impacting full price sales of summer apparel products
         •   Temporary store closures resulting from November Earthquake in New Zealand, Hobart Cat & Fiddle building collapse and
             major redevelopment of Chadstone Shopping Centre in Q1
•    Investment in Flagship stores for all 7 brands at Chadstone in 1H17 delivering positive results from re-opening dates in Q2
•    Targeted capital investment program continues, with 183 capital investment initiatives across all brands and markets during 1H17,
     including 37 new stores
Note:
1.   Group result in 1H16 excludes non-comparable 27th week which contributed $15.2m in sales and $6.6m in EBIT. 1H17 Sales and LFL growth percentage is reported
     on comparable 26 weeks of 1H16.
2.   Underlying EBIT and NPBT excludes non-recurring costs incurred during 1H17 regarding the finalisation of the one-off litigation matter ($3.0m) included within ‘Other
     Expenses’ in the statutory accounts.

                                                                                                                                                                             8
3         Premier Retail performance
                                                                                  26 Weeks             26 Weeks                                       27 Weeks
$000                                                                         to 28 Jan 2017      to 30 Jan 20162         Var LY                  to 30 Jan 2016
Sales                                                                                588,613              549,800         +7.1%                            564,951
LFL sales (constant currency)2                                                        +2.1%                +6.3%                                            +6.3%
Gross Profit                                                                         376,863              356,033        +5.9%                             366,020
Gross margin (%)                                                                      64.0%                64.8%        -73 bps                              64.8%
Employee    Expenses1                                                              (141,151)            (134,446)        +5.0%                            (137,255)
% sales                                                                               24.0%                24.5%        -47 bps                              24.3%
Rent1                                                                              (108,321)            (103,450)        +4.7%                            (103,450)
% sales                                                                               18.4%                18.8%        -41 bps                              18.3%
Advertising & Direct Marketing1                                                      (7,535)              (6,662)       +13.1%                              (6,662)
% sales                                                                                1.3%                 1.2%         +7 bps                               1.2%
Depreciation, Amortisation & Impairment1                                            (12,767)             (12,126)        +5.3%                             (12,126)
% sales                                                                                2.2%                 2.2%         -4 bps                               2.1%
Other Costs of Doing Business1                                                      (15,381)             (16,001)         -3.9%                            (16,582)
% sales                                                                                2.6%                 2.9%        -30 bps                               2.9%
Other income                                                                           1,309                  794                                              794
Underlying EBIT                                                                       93,017               84,143       +10.6%                              90,739
% sales                                                                                15.8%                15.3%       +50 bps                             16.1%
Borrowing costs                                                                       (2,072)              (2,090)                                          (2,090)
Underlying Profit before tax                                                          90,945               82,053        +10.8%                             88,649

Note:
1. Total cost of doing business equates to 48.4% of sales (1H162 49.6%) excludes non-recurring costs incurred during 1H17 regarding the finalisation of
    the one-off litigation matter ($3.0m) included within ‘Other Expenses’ in the statutory accounts
2. Group result in 1H16 excludes non-comparable 27th week which contributed $15.2m in sales and $6.6m in EBIT. 1H17 Sales and LFL growth
    percentage is reported on comparable 26 weeks of 1H16.

                                                                                                                                                                      9
4 1H17 trading overview – external events
Record 1H17 Sales and EBIT were delivered notwithstanding significant external headwinds:
1. Unseasonably cold October Weather in Ave Daily Maximum Temperatures
Australia
30.0
• 1H17 October weather was unseasonably
cold, on average as much as 6 degrees 26.3
colder than 1H16 in the southern capital
25.0
cities
• As a result, Australian LFL store sales in the
apparel brands dropped significantly to 20.0
negative 4.5% for the month of October (and 20.4
negative 7.2% in the southern capital cities)
• Late start to warmer weather directly led to 15.0
gross margin decline as all clothing brands AUG SEP OCT NOV DEC
were forced to compete on price with all AUS Southern Capital Cities 1H17 AUS Southern Capital Cities 1H16
retailers to clear summer inventory across
the critical Christmas quarter
• As a result of the action taken to compete in
Q2, the group has ended 1H17 with a clean
inventory position
104 1H17 trading overview – external events (continued)
2. Earthquake in New Zealand
(14 November 2016)
• 26 of 44 Premier Retail stores in the earthquake
impacted area of New Zealand faced temporary
closures of up to 12 days.
• Lower Hutt, Wellington (Top 5 Shopping Centre in
New Zealand) was the most significantly
impacted, with the centre still only partially re-
opened for trade as at March 2017, nearly 4
months after the earthquake. All 7 Premier Retail
brands were impacted by temporary closures, and
both Peter Alexander and Jay Jays remain closed
pending shopping centre clearance to re-open,
having missed significant sales through the
Christmas and January trading period.
• Consumer sentiment across all of New Zealand
Wellington CBD post-earthquake November 2016
was significantly impacted by the earthquake,
resulting in a negative step-change in trading
momentum felt across all 169 New Zealand stores
for the critical Christmas trading period.
114 1H17 trading overview – external events (continued)
3. Hobart Cat & Fiddle building collapse (27 July 2016)
• 4 Premier Retail brands faced temporary store closures
• Just Jeans lost one month’s trade re-opening on 29 August
2016
• Dotti lost over five months trade re-opening on 5 January
2017, and missed critical Christmas trading period
• Portmans and Jacqui E faced significant structural damage Portmans,
and remain closed as at March 2017 as structural repairs to Dotti and
the centre continue Jacqui E
stores
4. Chadstone Redevelopment (Q1 1H17)
• All 7 Premier Retail brands faced temporary closures and
were significantly disrupted in Q1 during the major
redevelopment at Chadstone Shopping Centre
• Since re-opening in Q2, the investment in 1H17 in Flagship
stores for all 7 brands at Chadstone in the prime new
shopping precinct is delivering exceptional results, well
above the same period last year in the old locations
125 Premier Retail 1H17 EBIT: strong growth continues
• EBIT % to Sales up 50 bps
• 5 consecutive years of first half EBIT growth in the critical summer season
• Key Gross Margin and CODB strategies delivering
Underlying EBIT – 5 Year History
15.8%
16%
15.3%
$100
$93.0 15%
$90 14.3%
$84.1
14%
$80
13.1%
12.7% $70.0 13%
$70
$61.5
$60 $56.3 12%
$50 11%
1H13 1H14 1H15 1H16 1H17
(note 1)
Underlying EBIT $'M EBIT % to Sales
Note:
1. Group result in 1H16 excludes non-comparable 27th week which contributed $15.2m in sales and $6.6m in EBIT
135 Premier Retail 1H17 EBIT: strong growth continues
Gross Margin Strategies continue to deliver
• Key long term foreign currency hedging policies allowing for merchandise planning
• Direct sourcing initiatives continued to deliver benefits from new and existing suppliers
• Sourcing from new geographies continues
• Investing in better merchants, delivering better product
• Ongoing focus on disciplined execution of markdown management
• Significant growth from higher margin brands Smiggle and Peter Alexander
• Premier Retail is fully hedged for all Australian, New Zealand and UK offshore purchases for the balance of
FY17 and 1H18
CODB Focus continues to deliver
• CODB decreased by 115 bps as a percentage of sales to 48.4% in 1H171
• Costs continue to be well controlled despite structural inflationary pressure. Investment will continue in
strategic growth initiatives, including Smiggle’s international growth markets (UK, Hong Kong, Malaysia), Online
and Peter Alexander
• 4 stores closed during 1H17, as part of the ongoing program to close unprofitable stores
Note:
1. Refer page 9 for CODB details
146 Premier Retail investing
• Investment in rapid growth of Smiggle continues in Capital investment
international markets
25.0 23.0
• Investment continues in Peter Alexander new stores, 20.0
refurbishments, refits, upsizing and back-of-house 20.0 17.5
• Significant investment continues in all online platforms 15.0 12.7
including the rapid international and local expansion of 10.0 7.2
our online capability
5.0
• Targeted store upgrades and refurbishments continue
-
in core brand network, including significant investment
1H13 1H14 1H15 1H16 1H17
in Chadstone Flagship stores in 1H17
Capital Investment (AUD$million)
• The group will continue to invest to underpin future
Note:
growth Capital invested reflects the total of the group spend including any landlord
contributions.
156 Premier Retail investing in growth
Premier Retail continues to invest in new stores, upgrades
and refurbishments to deliver sustainable sales growth:
183 stores received capital investment, including 37 new
stores in 1H17
• 26 new stores opened in the United Kingdom
• 4 new stores opened in Malaysia
• 2 new stores opened in Hong Kong
• 1 new store opened in Singapore
Smiggle Liverpool (UK) - Opened November 2016
• 1 full store refit in Australia – Chadstone Flagship
• 1 store refurbished in existing location in Australia
• 4 stores received POS and VM fixture upgrades
• 3 new stores opened in Australia
• 4 stores were upsized and refurbished in Australia, Chadstone Image
including Chadstone Flagship to be inserted
• 83 stores received VM fixture upgrades across Australia
and New Zealand
• 34 stores received store fixture upgrades across Australia
and New Zealand
Peter Alexander Noosa - Opened November 2016
166 Premier Retail investing in growth
• 2 stores relocated and refurbished in Australia, including
Chadstone Flagship
• 3 stores refurbished in existing locations in Australia Chadstone Image
to be inserted
• 2 stores relocated and refurbished in Australia, including
Chadstone Flagship
• 3 stores refurbished in existing locations across Australia and
New Zealand
• 2 stores relocated and refurbished in Australia, including
Chadstone Flagship Portmans Chadstone – Opened October 2016
• 3 stores refurbished in existing locations across Australia and
New Zealand
• 1 new store opened in Australia
• 2 stores relocated and refurbished in Australia, including
Chadstone Flagship
• 1 stores refurbished in existing location in Australia
• 1 store relocated and refurbished in Australia -
Chadstone Flagship
Jay Jays Chadstone – Opened October 2016
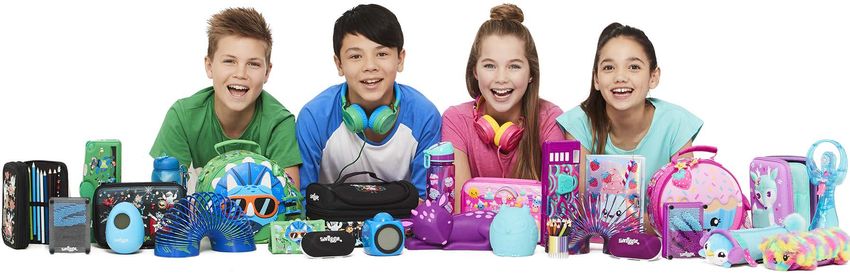
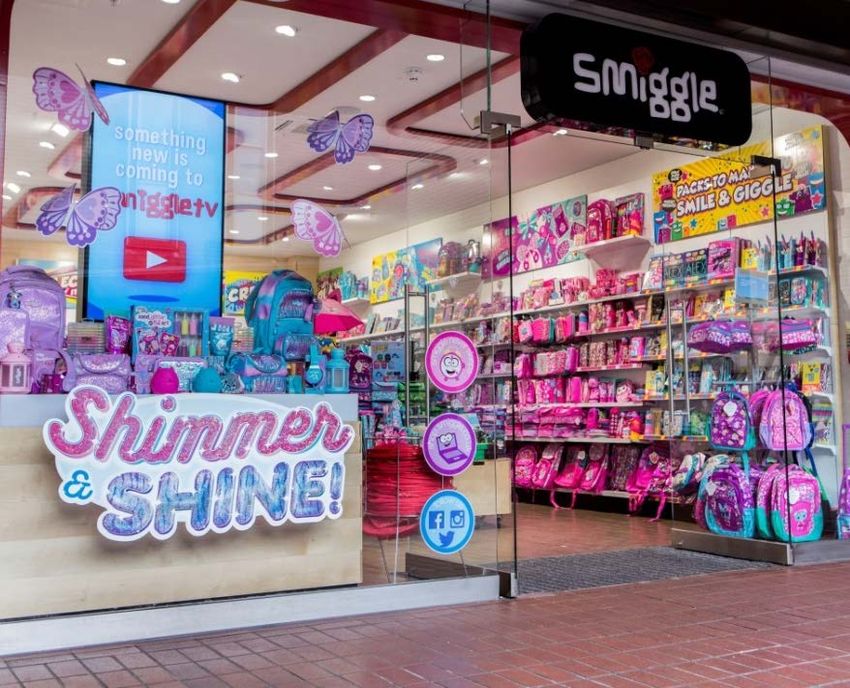
177 Smiggle: global expansion driving growth
• 1H17 sales of $134.7m, up 26.4% (total sales up 81% over 2 years)1
• Another record season for the brand underpinned by strong global LFL growth
• Sales have more than doubled in under 3 years
• Nearly 60% of total global revenue was generated outside Australia in 1H17
• 33 new stores opened in 1H17 across 4 markets (vs 22 stores opened 1H16)
$135
140 Smiggle Sales and Store Growth 350
Number of Stores at half-year-end
120 $107 300
100 250
Sales AUD $m
$74
80 200
$63
$54
60 $48 150
$41 272
$34 209
40 100
157 177
$17 147
20 $11 98 119 50
80
31 52
- -
1H08 1H09 1H10 1H11 1H12 1H13 1H14 1H15 1H16 1H17
No. of Stores at half-year-end Sales
Notes:
1. 1H16 excludes non-comparable 27th week of sales. 1H17 Sales growth percentage is reported on comparable 26 weeks of 1H16
187 Smiggle: Australia and New Zealand
• Another strong performance in 1H17
• Exceptional growth in online sales
• Significant growth in gifting categories - Smiggle is now a
key Christmas shopping destination
• Growth also continues in key back-to-school product
categories
• Smiggle continues to delight fans with ever more
innovative product and ranges
• A major focus on targeted store relocations and
refurbishments in key flagship destinations such as
Chadstone, Highpoint & Werribee has been highly
successful, with all performing exceptionally
• 2H17 has started very strongly
197 Smiggle: UK remains on track to deliver annual sales of $200m by 2019
• 90 stores trading in the UK prior to the key Christmas period,
at the top end of previous guidance
• Strong LFL sales growth in 1H17
• 26 new stores opened during 1H17, including the key
locations of London Kings Road, Liverpool One and
Edinburgh Princes Street (Scotland)
• 48 stores opened in the past 12 months
• Investment in the UK transactional website continues to
deliver with significant momentum
• Smiggle UK awarded the prestigious Retailer of the Year 2016
(British Council of Shopping Centres) and Fastest Growing
Shopping Centre Retailer for 2016 (Retail Week)
• Brand contagion continues to spread across the country via
both stores and online as Smiggle continues to delight and Enfield Palace Gardens
embrace new and existing fans opened December 2016
• Continued investment in people, technology infrastructure and
marketing driving sales in both bricks & mortar and online
channels
• Smiggle UK remains on track to open a further 30-40 stores in
calendar year 2017
207 Smiggle: Asia
Singapore
• Business in Singapore remains buoyant with strong demand from both locals and regional
tourists
• Reopened 1 store, Compass One, in 1H17 following the full centre redevelopment in 2015-16
• One new store at Jurong Point to open in March 2017 due to the high demand in this centre
from Smiggle fans
• The opportunity exists for a further 2-3 store openings across FY18 and FY19 in Singapore
Hong Kong
• Successfully launched Smiggle into the market in May 2016
• Now trading from 6 stores having opened a further 2 stores in 1H17
• The brand has been well received by locals and tourists, including mainland Chinese, with
very encouraging sales results and strong momentum building
• 3 confirmed sites to open in 2H17, including first store on Hong Kong Island, the Flagship
Times Square Mall situated in Causeway Bay. Advanced negotiations on a further 2 sites are
underway
• Strong operational team in Hong Kong now established and performing well
• 9-10 stores to be trading by end 2H17, and reaffirm potential for 25-35 stores over the next
five years in Hong Kong
217 Smiggle: Asia
Malaysia
• Successfully launched Smiggle into the market in April 2016
• Now trading from 5 stores having opened 4 stores in 1H17
• The brand has been well received by locals and tourists, with
very encouraging sales results and strong momentum building
• 6 stores confirmed to open in 2H17 for a total of 11 stores by end
FY17, ahead of previous guidance of 8-10
• First store outside of Kuala Lumpur opened in Penang in
December 2016 with encouraging results to date
• Strong operational team in market, capably managed and lead
by the Smiggle Singapore team
• 11 stores to be trading by end 2H17, and reaffirm potential for
15-25 stores over the next five years in Malaysia
227 Smiggle to enter the Eurozone
• New market to open in 2H17, Republic of Ireland, our first Eurozone country
• Comprehensive deep dive and in market due diligence has been completed,
identifying substantial synergies with the existing UK business
• The market has potential for 15-20 stores within 3 years
Why the Republic of Ireland?
• Personal stationery market of US$360m
• The brand’s presence in the UK with a highly successful online business has given valuable insight into interest from other
European countries, and the Republic of Ireland has been the #1 market outside of the UK for online orders
• Exciting opportunity exists to grow into a new market whilst leveraging the high calibre people management and
infrastructure already in place in the UK, as the brand has successfully done in Asia rapidly growing Malaysia with direct
support from Singapore. This is a highly profitable strategy
• Landlords know the brand proposition and are enthusiastic to facilitate this growth strategy
• An entry into the brand’s first Eurozone market will provide important insight for further European expansion plans
• Two sites have already been signed off to open in 2H17 and advanced discussions taking place on a further 2-3 sites for
opening prior to Christmas
• Key in-market management role has been recruited well ahead of opening the first store to ensure an immediately
successful launch into this exciting new market
*source: Conlumino report, Nov 2015, Stationery & Cards Retailing in Ireland, Actual 2014
238 Peter Alexander performing strongly
• Sales up 13.8% with strong total and LFL sales in both
Australia and New Zealand1
• Excellent results from Christmas trading period continuing to
cement brand as a key gifting destination
• 3 new stores opened: Greenwood Plaza, Macarthur Square
and Noosa all trading ahead of expectations
• Chadstone, Pacific Fair, Spencer Street and Warringah stores
relocated and refurbished to a larger format store with
significantly more revenue
• Success of Brisbane airport store heralds opportunities in more
airport locations
• Strong performance from Myer concessions with significant
growth from improved customer awareness of brand
• Online continues to be a key driver of growth
• Investment in key product categories and continued trial of new
categories providing strong results for the brand – e.g. Plus
Size
Notes:
1. 1H17 Sales growth percentage is reported on comparable 26 weeks of 1H16
248 Peter Alexander future growth
The brand sees future growth opportunities including:
• 3 new stores confirmed in 2H17: Woden, Watergardens and
Hurstville
• 1 store confirmed to be refurbished and upsized in 2H17:
Chermside
• 5-7 new stores per year in calendar years 2017, 2018 and
2019
• 3-5 store upgrades, upsizing or refurbishments per year in
calendar years 2017, 2018 and 2019
• Online investment and growth to continue
• Innovation with new product categories continues – growth in
Plus Size, Footwear and climatic ranging a focus for 2017
• 30th Anniversary major celebration and focus for 2017,
commencing Mar-17
259 Online – delivering a world class platform
• Investment continues in technology, people and Online sales growth ahead of market
new marketing initiatives to deliver both:
– a world class platform
– annual online sales of $100m by 2020
• Online sales up 48.0% in 1H171 – well ahead of
market growth of 7.1%2 for the 12 months ended
January 2017
• Online channel continues to deliver significantly
higher EBIT margin than the Group average
• Strong performance continues from international
sites:
1
– Smiggle.co.uk for UK/Europe customers,
fulfilled from UK
– PeterAlexander.co.nz and Dotti.co.nz for New
Zealand customers, fulfilled from NZ
• Australian sites continuing to deliver strong
growth with all brands outperforming the market
Note:
1. 1H15, 1H16 and 1H17 Sales growth percentages are reported on comparable 26 week periods
2. NAB Online Retail Sales Index – January 2017, published 3 March 2017, reported Australian online retail sales in the fashion category grew by 7.1% in
the 12 months to January 2017
2610 Premier Retail summary 1H17
Smiggle achieves significant growth
• 33 new stores opened in 1H17 across 4 countries - more than one new Smiggle store opened around the globe per
week
• Another record half for Smiggle in sales, with sales up 26.4% (total sales up 81% over 2 years)1
• Nearly 60% of total global revenue generated outside Australia in 1H17 - the international expansion of the
business is delivering significant returns
• The company reaffirms the UK expansion plans to generate annual sales of $200m by 2019
• Asian expansion successfully executed with 11 stores now trading across Hong Kong and Malaysia on top of the
19 in Singapore, a further 9-11 to open across the region in 2H17, totalling 39-41 by end FY17
• The company reaffirms the Hong Kong and Malaysian expansion plans to have 50 stores within 5 years
• Entry into our first Eurozone country, the Republic of Ireland, to open in May 2017 with 2 stores confirmed for 2H17
and a pipeline already established that will deliver 15-20 stores within 3 years
• Smiggle plans to open a further 50-60 stores during calendar year 2017 across Asia and Europe
• Advanced investigations are continuing in potential new high value countries of size and scale with an update to
market in due course
• John Cheston (Managing Director: Smiggle) continues to lead a strong and focused management team growing a
truly unique global brand
Notes:
1. 1H17 Sales growth percentage is reported on comparable 26 weeks of 1H16
2710 Premier Retail summary 1H17
Peter Alexander performing strongly
• Peter Alexander sales up 13.8% with strong total and LFL sales growth in Australia and New Zealand1
• New store roll out program in Australia and New Zealand delivering profitable growth
• Key investments continue in marketing and online to sustain growth
• Targeting 5-7 new stores per calendar year 2017 to 2019; 3 new stores confirmed in 2H17
• Targeting 3-5 store upgrades, upsizing or refurbishments per calendar year 2017 to 2019 to improve LFL growth; 1
refurbishment confirmed in 2H17
• Strong and focused management team led by Judy Coomber (Managing Director: Peter Alexander) and Peter
Alexander (Creative Director: Peter Alexander)
Online strategy delivering
• Investment continuing in technology, people and marketing to deliver both a world class platform and annual Online
sales of $100m by 2020
• Strong sales growth of 48.0%, well ahead of market growth at 7.1%1,2
• Significant investment continues in technology, people and marketing to maximise growth
• Multi channel initiatives delivering incremental sales and EBIT
• Online channel extremely profitable with EBIT margin well above group average
• Strong and focused management team led by Georgia Chewing (Group General Manager: Internet and Marketing)
continuing to grow the business.
Note:
1. 1H17 Sales growth percentage is reported on comparable 26 weeks of 1H16
2. NAB Online Retail Sales Index – January 2017, published 3 March 2017, reported Australian online retail sales in the fashion category grew by 7.1% in
the 12 months to January 2017
2829
11          Ordinary Interim Dividend

•   The Premier Board has declared an increased interim dividend fully franked of 26 cps, up 13.0% (1H16: ordinary 23 cps)
•   The Board’s decision to pay ordinary dividends is always shaped by:
     –   Assessment of the result
     –   Outlook for the market
     –   Confidence in the operational performance of Premier’s people, brands and processes
     –   Maintaining cash reserves for growth opportunities
•   The Board will continue to consider capital management initiatives in the future

                                                                                                                             30
31
12
Highlights
•   Record half with sales growth of 26.4%1 (total sales up 81% over 2 years) to $134.7m
•   Record season underpinned by strong global LFL growth
•   33 stores opened across UK and Asia with more than 50% of stores outside of Australia
    for the first time
•   Online success in both Australia and UK is ahead of expectations and through ongoing
    targeted investment will become a significant driver of revenue and profit
•   Smiggle reaffirms UK expansion plan to have annual sales of $200m by 2019
•   Smiggle reaffirms Hong Kong and Malaysian expansion plan to have 50 stores trading
    within 5 years

    Overview of Results
    Sales                 $134.7m
    Var LY                +26.4%1
    Store movements       Jul 16     Open      Close2     Jan 17

    Australia              129         -          -        129
    New Zealand             23         -          -         23
    Singapore               18         1          -         19
    UK                      64        26          -         90
    Malaysia                1          4          -         5
                                                                         Notes:
    Hong Kong               4          2          -         6            1. 1H17 Sales growth percentage is reported on comparable 26 weeks of 1H16
                                                                         2. Store movements table reflects permanent store closures only, and does not
                           239        33          -        272               include temporary store closures impacting trading results during 1H17

                                                                                                                                                         32
12
Highlights
• Sales growth of 13.8%1 to $99.4m
• Strong LFL sales growth in both Australia and New Zealand
• 1H17 Sales were negatively impacted by one-off temporary store closures including the
relocation at Chadstone and earthquake impacted Lower Hutt (NZ)
• Online continues to be a driver for growth in both markets
• Strong gross margins maintained
• Concession stores continue to deliver growth
• Continued growth in ‘plus size’ range and womens footwear
• All new stores delivering, with 3 new stores confirmed in 2H17
• Targeting 5-7 new stores and 3-5 store upgrades, upsizing or refurbishments per
calendars years 2017 to 2019
Overview of Results
Sales $99.4m
Var LY +13.8%1
Store movements Jul 16 Open Close2 Jan 17
Australia 74 3 - 77
New Zealand 15 - 1 14
Notes:
Myer Concession 10 - - 10 1. 1H17 Sales growth percentage is reported on comparable 26 weeks of 1H16
2. Store movements table reflects permanent store closures only, and does not include
99 3 1 101 temporary store closures impacting trading results during 1H17
3312
Highlights
• Strong sales growth of 4.7%1 in a highly competitive market
• Investment in flagship store at Chadstone which opened in October-16 delivering
positive results
• 1H17 Sales were negatively impacted by one-off temporary store closures including the
relocation at Chadstone, earthquake impacted Lower Hutt (NZ) and building collapse at
Cat & Fiddle (Hobart).
• Investment in new retail store format continues to deliver positive results
• Differentiation through the international branded denim business where investment in
width of range, instock of sizes and personal service continues to deliver a great
competitive advantage
• Investment in Ashley Hart & Stenmark twins as brand ambassadors continues
• Clean inventory position at the end of 1H17
Overview of Results
Sales $114.3m
Var LY +4.7%1
Store movements Jul 16 Open Close2 Jan 17
Australia 200 - - 200
Notes:
New Zealand 45 - 1 44 1. 1H17 Sales growth percentage is reported on comparable 26 weeks of 1H16
2. Store movements table reflects permanent store closures only, and does not include
245 - 1 244 temporary store closures impacting trading results during 1H17
3412
Highlights
• Investment in flagship store at Chadstone which opened in October-16 delivering positive
results
• New store format continuing to perform well, delivering improved profitability and customer
experience
• 1H17 Sales were negatively impacted by one-off temporary store closures including the
relocation at Chadstone and earthquake impacted Lower Hutt (NZ)
• 1H17 LFL Sales adjusted for these one-off events were stronger than total sales growth
• After a challenging Q1 with the unseasonably cold October weather, Q2 delivered a shift in
momentum with LFL Sales up 3.0%, leaving a clean inventory position at the end of 1H17.
The positive sales momentum has since strengthened further, with LFL sales up 3.3% for
the first 6 weeks of 2H17
Overview of Results
Sales $88.0m
Var LY -1.2%1
Store movements Jul 16 Open Close2 Jan 17
Australia 176 - 1 175
New Zealand 35 - 1 34
211 - 2 209
Notes:
1. 1H17 Sales growth percentage is reported on comparable 26 weeks of 1H16
2. Store movements table reflects permanent store closures only, and does not include temporary store closures impacting trading results during 1H17
3512
Highlights
• Dotti delivered positive sales growth of 0.5%1 in 1H17, after excluding the negative
impact of one-off temporary store closures including the relocation at Chadstone,
earthquake impacted Lower Hutt (NZ) and building collapse at Cat & Fiddle (Hobart)
• Investment in flagship store at Chadstone which opened in October-16 delivering
positive results
• Strong Online sales growth continues, with high customer engagement driving
database growth of 20.7% during 1H17
• Successful implementation of new direct sourcing channel continues to enhance
margin
• Focus on disciplined execution of markdown management in a highly competitive
market leaving a clean inventory position at end of 1H17
Overview of Results
Sales $57.6m
Var LY -0.4%1
Store movements Jul 16 Open Close2 Jan 17
Australia 95 1 - 96
New Zealand 21 - - 21
116 1 - 117
Notes:
1. 1H17 Sales growth percentage is reported on comparable 26 weeks of 1H16
2. Store movements table reflects permanent store closures only, and does not include temporary store closures impacting trading results during 1H17
3612
Highlights
• Jacqui E delivered a sales decline of 2.5%1 in 1H17, after excluding the negative impact
of one-off temporary store closures including the relocation at Chadstone, earthquake
impacted Lower Hutt (NZ) and building collapse at Cat & Fiddle (Hobart)
• Investment in flagship store at Chadstone which opened in November-16 is delivering
positive results
• Focus on disciplined execution of markdown management in a highly competitive
market leaving a clean inventory position at end of 1H17
• Nicole Naccarella appointed as the new Group General Manager of Jacqui E and will
join the business in June 2017. Nicole has deep Womenswear product development
experience which will be of significant benefit to Jacqui E in a highly competitive market
Overview of Results
Sales $35.7m
Var LY -4.1%1
Store movements Jul 16 Open Close2 Jan 17
Australia 77 - - 77
New Zealand 20 - - 20
97 - - 97
Notes:
1. 1H17 Sales growth percentage is reported on comparable 26 weeks of 1H16
2. Store movements table reflects permanent store closures only, and does not include temporary store closures impacting trading results during 1H17
3712
Highlights
• After delivering exceptionally strong 15.3% growth in 1H16, sales in 1H17 were down
5.8%1 in a challenging half
• 1H17 Sales were negatively impacted by one-off temporary store closures including the
relocation at Chadstone, earthquake impacted Lower Hutt (NZ) and building collapse at
Cat & Fiddle (Hobart)
• Georgia Fowler announced as the new brand ambassador
• Focus on disciplined execution of markdown management in a highly competitive market
leaving a clean inventory position at end of 1H17
• Portmans leadership team has been completely revitalised and renewed
– Linda Levy appointed as the new Group General Manager of Portmans effective April
2017
– Vicky Kordatou and Joanne Simmonds both recently appointed to key Merchandise
Manager roles
Overview of Results
Sales $58.9m
Var LY -5.8%1
Store movements Jul 16 Open Close2 Jan 17
Australia 91 - - 91
Notes:
New Zealand 13 - - 13 1. 1H17 Sales growth percentage is reported on comparable 26 weeks of 1H16
2. Store movements table reflects permanent store closures only, and does not include
104 - - 104 temporary store closures impacting trading results during 1H17
38A Appendix
Overview of Premier’s non–IFRS financial information
• IFRS financial information is financial information that is presented in accordance with all relevant accounting standards.
• Non-IFRS financial information is financial information that is presented other than in accordance with all relevant
accounting standards. EBIT, underlying, 27th week, like for like sales, cash generated, one-off, non-recurring
• Any non-IFRS financial information is clearly labelled to differentiate it from reported/IFRS financial information.
• Premier provides reconciliations on the face of the slides and in the footnotes of the presentation in order to allow the
reader of the presentations to clearly reconcile between the IFRS and non-IFRS financial information.
• Premier management believes that the presentation of additional non-IFRS information in its results presentations
provides readers of these documents with a greater understanding into the way in which management analyses the
business as well as meaningful insights into the financial condition or Premier’s overall performance.
• The Australian Securities and Investments Commission (ASIC) acknowledges the relevance of non-IFRS financial
information in providing “meaningful insight” as long as it does not mislead the reader.
39You can also read