4th QUARTER 2020 - HFG Trust
←
→
Page content transcription
If your browser does not render page correctly, please read the page content below

4th QUARTER 2020

Equities continued to rally in the fourth quarter, resulting in
positive returns for the year.
US Small stock were the strongest equity performer QTD,
with the overall US market slightly trailing international.
Value companies outperformed QTD, while lagging in 2020 returns
overall.
The Federal Reserve reinforced their plan to fully support this
economy by keeping rates near zero.

Quarterly Market Review                                                                                                    2

Fourth Quarter 2020

                    Marked by a number of historically unprecedented events,
                                                                                      ▪ Overview:
                    the year 2020 proved to be one of the most tumultuous in
                    modern history. But the year also demonstrated the resilience
                                                                                          2020 in Review
                    of people, institutions, and financial markets.

                    The novel coronavirus was already in the news early in the            Fixed Income Summary
                    year, and concern grew as more countries began reporting
   Kevin Floyd      their first cases of COVID-19. Infections multiplied around the       Equities Summary
 CFA, CFP®, AIF®
    Director of     world through February, and by early March when the
   Investments      outbreak was labeled a pandemic, it was clear that the crisis         Diversification
would affect nearly every area of our lives. Governments and central banks
worked to cushion the blow by providing financial support for individuals and
                                                                                          Looking Ahead: 2021
businesses and adjusting lending rates.
                                                                                          Portfolio Update
For investors, the year was characterized by sharp swings for stocks. As the
pandemic worsened, March saw a -33.79% drop in the S&P 500 Index1 followed                Investment Update
by a rally in April, with stocks returning to their previous highs by August.
Ultimately, despite a sequence of epic events and continued concerns over the             Global Valuations
pandemic, global stock market returns in 2020 were above their historical norm.
The US market finished the year in record territory and with an 18.40% annual             Quarterly Asset Class Market Summary
return for the S&P 500 Index. Non-US developed markets, as measured by the
MSCI World ex USA Index,2 returned 7.59%. Emerging markets, as measured by                World Asset Classes
the MSCI Emerging Markets Index, returned 18.31% for the year.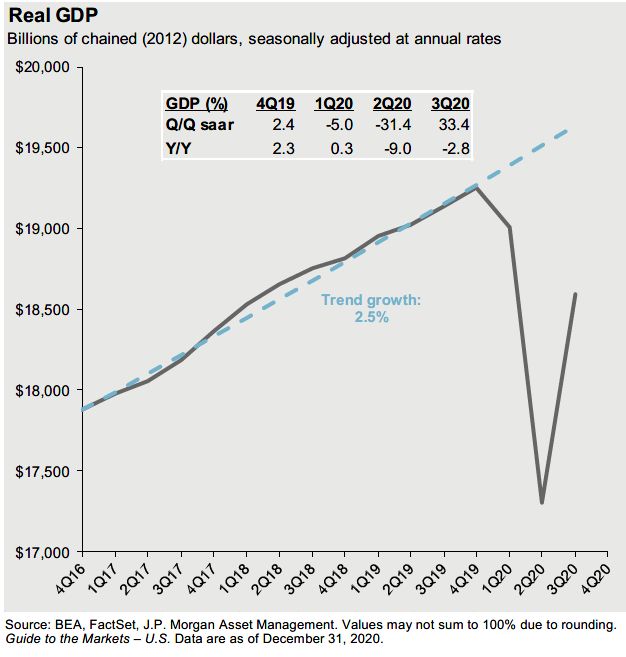
Quarterly Market Review                                                                                                                                                                                                                     3

2020 in Review
                                                                                                                                                  Exhibit 1. Highs and Lows
                                                                                                                                                  MSCI All Country World Index with selected headlines from 2020

Past performance is no guarantee of future results.
In US dollars, net dividends. MSCI data © MSCI 2021, all rights reserved. Indices are not available for direct investment. Index returns are not representative of actual portfolios and do not reflect costs and fees associated with an
actual investment.
 1. S&P data © 2021 S&P Dow Jones Indices LLC, a division of S&P Global. All rights reserved. Indices are not available for direct
    investment.
 2. MSCI data © MSCI 2021, all rights reserved. Indices are not available for direct investment.
Quarterly Market Review
                                                                                                                                                                                                                 4

Fixed Income Summary

Fixed income markets mirrored the extreme nature of equity behavior, with nearly unprecedented dispersion in returns during the first half of 2020.
For example, in the first quarter, US corporate bonds underperformed US Treasuries by more than 11%, marking the largest negative difference
between US corporates and US treasuries going back a half century. In the second quarter, they swapped places as US corporates recovered
quickly with a 7.74% advantage over US treasuries.3 Large return deviations were also observed between US and non-US fixed income, as well as
between inflation-protected and nominal bonds.

Global yield curves finished the year lower than they started. US Treasury yields fell across the board, with drops of more than -1% on the short
and intermediate portions of the curve.4 The US Treasury curve ended relatively flat in the short-term segment but sloped upward from the
intermediate- to long-term segment. For 2020, the Bloomberg Barclays Global Aggregate Bond Index returned 5.58%.5

Uncertainty surrounding the pandemic and the broad impact of new vaccines, continued lockdowns, and social distancing remains. But the events
of 2020 provided investors with many lessons, affirming the long-held principle that following a disciplined and broadly diversified investment
approach is a reliable way to pursue long-term investment goals.

Market Prices Quickly Reflect New Information
Fluctuations in the spring and summer were also a lesson in how markets incorporate new information and investor expectations. From its peak
on February 19, 2020, the S&P 500 Index fell -33.79% in less than five weeks as news headlines suggested more extreme outcomes from the
pandemic. But the recovery was swift as well. Market participants watched for news that would provide insight into the pandemic and the
economy, such as daily infection and mortality rates, effective therapeutic treatments, and the potential for vaccine development. As more
information became available, the S&P 500 Index jumped 17.57% from its March 23 low in just three trading sessions, one of the fastest
snapbacks on record. This period highlighted the vital role of data in setting market expectations and underscored just how quickly prices adjust
to new information.

3.   US corporate bonds represented by the Bloomberg Barclays US Credit Bond Index. US Treasuries represented by the Bloomberg Barclays US Treasury Bond Index. Bloomberg Barclays data provided by Bloomberg.
     Indices are not available for direct investment.
4.   ICE BofA government yield. ICE BofA index data © 2021 ICE Data Indices, LLC.
5.   Bloomberg Barclays data provided by Bloomberg. All rights reserved. Indices are not available for direct investment.                                                                                            4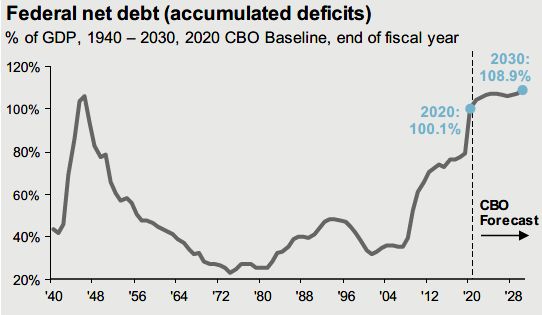
Quarterly Market Review                                                                                                                                                                                                                        5

 Equities Summary

 One major theme of the year was the perceived disconnect between markets and the economy. How could the equity markets recover and
 reach new highs when the economic news remained so bleak? The market’s behavior suggested that investors were looking past the short-
 term impact of the pandemic to assess the expected rebound of business activity and an eventual return to more normal conditions. When
 viewed through that lens, the rebound in share prices reflected a market that is always looking ahead, incorporating both current news and
 expectations of the future into stock prices.

                                                                                                                                      Exhibit 2. Sharp Shifts
                                                                                                                                      US Credit minus US Treasury: Quarterly Returns, March 1973–December 2020

 Past performance is no guarantee of future results.
 In US dollars. US credit represented by the Bloomberg Barclays US Credit Bond Index. US Treasuries represented by the Bloomberg Barclays US Treasury Bond Index. Bloomberg Barclays data provided by
 Bloomberg. Indices are not available for direct investment. Index returns are not representative of actual portfolios and do not reflect costs and fees associated with an actual investment.

3.   US corporate bonds represented by the Bloomberg Barclays US Credit Bond Index. US Treasuries represented by the Bloomberg Barclays US Treasury Bond Index. Bloomberg Barclays data provided by Bloomberg. Indices are not available for
     direct investment.
4.   ICE BofA government yield. ICE BofA index data © 2021 ICE Data Indices, LLC.
5.   Bloomberg Barclays data provided by Bloomberg. All rights reserved. Indices are not available for direct investment.
                                                                                                                                                                                                                                                   5
Quarterly Market Review 6
Diversification
Owning the Winners and Losers
The 2020 economy and market also highlighted the importance of staying broadly diversified across companies and industries. The
downturn in stocks impacted some segments of the market more than others in ways that were consistent with the pandemic’s impact
on different industries. For example, with people around the world staying close to home, the airline, hospitality, and retail industries
tended to suffer disproportionately, whereas companies in communications, online shopping, and technology emerged as relative
winners throughout the crisis. However, attempts to predict exactly how this would have unfolded at the start of 2020 would have
proved challenging, even for the most informed investor.
Exhibit 3. Cash Concerns in 2020
Past performance is no guarantee of future results.
In US dollars. Global equity returns is the MSCI All Country World IMI Index (net div.). MSCI data © MSCI 2021, all rights reserved. Money market fund flows provided by Morningstar. Indices are not available for direct
investment. Index returns are not representative of actual portfolios and do not reflect costs and fees associated with an actual investment. 6Quarterly Market Review 7
Diversification cont.
In the end, the economic turmoil inflicted great hardship on some firms while creating economic and social conditions that provided
growth opportunities for other companies. In any market, there will be winners and losers—and investors who own a broad range of
companies rather than trying to pick winners and losers have been well-served throughout history.
Sticking with Your Plan
Many news reports rightly emphasized the unprecedented nature of the health crisis, the emergency financial actions that followed, and
the countless other extraordinary events that took place throughout 2020. The year saw many “firsts”—and subsequent years will surely
usher in many more. Yet, 2020’s outcomes remind us that a consistent investment approach is a reliable path regardless of the market
events we encounter. In March, spooked investors fled the stock and bond markets as money-market funds experienced net flows for the
month totaling $684 billion. Then, over the six-month period from April 1 to September 30, global equities and fixed income returned
29.54% and 3.16%, respectively, making a move to cash in March a potentially costly decision for anxious investors. This same concept
applies to chasing asset class winners year to year. History has shown that the most reliable method of generating sustainable portfolio
returns is a well-diversified allocation strategy, especially during unprecedented economic times like today.
7Quarterly Market Review 8
Looking Ahead: 2021
• With a new administration taking office, the markets appear to be excited about the potential for a more predictable government,
particularly as additional fiscal stimulus is expected. At the end of 2020, Federal debt as a percentage of GDP will hit an all-time high of
100% (Table 1).
• The Federal Reserve (Fed) is expected to maintain their accommodative policy until inflation is steadily above 2% and the unemployment
rate has returned to pre-COVID levels. At the end of November, inflation was 1.6%, moderately below the Fed’s target.
• We’ve seen strong job recovery since April, as illustrated by a sharp increase beginning in Q2 (Table 2). However, January-March are
typically lower consumer spending months. This, coupled that with prolonged COVID restrictions, could lead to a slow overall
employment recovery.
Table 2
Table 1Quarterly Market Review 9 Portfolio Update We have remained vigilant in our efforts to acquire and maintain best-in-class asset managers across the equity, fixed income, and now alternative investments space. Stocks We modestly curtailed our Value exposure in the beginning stages of the pandemic and slightly rotated into highly profitable companies. This protected some downside risk as we approached market lows. In general, we have continued to buy equities on the dips while taking gains as the market achieves all-time highs. Bonds We have made several changes to our client portfolios by adding new fixed income funds. The objective is to better manage the current interest rate environment while enhancing your investment experience based on the goals of your portfolio. We achieve this by incorporating dynamic maturity and income levels depending on your investment strategy. Alternatives Depending on your investment strategy, we’ve implemented alternative investments (reinsurance and private real estate) in an effort to better navigate the current low-yield interest rate environment and provide uncorrelated benefits within the overall portfolio. (See page 11 for a more detailed explanation on reinsurance.)
Quarterly Market Review                                                                                                                              10

Investment Update

In 2020, our Investment Committee moved to incorporate alternative investments in our core portfolios, including reinsurance:

What is reinsurance?

Reinsurance is insurance for insurance companies wherein the insurance company pays reinsurers a premium in exchange for sharing their
risk. The category of insurance we are participating in is “rare catastrophic events” such as hurricanes, floods, and earthquakes. Reinsurance
has been around since the 1800s, illustrating its long-term stability in pricing risk. Insurers and reinsurers can earn a profit margin for taking
risk away from policyholders. Now investors can step into the shoes of reinsurers and earn this risk premium.

Why is reinsurance attractive?

The asset class has provided high-yield income that is historically uncorrelated to the behavior of the stock market. As investors are aware,
stock markets can be volatile and unpredictable in the short-term. In this low-interest rate environment, finding an asset class that
compensates investors well while acting as a stabilizer for your portfolio is attractive.

How does reinsurance work?

The graphic below is a simple illustration of how reinsurance works. An insurance company like USAA decides to diversify their risk in
natural disasters, so they share this risk with the market. In this example, Swiss Re decides to share that risk with USAA in exchange for a
nice insurance premium. USAA pays an $11.5M premium to Swiss RE in exchange for $100M of losses related to US natural disasters after a
$1B deductible, all of which is covered by USAA. This would be one of many diversified bonds within in the overall portfolio.
Quarterly Market Review                                                                                                                     11
Investment Update Cont.

What is the reinsurance fund purchasing?
Interest-earning catastrophe bonds issued by tenured insurance providers. They are all coverages for natural disaster/weather events.

If an event happens, will the fund have a loss?
The reinsurance industry has approximately $600B of capital, so it takes a large event to have a material impact. When you read about big
catastrophes in the press, look for “insured losses” to get a sense of the general magnitude of the loss to the insurance and reinsurance
industries. The press often reports “economic losses,” which can be much higher than insured losses due to limitations on the properties
and risks that are qualified for coverage.

Is this correlated to the stock or bond market?
No. Correlation between reinsurance and the S&P 500 and the US Bond market is 0.04 and -0.06, respectively. Reinsurance provided
attractive benefits during the Great Recession (see below). There will be drawdowns in reinsurance, but a stock market drawdown is likely
to have minimal effect on a drawdown in the reinsurance and vise versa.
Quarterly Market Review   12
Investment Update Cont.
Quarterly Market Review                                                                                                                      13
Investment Update Cont.

What level of returns should I expect? Though not guaranteed, our internal expectations are generally 4-8%. These returns are generated
almost entirely from income. While there will be down years, the uncorrelated nature of this investment combined with its strong yields
makes for a sound investment in our client portfolios. See below for the annual return compared to government bonds and the global stock
market.
                              2020 2019 2018 2017 2016 2015 2014 2013 2012 2011 2010 2009 2008
       Reinsuranc e            7%   5%   3% -3%    7%   5%   9%   8% 10% 4% 11% 13% 2%
       Short Term Gov't Bonds  3%   4%   2%   0%   1%   1%   1%   0%   0%   2%   2%   1%   7%
       Global Stoc k Market   17% 27% -10% 25% 9% -2%        4% 24% 17% -7% 15% 37% -42%

Am I betting on the likelihood of certain natural disasters not occurring? No. Like our equity investment philosophy, we are looking
to capture this market’s risk premium in a very diversified manner over an extended period of time. Just as we can’t predict the financial
markets, we can’t predict the weather or prevent earthquakes. These bonds are underwritten using the most up-to-date science and
priced daily to reflect new information.

The portfolio holds a multitude of bonds with
exposures to a variety of weather events that have
little correlation to each other, let alone the
financial markets. See below for the strong
diversification of events (MP = Multi peril, EQ =
Earthquake
Global Valuations 14
What is the Investment Climate?
Price-to-Earnings (CAPE) Price-to-Book Value
As of 12/31/2020 As of 12/31/2020
Cyclically Adjusted Price-to-Earnings or “CAPE” is a valuation metric, where the current market price is divided by the last ten years of average earnings
(adjusted for inflation). The price you pay is what you get, and by utilizing average earnings over a longer period (10 years), we can put into perspective
whether the current market price is trending toward expensive, undervalued, or fairly valued historically.Quarterly Market Summary 15
Index Returns
Global
International Emerging Global Bond
US Stock Developed Markets Real US Bond Market
Market Stocks Stocks Estate Market ex US
4Q 2020 STOCKS BONDS
14.68% 15.85% 19.70% 12.55% 0.67% 0.94%
Since Jan. 2001
Avg. Quarterly Return 2.3% 1.6% 3.0% 2.4% 1.2% 1.1%
Best 22.0% 25.9% 34.7% 32.3% 4.6% 4.6%
Quarter
2020 Q2 2009 Q2 2009 Q2 2009 Q3 2001 Q3 2008 Q4
Worst -22.8% -23.3% -27.6% -36.1% -3.0% -2.7%
Quarter
2008 Q4 2020 Q1 2008 Q4 2008 Q4 2016 Q4 2015 Q2
Past performance is not a guarantee of future results. Indices are not available for direct investment. Index performance does not reflect the expenses associated with the
management of an actual portfolio. Market segment (index representation) as follows: US Stock Market (Russell 3000 Index), International Developed Stocks (MSCI World ex USA Index
[net div.]), Emerging Markets (MSCI Emerging Markets Index [net div.]), Global Real Estate (S&P Global REIT Index [net div.]), US Bond Market (Bloomberg Barclays US Aggregate Bond
Index), and Global Bond Market ex US (Bloomberg Barclays Global Aggregate ex-USD Bond Index [hedged to USD]). S&P data © 2021 S&P Dow Jones Indices LLC, a division of S&P
Global. All rights reserved. Frank Russell Company is the source and owner of the trademarks, service marks, and copyrights related to the Russell Indexes. MSCI data © MSCI 2021, all
rights reserved. Bloomberg Barclays data provided by Bloomberg.Long-Term Market Summary 16
Index Returns as of December 31, 2020
Global
International Emerging Global Bond
US Stock Developed Markets Real US Bond Market
Market Stocks Stocks Estate Market ex US
1 Year STOCKS BONDS
20.89% 7.59% 18.31% -9.09% 7.51% 3.94%
5 Years
15.43% 7.64% 12.81% 3.66% 4.44% 4.40%
10 Years
13.79% 5.19% 3.63% 6.14% 3.84% 4.35%
Past performance is not a guarantee of future results. Indices are not available for direct investment. Index performance does not reflect the expenses associated with the management of an actual
portfolio. Market segment (index representation) as follows: US Stock Market (Russell 3000 Index), International Developed Stocks (MSCI World ex USA Index [net div.]), Emerging Markets (MSCI Emerging Markets
Index [net div.]), Global Real Estate (S&P Global REIT Index [net div.]), US Bond Market (Bloomberg Barclays US Aggregate Bond Index), and Global Bond Market ex US (Bloomberg Barclays Global Aggregate ex-USD
Bond Index [hedged to USD]). S&P data © 2020 S&P Dow Jones Indices LLC, a division of S&P Global. All rights reserved. Frank Russell Company is the source and owner of the trademarks, service marks, and
copyrights related to the Russell Indexes. MSCI data © MSCI 2020, all rights reserved. Bloomberg Barclays data provided by Bloomberg.World Asset Classes 17
Fourth Quarter 2020 Index Returns (%)
Equity markets around the globe posted positive returns in the fourth quarter. Looking at broad market indices, emerging markets
outperformed non-US developed markets and US equities.
Value outperformed growth across regions. Small caps outperformed large caps across regions as well.
REIT indices underperformed equity market indices in both the US and non-US developed markets.
Russell 2000 Value Index 33.36
Russell 2000 Index 31.37
MSCI Emerging Markets Value Index (net div.) 22.98
MSCI Emerging Markets Small Cap Index (net div.) 22.22
MSCI Emerging Markets Index (net div.) 19.70
MSCI World ex USA Value Index (net div.) 19.30
MSCI World ex USA Small Cap Index (net div.) 17.55
MSCI All Country World ex USA Index (net div.) 17.01
Russell 1000 Value Index 16.25
MSCI World ex USA Index (net div.) 15.85
S&P Global ex US REIT Index (net div.) 15.03
Russell 3000 Index 14.68
Russell 1000 Index 13.69
Dow Jones US Select REIT Index 12.92
S&P 500 Index 12.15
Bloomberg Barclays US Aggregate Bond Index 0.67
One-Month US Treasury Bills 0.02
Past performance is not a guarantee of future results. Indices are not available for direct investment. Index performance does not reflect the expenses associated with the management of an actual
portfolio. The S&P data is provided by Standard & Poor's Index Services Group. Frank Russell Company is the source and owner of the trademarks, service marks, and copyrights related to the Russell Indexes. MSCI
data © MSCI 2021, all rights reserved. Dow Jones data © 2021 S&P Dow Jones Indices LLC, a division of S&P Global. All rights reserved. S&P data © 2021 S&P Dow Jones Indices LLC, a division of S&P Global. All
rights reserved. Bloomberg Barclays data provided by Bloomberg. Treasury bills © Stocks, Bonds, Bills, and Inflation Yearbook™, Ibbotson Associates, Chicago (annually updated work by Roger G. Ibbotson and Rex
A. Sinquefield).You can also read