UPDATES OF 'AW3D30' ALOS GLOBAL DIGITAL SURFACE MODEL IN ANTARCTICA WITH OTHER OPEN ACCESS DATASETS
←
→
Page content transcription
If your browser does not render page correctly, please read the page content below
The International Archives of the Photogrammetry, Remote Sensing and Spatial Information Sciences, Volume XLIII-B4-2021
                                                 XXIV ISPRS Congress (2021 edition)

             UPDATES OF ‘AW3D30’ ALOS GLOBAL DIGITAL SURFACE MODEL IN
                  ANTARCTICA WITH OTHER OPEN ACCESS DATASETS

                       Junichi Takaku 1, *, Takeo Tadono 2, Masanori Doutsu 1, Fumi Ohgushi 1, and Hiroki Kai 1

1
    Remote Sensing Technology Center of Japan, Tokyu REIT Toranomon BLDG 3F, 3-17-1 Minato-ku Tokyo, Japan –
                               (takaku, dotsu_masanori, fumi_og, kai)@restec.or.jp
        2   Earth Observation Research Center, Japan Aerospace Exploration Agency, 2-1-1 Sengen, Tsukuba, Ibaraki, Japan -
                                                       tadono.takeo@jaxa.jp

                                                      Commission IV, WG IV/3

KEY WORDS: Three-Line, Stereoscopic, Satellite, Optical, High resolution, DEM/DTM

ABSTRACT:

In 2016, the first processing of the semi-global digital surface models (DSMs) utilizing all the archives of stereo imageries derived
from the Panchromatic Remote sensing Instrument for Stereo Mapping (PRISM) onboard the Advanced Land Observing Satellite
(ALOS) was successfully completed. The dataset was freely released to the public in 30 m grid spacing as the ‘ALOS World 3D -
30m (AW3D30)’, which was generated from its original version processed in 5 m or 2.5 m grid spacing. The dataset has been
updated since then to improve the absolute/relative height accuracies with additional calibrations. However, the most significant
update that should be applied for improving the data usability is the filling of void areas, which correspond to approx. 10% of semi-
global coverage, mostly due to cloud covers. In 2020, we completed the filling process by using other open-access digital elevation
models (DEMs) such as Shuttle Radar Topography Mission (SRTM) DEM, Advanced Spaceborne Thermal Emission and Reflection
Radiometer Global DEM (ASTER GDEM), ArcticDEM, etc., except for Antarctica. In this paper, we report on the filling process of
the remaining voids in Antarctica by using other open-access DEMs such as Reference Elevation Model of Antarctica (REMA)
DSM, TerraSAR-X add-on for Digital Elevation Measurement (TanDEM-X, TDX) 90m DEM, and ASTER GDEM to complete the
void-free semi-global AW3D30 datasets.

                      1. INTRODUCTION                                 Elevation Model (DEM) (Rodriguez et al., 2006), Advanced
                                                                      Spaceborne Thermal Emission and Reflection Radiometer
The elevation map of terrain is one of the essential data for         Global DEM (ASTER GDEM) (NASA et al., 2019),
many geoscience applications e.g., ortho-photo processing,            ArcticDEM (Porter et al., 2018), etc., except for Antarctica
infrastructure design, disaster monitoring, natural resources         (Takaku et al., 2020). In Antarctica, more than a half of the
survey, and so on. In 2016, the first processing of semi-global       whole continent including large ice shelves are voids due to the
digital surface models (DSMs) utilizing all the archives of           heavy cloud and snow/ice coverage in the source imageries of
triplet stereo imageries derived from the Panchromatic Remote         PRISM.
sensing Instrument for Stereo Mapping (PRISM) onboard the             In this paper, we report on the filling process of the remaining
Advanced Land Observing Satellite (ALOS) was successfully             voids in Antarctica to complete the void-free semi-global
completed (Takaku et al., 2016). The dataset was named                AW3D30 datasets.
‘ALOS World 3D (AW3D)’, and has 5 m or 2.5 m grid spacing
derived from the optical triplet stereo imageries in 2.5 m                               2. INPUT DATASETS
resolution. The accuracy of the DSM was confirmed at 5 m
(rms) in vertical and also 5 m (rms) in horizontal. We then           We mainly used the Reference Elevation Model of Antarctica
generated its low resolution version of 1 arc-sec (approx. 30 m       (REMA) DSM version 1 (Howat et al., 2019) for the void-
on the equator) grid spacing (i.e., AW3D30) to be open to the         filling in Antarctica. The data were derived from optical stereo
public free of charge (Tadono et al., 2016). The dataset has          imageries of high-resolution (~ 0.5 m) commercial satellites i.e.,
been updated since then to improve the data qualities as well as      WorldView series and GeoEye-1. The dataset covers 98% of
accuracies with additional calibrations (Takaku et al., 2017,         the landmass up to 88°S. We used the mosaic tiles of 8 m grid
Takaku et al., 2018). In 2019, we proceeded to another                spacing after a preliminary inter-comparisons with the
significant update, the filling of void areas, which correspond to    AW3D30, which are explained in next section.
approx. 10 % of the semi-global land coverage. The void areas         The TerraSAR-X add-on for Digital Elevation Measurement
are mainly distributed in the equator zone and high-latitude          (TanDEM-X, TDX) 90m DEM (Wessel et al., 2018) was used
zones due to the heavy cloud coverage on the tropical rainforest      as secondary datasets. The data were generated from the
areas and the snow/ice on the polar areas respectively in source      interferometric processing of X-band bistatic radar onboard the
PRISM imageries. In 2020, we completed the filling process by         twin satellites. It has the grid spacing of 3 arc-secs as the low-
using other open-access digital elevation models (DEMs) such          resolution version of the original data in 0.4 arc-sec grid
as Shuttle Radar Topography Mission (SRTM) Digital                    spacing, covering all global land areas from pole to pole. The

* Corresponding author

                                                 This contribution has been peer-reviewed.
                  https://doi.org/10.5194/isprs-archives-XLIII-B4-2021-401-2021 | © Author(s) 2021. CC BY 4.0 License.             401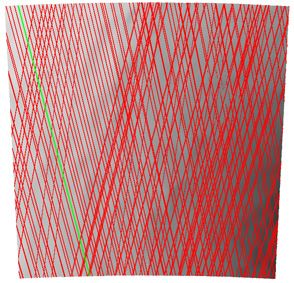
The International Archives of the Photogrammetry, Remote Sensing and Spatial Information Sciences, Volume XLIII-B4-2021
XXIV ISPRS Congress (2021 edition)
data were relatively compared with the AW3D30 before the
filling process as well.
The ASTER GDEM ver.3 was used as the third priority. The
data were generated from the optical stereo imageries of 15 m
resolution, covering land areas between N83° and S83° with 1
arc-sec grid spacing.
Other than the existing DEM datasets we optionally generated
additional DSMs from PRISM imageries that have over 30 %
cloud covers for the void-filling, while the original AW3D was
generated only from the imageries that have less than 30 %
cloud covers.
(a) : voids (b)
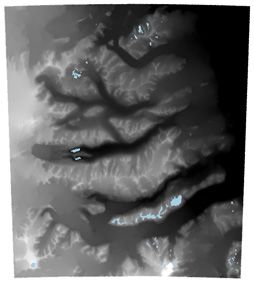
3. DEM INTER-COMPARISON 0m height 3000m 1200m height 2400m
Figure 1. AW3D30 DSMs on the sample areas.
The inter-comparisons between the AW3D30 DSM and the (a) steep-mountain-area at 77°-78°S/160°-164°E,
REMA DSM and between the AW3D30 DSM and the TDX (b) flat-ice-sheet-area at 80°-81°S/146°-152°E.
90m DEM were performed before we proceeded to the void-
filling. The periods of source data in the AW3D30 DSM, the
REMA DSM, and the TDX 90m DEM are 2006 ~ 2011, 2009 ~
2017, and 2010 ~ 2015, respectively. We selected two sample
areas where all three different DSMs include sufficient valid
data in different types of terrain. The one is located at the range
of 77°-78°S/160°-164°E including relatively steep mountainous
terrain in the height range of approx. 0 ~ 3000 m (steep-
mountain-area), while the other one is located at the range of
80°-81°S/146°-152°E including relatively flat terrain on an ice
sheet in the height range of approx. 1400 ~ 2200 m (flat-ice-
sheet-area). Figure 1 shows the AW3D30 DSMs on the two
sample areas, which originally consist of four and six 1°x1° (a) (b)
tiles each in geodetic latitude/longitude coordinates, projected
on Polar Stereographic (PS) coordinates.
In the calculation of their relative height differences, the REMA
DSM in 8 m grids were down-sampled into 1 arc-sec girds of
the AW3D30 with the averaging, while the TDX 90m DEM in
90 m grids were up-sampled into the same grids with the bi-
linear interpolation. The WGS84 ellipsoidal heights of the
REMA DSM and of the TDX 90m DEM were converted to
EGM96 orthometric heights of the AW3D30 DSM.
Figure 2 shows the spatial distributions of relative height
differences in the REMA DSM and in the TDX 90m DEM from
(c) (d)
the AW3D30 in the two sample areas. Figure 3 shows their
: voids/no-data
histograms with the bin-width of 1 m as well as the results of -20m +/-0m +20m
Gaussian curve fittings on them. Table 1 shows their statistics Figure 2. Spatial distributions of height differences
with the means and standard deviations estimated from the from AW3D30.
Gaussian fits. In both areas, we identified negative mean errors (a) and (b): REMA DSM at steep- and flat-area, resp.
for all compared DSMs, which mean that the heights of (c) and (d): TDX 90m DEM at steep- and flat-area,
AW3D30 are higher than others. They are approx. -3 m to -6 m
in the TDX 90m DEM and are larger than approx. -1 m in the 15 40
count (x 1,000,000)
count (x 1,000,000)
REMA DSM. In Fig. 2 (d), we observed systematic waving (a) (b)
30
patterns for the TDX 90m DEM that are not observed for the 10
20
REMA DSM shown in Fig. 2 (b). The maximum peak of waves 5
10
is approx. -50 m, while it seems that the patterns have faint
correlations with the original terrain of the ice sheet. It results in 0 0
‐20 ‐15 ‐10 ‐5 0 5 10 15 20 ‐20 ‐15 ‐10 ‐5 0 5 10 15 20
the relatively large mean difference of -5.75 m in Table 1, as height error [m] height error [m]
well as the left-skewed histogram in Fig 3 (d). The cause is still
8 20
unknown; however, the penetration of X-band radar signal on
count (x 1,000,000)
count (x 1,000,000)
(c) (d)
6 15
the ice-sheets is one of the possible causes (Abdullahi et al.,
2019). In Fig. 2 (c), no such patterns are observed in the TDX 4 10
90m DEM on the mountainous terrain; however, the negative 2 5
differences distributed in partial flat areas are considered to be 0 0
derived from the same phenomenon. It results in the mean ‐20 ‐15 ‐10 ‐5 0 5 10 15 20
height error [m]
‐20 ‐15 ‐10 ‐5 0 5 10 15 20
height error [m]
difference of -2.70 m in Table 1. The mean differences of
approx. -1 m in the REMA DSM are seemingly derived from Figure 3. Histograms of the height differences from
the temporal changes among the acquisitions of source stereo AW3D30 with the results of the Gaussian curve fittings.
imageries. The difference of reference data used in their (a) and (b): REMA DSM at steep- and flat-area, resp.
absolute height corrections is another possible cause of it, (c) and (d): TDX 90m DEM at steep- and flat-area, resp.
This contribution has been peer-reviewed.
https://doi.org/10.5194/isprs-archives-XLIII-B4-2021-401-2021 | © Author(s) 2021. CC BY 4.0 License. 402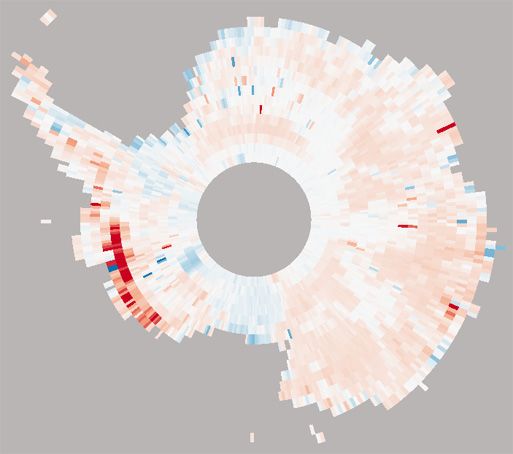
The International Archives of the Photogrammetry, Remote Sensing and Spatial Information Sciences, Volume XLIII-B4-2021
XXIV ISPRS Congress (2021 edition)
No. of Difference statistics Gaussian fit
Dataset Area
grids mean std.dev. max min LE90 mean std.dev.
77°-78°S/160°-164°E 45884020 -1.19 19.09 1486 -903 4 -1.09 1.21
REMA DSM
80°-81°S/146°-152°E 77760000 -1.45 1.34 70 -22 3 -1.41 0.99
TDX 90m 77°-78°S/160°-164°E 51464719 -2.70 12.23 377 -737 7 -2.24 2.98
DEM 80°-81°S/146°-152°E 77760000 -5.75 3.95 56 -55 10 -4.18 1.70
Table 1. Statistics of height errors from AW3D30 (in meters).
where the Ice, Cloud, and land Elevation Satellite (ICESat)
product GLA14 (Zwally et al., 2012) was used in the AW3D30,
whereas the ICESat product GLA12 and the product of
CryoSat-2 radar altimeter were used in the REMA DSM
(Howat et al., 2019). The standard deviations of the REMA
DSM and of the TDX 90m DEM in the mountainous area are
19.09 m and 12.23 m respectively. These relatively large
deviations are due to large outliers, which cause the height
differences of up to 1486 m, distributed in some local steep
spots. We identified that they were mostly caused by lack of
invalid masks on blunders in either of the AW3D30 DSM or the
REMA DSM that were seemingly processed from cloudy (a) (b)
imageries. On the other hand, the standard deviations estimated Figure 4. Distribution of ATL06 in sample areas.
from the Gaussian-fit on the histograms, which the effects of (a) steep-mountain area, (b) flat-ice-sheet area.
extreme outliers are invalidated, are 1.21 m and 2.98 m in the
REMA DSM and in the TDX 90m DEM respectively that imply
20
these DSMs have enough compatibility for the void-filling of AW3D30
(a)
AW3D30. In the flat ice sheet area, the standard deviations are REMA
15 TDX90m
1.34 m and 3.95 m in the REMA DSM and in the TDX 90m
count (x 10,000)
DEM respectively, where they have no large difference from
10
the estimated values from Gaussian-fits because there are no
such large outliers. Relatively large deviations in the TDX 90m
DEM are due to the difference of original grid spacing as well 5
as the systematic waving errors on the ice sheet mentioned
above. 0
‐20 ‐15 ‐10 ‐5 0 5 10 15 20
Other than the relative comparisons of DSMs, we compared the height error [m]
absolute accuracies of them by using the ICESat-2 land-ice 70
AW3D30
product ATL06 (Smith et al., 2020a) as the reference. The (b)
60 REMA
ATL06 has much denser distributions of height data on the 50 TDX90m
count (x 10,000)
ground surface with the samples processed at 20 m intervals in 40
each of six ground tracks per satellite orbit, as compared to the
30
ones of ICESat GLA14 with the 170 m intervals in one grand
track only per satellite orbit. We used the ATL06 data version 3 20
in the second repeat cycle of 91-days from 28 Dec. 2018 to 29 10
Mar. 2019. Figure 4 shows the distribution of ATL06 height 0
samples on the AW3D30 DSM in two sample areas. The ‐20 ‐15 ‐10 ‐5 0 5 10 15 20
height error [m]
numbers of valid ATL06 height samples are approx. 0.4 ~ 0.5
million and approx. 1.3 million in the steep mountainous area Figure 5. Histograms of the height errors from ATL06.
and in the flat ice sheet area, respectively. (a) steep-mountain area, (b) flat-ice-sheet area.
Since the height of the ATL06 is defined as the estimated
surface height of the segment center for each reference point 2250
TDX90m
(Smith et al., 2020b), the height in the DSMs to be compared is
WGS84 ellipsoidal height [m]
2200
REMA
resampled at the point with the bi-linear interpolation. The
2150 AW3D30
EGM96 orthometric heights of AW3D30 DSM are converted to ATL06
WGS84 ellipsoidal heights of others before the comparison. 2100
According to the quality information included in the ATL06 2050
product, only the best-quality subset data, which the
2000
“atl06_quality_summary” indicates zero, were used after
discarding the data of which the total vertical geolocation error 1950
indicated at “sigma_geo_h” exceeds 5 m. 1900
Figure 5 shows histograms of height errors in the three different ‐81.0 ‐80.8 ‐80.6 ‐80.4 ‐80.2 ‐80.0
DSMs from the ATL06 data with the bin-width of 1 m at the Latitude [degree]
two sample areas, while Table 2 shows their statistics with the Figure 6. Height profiles along with the ground track of
means and standard deviations estimated from the Gaussian fits ATL06 depicted in green on Fig. 4 (b).
This contribution has been peer-reviewed.
https://doi.org/10.5194/isprs-archives-XLIII-B4-2021-401-2021 | © Author(s) 2021. CC BY 4.0 License. 403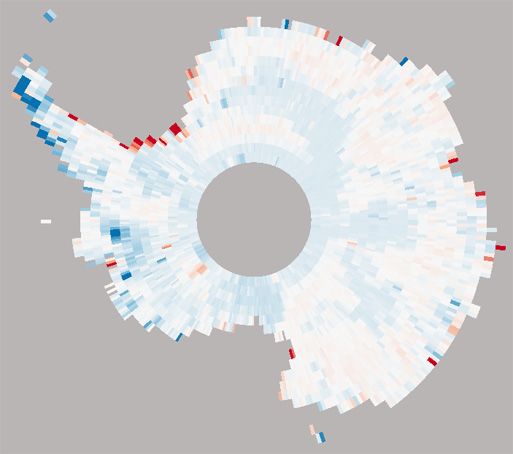
The International Archives of the Photogrammetry, Remote Sensing and Spatial Information Sciences, Volume XLIII-B4-2021
XXIV ISPRS Congress (2021 edition)
No. of Error statistics Gaussian fit
Dataset Area
samples mean std.dev. max min LE90 mean std.dev.
77°-78°S/160°-164°E 501831 1.40 8.51 636.77 -254.29 2.75 1.36 0.96
AW3D30 DSM
80°-81°S/146°-152°E 1279030 1.34 1.41 18.30 -14.27 2.71 1.37 0.91
77°-78°S/160°-164°E 447506 0.53 11.90 1164.36 -644.49 1.57 0.36 0.82
REMA DSM
80°-81°S/146°-152°E 1279030 -0.08 1.23 21.21 -17.19 1.35 -0.04 0.77
77°-78°S/160°-164°E 504043 -1.48 4.17 198.06 -177.10 5.05 -1.44 2.73
TDX 90m DEM
80°-81°S/146°-152°E 1279030 -4.40 4.12 18.35 -50.46 8.87 -2.78 1.70
Table 2. Statistics of height errors from ATL06 (in meters).
AW3D 5m
Original
OSM EGM96
Sea mask correction
Coast lines Geoid
Void‐filling with DSF
REMA DSM
Filtering blunders Exclude wrong DEM
TDX 90m
DEM
Auto/Man NG
ASTER QC 1
GDEM v3
Additional Void‐filling with IDW
PRISM DSM Manual correction
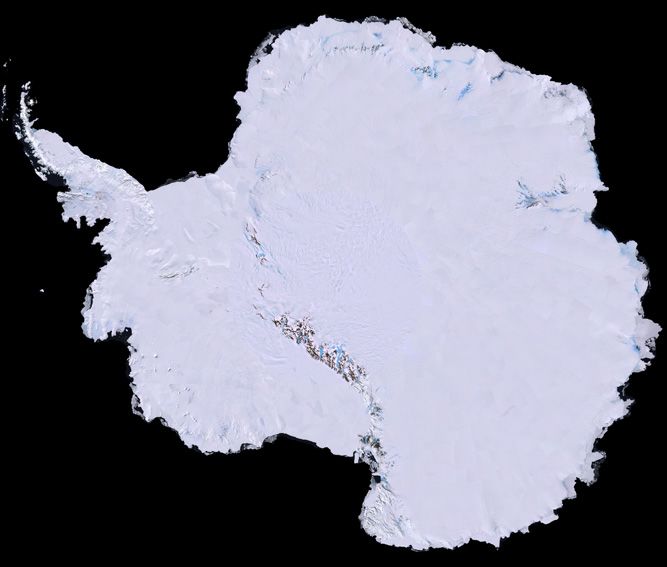
Figure 7. Comparison of coastlines in Antarctica on Auto/Man NG
Center-Filled LIMA (Bindschadler et al., 2008). QC 2
Red: GSHHS, Green: OSM coastlines.
Reduction of grid spacing
on the histograms. Figure 6 shows a comparison of height
profiles of the ATL06 and three DSMs along with the ground AW3D30
track of ATL06 depicted in green on Fig. 4 (b). The mean errors Void‐filled
are approx. 1.0 m to 1.5 m and -0.1 m to 0.5 m in the AW3D30
DSM and in the REMA DSM respectively in the two sample Figure 8. Processing flow of the AW3D void-filling
areas. These differences are considered to be derived from the in Antarctica.
difference of their absolute height reference used in their data
processing as well. The large standard deviations of 8.51 m and 4. SEA MASK CORRECTION
11.90 m in these two DSMs on the steep area are derived from
the large outliers as well. As the statistics of invalidating those The sea areas in the AW3D in Antarctica were originally
outliers, their 90th percentile linear errors (LE90) are 2.75 m masked by using the existing global water-body-data in public
and 1.57 m, as well as their standard deviations from Gaussian domain i.e., Global Self-consistent, Hierarchical, High-
fits on the histograms are 0.96 m and 0.82 m. In flat ice sheet resolution Shoreline Database (GSHHS) (Wessel et al., 1996).
area, the standard deviations are 1.41 m and 1.23 m in these two However we found some inconsistencies between the original
DSMs, which indicates both of them have enough relative sea masks and the source PRISM imageries. Therefore, we
accuracies to be merged. In the TDX 90m DEM, the negative replaced the GSHHS to the OpenStreetMap (OSM) coastlines
mean errors of -1.48 m and -4.40 m are observed as well at the (OpenStreetMap contributors, 2019), following the preceding
two sample areas. The cause is seemingly the same as the one void-filling process in other global areas of AW3D30 (Takaku
mentioned in the comparison with the AW3D30 DSM, where et al., 2020). Large ice-shelves were added as the valid areas in
the ATL06 and the AW3D30 are both derived from the the replacement. The additional voids that were generated from
reflection of optical signals in visible bands, whereas the TDX the replacement were filled in the void-filling process as well.
90m DEM is derived from the reflection of radar signals in X- Figure 7 shows a comparison between the original GSHHS and
band. In Fig. 6, it is confirmed that only the profile of the TDX the OSM coastlines depicted on the Landsat image mosaic of
90m DEM has partial negative errors, which correspond to the Antarctica (LIMA) (Bindschadler et al., 2008).
waving patterns in Fig. 2 (d), from those of others. It results in
the relatively large LE90 of 8.87 m in the ice-sheet area. 5. VOID FILLING
As the results, it was confirmed that the REMA DSM and the
TDX 90m DEM have compatibility with the AW3D30 DSM as The process of void-filling is basically the same as the one used
the first- and second-priority in the void-filling respectively in the preceding filling process for other global areas of
except for some blunders in the AW3D30 DSM or in the AW3D30 (Takaku et al., 2020) except for the input external
REMA DSM on local steep areas and the waving errors in the open-access datasets. Figure 8 shows the flow of the void-
TDX 90m DEM on ice sheets. filling process in Antarctica. It is applied to the AW3D original
This contribution has been peer-reviewed.
https://doi.org/10.5194/isprs-archives-XLIII-B4-2021-401-2021 | © Author(s) 2021. CC BY 4.0 License. 404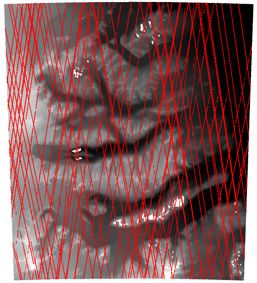
The International Archives of the Photogrammetry, Remote Sensing and Spatial Information Sciences, Volume XLIII-B4-2021
                                                XXIV ISPRS Congress (2021 edition)

                                                                            AW3D orig.
                                                                            Sea mask
                                                                            PRISM add.
                                                                            TDX-DEM
      Ellipsoidal height                                                    GDEMv3
     0m              4000m                                                  REMA
                                 (a)                                        IDW                      (b)

                Figure 9. (a) AW3D30 DSM void-filled ver.3.1 and (b) distribution of its source datasets in Antarctica
                                        projected on Polar Stereographic coordinates.

version of 0.15 arc-sec (5 m on the equator) grid spacing in                  Source             No. of grids              %
1°x1° tiles first. The grid spacing is reduced into 1 arc-sec of
                                                                         AW3D30 original        7,331,317,578            42.671
the AW3D30 products after all filling process are completed.
                                                                           REMA DSM             9,620,528,420            55.995
We applied the method of “delta surface fill” (DSF) (Grohman
                                                                          TDX 90m DEM            156,794,428              0.913
et al., 2006) which fills the voids with smoothing the height
gaps at boundaries between the original and the filling data                GDEM v3               36,088,737              0.210
without any change in the original data. The adaptive filtering         PRISM DSM (add.)          1,322,256               0.008
process, which eliminates blunders in original AW3D DSM, is                    IDW                35,051,130              0.204
applied as well after the filtering parameters, i.e., thresholds of            total            17,181,102,549           100.000
height difference from reference DSMs, number of stacks in                  Table 3. Proportion of source data in the AW3D30
AW3D, and minimum distance from nearest cloud masks, were                            void-filled ver. 3.1 in Antarctica
calibrated for new input datasets of the REMA DSM. The
results of the DSF based on the priorities of input DEMs and its
following adaptive filtering are checked tile by tile to detect                             6. VALIDATION
artifacts in filled areas. If an obvious artifact is detected the
filling process will be re-tried after excluding the corresponding    The perspective absolute height accuracies of the AW3D30 ver.
input DEM. For the voids remaining after all existing DEMs            3.1 in Antarctica were validated with both of the ICESat
were applied, we optionally use a simple interpolation with the       GLA14 and the ICESat-2 ATL06 for each of source DEM
inverse distance weight (IDW) method to fill them depending           dataset used in the filling-process. Though the GLA14 is not
on the condition of the void e.g., the size, shape, its surrounding   strictly independent for the validation because it was used at the
terrain, etc. The result of the interpolation is checked manually     correction of the absolute height in the processing of original
for each void segment to decide its acceptance.                       AW3D, we used it as a reference. We used all available datasets
Figure 9 shows the AW3D30 DSM void-filled ver.3.1, which              for the GLA14 in the period from 20 Feb. 2003 to 11 Oct. 2009,
consists of 4814 1°x1° tiles in geodetic latitude/longitude           whereas we used the same datasets for the ATL06 as mentioned
coordinates, as well as the distribution of its source open-access    in section 3, which were acquired in the period from 28 Dec.
datasets in Antarctica projected on PS coordinates. The index         2018 to 29 Mar. 2019 including all reference ground-tracks of
flags that indicate source datasets used in the void-filling were     1387 in the repeat cycle of 91-days. In the calculation of the
stored in the ancillary mask files of AW3D30 data products.           height difference between the GLA14 and the AW3D30 DSM,
Table 3 shows the proportion of source datasets in all valid data.    the heights in 1 arc-sec (30 m on the equator) grids of the
The original coverage of AW3D30 was limited up to 82°S due            AW3D30 under the ICESat’s footprint of 70 m in diameter
to the sun-synchronous orbit of the satellite, while the              were averaged. The samples that the standard deviations in the
remaining ranges up to 84°S were mostly filled with the REMA          averaging heights exceed 5 m were omitted because those in the
DSM following the north latitude limit of 84°N. As the result,        steep/rough terrain may have less reliability (Huber et al., 2009).
total 98.7% of all valid areas in Antarctica were filled with         In the comparison, the samples where the errors of heights
either of the AW3D original or the REMA DSM where their               exceed +/-100 m were associated with outliers due to the cloud
respective rates are approx. 42.7% and 56.0%. The TDX 90m             reflections, saturated waveforms or other anomaly in the
DEM was mainly used in remaining areas of approx. 0.9%                GLA14 and were excluded from the results (Carabajal et al.,
where both of the AW3D and the REMA DSM are voids. Other              2006). The calculation of the height difference between the
DSMs and the optional manual interpolation with the IDW               ATL06 and the AW3D30 DSM is the same as mentioned in
method were used with the rates of less than 0.21%.                   section 3.

                                                This contribution has been peer-reviewed.
                 https://doi.org/10.5194/isprs-archives-XLIII-B4-2021-401-2021 | © Author(s) 2021. CC BY 4.0 License.               405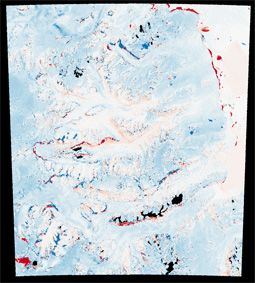
The International Archives of the Photogrammetry, Remote Sensing and Spatial Information Sciences, Volume XLIII-B4-2021
                                                XXIV ISPRS Congress (2021 edition)

                                                                    AW3D30 minus GLA14                                                                             AW3D30 minus ATL06
         Source                            no. of samples        mean     std.dev.      LE90      max      min                           no. of samples         mean     std.dev.    LE90     max           min
   AW3D30 orig.                                46,253,501        0.32      2.02         1.93      99.98   -100.00                            339,252,994        1.47      3.84       3.03    232.74     -481.80
    REMA DSM                                   74,974,403        -1.20     2.41         2.46      99.97   -100.00                            492,593,969        -0.06     1.95       1.41    896.03     -196.23
  TDX 90m DEM                                   567,401          -3.54     8.41         7.93      96.50   -99.12                              4,196,118         -3.34     8.35       7.35    330.44     -293.19
     GDEM v3                                     86,747          0.04      24.08        41.51     99.92   -99.84                              1,194,196         1.52      45.51      41.08   1654.68    -588.23
 PRISM DSM (add.)                                 664            -1.38     23.16        42.71     58.50   -94.38                                7,250           -15.94    54.48      81.76   878.56     -290.48
                 IDW                             70,297          -0.53     24.35        41.28     99.51   -99.98                              1,186,543         2.40      75.93      51.56   1655.66    -657.80
                Total                          121,953,013       -0.63     2.61         2.34      99.98   -100.00                            838,431,070        0.55      4.51       2.45    1655.66    -657.80

                                                 Table 4. Statistics of absolute height errors from GLA14 and from ATL06 (in meters).

                            50                                                                                                    40
                                   (a)                                                                                                   (b)
                                                                                                                                  35

                                                                                                           count (x 10,000,000)
                            40
      count (x 1,000,000)

                                                                                                                                  30
                            30                                                                                                    25
                                                                                                                                  20
                            20                                                                                                    15
                                                                                                                                  10
                            10
                                                                                                                                  5
                            0                                                                                                     0
                                 ‐20     ‐15      ‐10       ‐5     0       5       10     15      20                                   ‐20      ‐15       ‐10     ‐5     0       5     10    15        20
                                                            height error [m]                                                                                      height error [m]

                                           Figure 10. Histograms of errors in AW3D30 void-filled ver.3.1 for total samples in Antarctica.
                                                             (a) AW3D30 minus GLA14, (b) AW3D30 minus ATL06.

                                                                                            (a)                                        -10m +/-0m +10m
                                                                                                                                                                                               (b)
                                 -10m +/-0m +10m

                                       Figure 11. Distributions of mean error for each 1°x1° tile in AW3D30 void-filled ver.3.1 in Antarctica.
                                                              (a) AW3D30 minus GLA14, (b) AW3D30 minus ATL06.

Table 4 shows the statistics of height errors from the GLA14                                              REMA DSM, which account for 98.7% of all areas, are all less
and from the ATL06 for each of source dataset. Figure 10                                                  than 2.5 m. They are enough consistent with the specification
shows histograms of them with the bin-width of 1 m for their                                              accuracy of the AW3D (5 m, rms). The mean of the AW3D30
respective total samples. Figure 11 shows the distributions of                                            original is higher in approx. 1 m than that of the REMA DSM.
mean error from the GLA14 and from the ATL06 in each 1°x1°                                                It corresponds to the spatial distribution of mean errors shown
tile of the AW3D30 DSM. Note that these statistics do not                                                 in Fig. 11 (a) and to the result of their inter-comparison in
mean the relative difference of the absolute accuracies among                                             sample areas mentioned at section 3. The mean and standard
different datasets because the numbers as well as the areas of                                            deviation of TDX 90m DEM are -3.54 m and 8.41 m,
samples are different among them. The total numbers of                                                    respectively, seemingly due to its limited distribution on steep
samples are approx. 122 million and approx. 838 million for the                                           terrain as well as the penetration of the radar signal on ice-
GLA14 and for the ATL06 respectively, where the latter is                                                 sheets. Other DSMs have relatively large errors, i.e., 23 m to 24
approx. seven times larger than the former thanks to its high                                             m in standard deviation, due to small number of samples in
density of sampling on the ground.                                                                        difficult terrain as well as lack of source imageries for
In the results with the GLA14, the values of means, standard                                              generating DSMs in sufficient quality. As the result, the values
deviations, and LE90s for both of the AW3D30 original and the                                             of mean, standard deviation, and LE90 of total samples in the

                                                                        This contribution has been peer-reviewed.
                                         https://doi.org/10.5194/isprs-archives-XLIII-B4-2021-401-2021 | © Author(s) 2021. CC BY 4.0 License.                                                                 406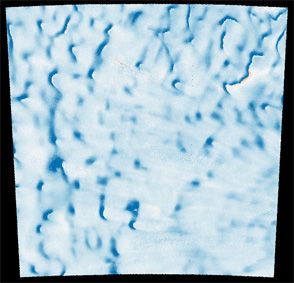
The International Archives of the Photogrammetry, Remote Sensing and Spatial Information Sciences, Volume XLIII-B4-2021
                                                XXIV ISPRS Congress (2021 edition)

different source datasets are -0.63 m, 2.61 m, and 2.34 m,           Grohman, G., Kroenung, G., Strebeck, J., 2006. Filling SRTM
respectively and are enough consistent with the specification        voids: The delta surface fill method. Photogrammetric
accuracy of 5 m in rms for the AW3D30.                               Engineering and Remote Sensing, 72 (3), pp. 213-216.
In the results with ATL06, the trends are almost the same as the
ones with the GLA14. However, the means for both of the              Howat, I. M., Porter, C., Smith, B. E., Noh, M.-J., Morin, P.,
AW3D30 original and the REMA DSM are higher in approx. 1             2019. The Reference Elevation Model of Antarctica. The
m than those from the GLA14. They are reflected in their             Cryosphere, 13, pp. 665-674. doi.org/10.5194/tc-13-665-2019.
spatial distributions shown in Fig. 11 (a) and (b). One possible
cause is the temporal change of the absolute heights on the ice      Huber, M., Wessel, B., Kosmann, D., Felbier, A., Schwieger, V.,
sheets during the time gap of at least nine years between the        Habermeyer, M., Wendleder, A., Roth, A., 2009. Ensuring
GLA14 and the ATL06. Other than the mean errors, the                 globally the TanDEM-X height accuracy: Analysis of the
standard deviations as well as the LE90s are larger except for       reference data sets ICESat, SRTM and KGPS-Tracks. Proc.
the REMA DSM and the TDX 90m DEM. They are derived                   IEEE IGARSS 2009, Vol. II, pp.769-772.
from large outliers in some local steep terrain, which are mainly
located near the coast of west Antarctica depicted in dark red at    NASA/METI/AIST/Japan Spacesystems, U.S./Japan ASTER
Fig. 11 (b), as mentioned in section 3. They result in the           Science Team, 2019. ASTER Global Digital Elevation Model
maximal and minimal errors of 232.74 m and -481.80 m                 V003. NASA EOSDIS Land Processes DAAC. doi.org/10.5067
respectively for the AW3D30 original in Table 4. It seems that       /ASTER/ASTGTM.003. (2019).
those outliers were excluded in the comparison with the GLA14
at the filtering process applied for excluding those derived from    OpenStreetMap contributors, Planet dump 2019. https://planet.
the data anomaly in GLA14. Therefore, the results with the           osm.org, https://www.openstreetmap.org.
ATL06 are relatively more reliable than those with the GLA14.
In spite of including these large outliers, the values of mean,      Porter, C., Morin, P., Howat, I., Noh, M.-J., Bates, B., Peterman,
standard deviation, and LE90 are 0.55 m, 4.51 m, and 2.45 m          K., Keesey, S., Schlenk, M., Gardiner, J., Tomko, K., Willis, M.,
respectively for total samples of the ATL06, and are enough          Kelleher, C., Cloutier, M., Husby, E., Foga, S., Nakamura, H.,
consistent with the specification accuracy of 5 m in rms for the     Platson, M., Wethington, M., Jr., Williamson, C., Bauer, G.,
AW3D30 as well.                                                      Enos, J., Arnold, G., Kramer, W., Becker, P., Doshi, A.,
                                                                     D’Souza, C., Cummens, P., Laurier, F., Bojesen, M., 2018.
                      7. CONCLUSION                                  ArcticDEM.       doi.org/10.7910/DVN/OHHUKH,              Harvard
                                                                     Dataverse, V1, (15 Jan. 2020).
The updates of AW3D30 global DSM datasets with other open
access datasets in Antarctica were presented. The voids in           Rodriguez, E., Morris, C. S., Belz, J. E., 2006. A Global
original dataset, which correspond to approx. 57 % of the whole      Assessment of the SRTM Performance. Photogrammetric
continent including large ice shelves in Antarctica, were filled     Engineering and Remote Sensing, 72(3), pp.249-260.
with existing open access DEM datasets that were prioritized
through inter-comparisons among them. The perspective                Smith, B., Fricker, H. A., Gardner, A., Siegfried, M. R.,
absolute accuracies of the void filled datasets were validated for   Adusumilli, S., Csathó, B. M., Holschuh, N., Nilsson, J., Paolo,
each of source dataset with both of the ICESat and the ICESat-2      F. S., and the ICESat-2 Science Team, 2020a. ATLAS/ICESat-
global point cloud reference. The result showed that the             2 L3A Land Ice Height, Version 3. Boulder, Colorado USA.
accuracies of the void-filled areas are enough consistent with       NASA National Snow and Ice Data Center Distributed Active
the AW3D30 original dataset except for some limited areas in         Archive Center. doi.org/10.5067/ATLAS/ATL06.003. (1 Mar.
extreme terrain.                                                     2021).
For future work, we will continue to update the datasets for
better quality/accuracy of the AW3D DSM with detecting and           Smith, B., Hancock, D., Harbeck, K., Roberts, L., Neumann, T.,
rectifying the blunders remaining in some limited areas. We          Brunt, K., Fricker, H., Gardner, A., Siegfried, M., Adusumilli,
also have a plan to apply new DSM datasets including the one         S., Csatho, B., Holschuh, N., Nilsson, J., Paolo, F., 2020b.
generated from the cross-track stereo imageries of the ALOS-3,       ICESat-2 Algorithm Theoretical Basis Document for Land Ice
a follow-on satellite of optical sensors onboard the ALOS            Along-Track Height Product, Release 003, NASA ICESat-2
(Takaku et al., 2019).                                               Project.

                        REFERENCES                                   Tadono, T., Nagai, H., Ishida, H., Oda, F., Naito, S., Minakawa,
                                                                     K., Iwamoto, H., 2016. Initial Validation of the 30 m-mesh
Abdullahi, S., Wessel, B., Huber, M., Wendleder, A., Roth, A.,       Global Digital Surface Model Generated by ALOS PRISM. Int.
Kuenzer, C., 2019. Estimating Penetration-Related X-Band             Arch. Photogramm. Remote Sens. Spatial Inf. Sci, XLI-B4,
InSAR Elevation Bias: A Study over the Greenland Ice Sheet.          pp.157-162.
Remote Sens. 2019, 11, 2903. doi.org/10.3390/rs11242903.
                                                                     Takaku, J., Tadono T., Tsutsui, K., Ichikawa, M., 2016.
Bindschadler, R., Vornberger, P., Fleming, A., Fox, A., Mullins,     Validation of ‘AW3D’ Global DSM Generated from ALOS
J., Binnie, D., Paulson, S., Granneman, B., and Gorodetzky, D.,      PRISM. ISPRS Ann. Photogramm. Remote Sens. Spatial Inf.
2008. The Landsat Image Mosaic of Antarctica, Remote                 Sci., III-4, pp. 25-31.
Sensing of Environment, 112, pp. 4214-4226.
                                                                     Takaku, J., and Tadono, T., 2017. Quality updates of ‘AW3D’
Carabajal, C., Harding, D., 2006. SRTM C-band and ICESat             global DSM generated from ALOS PRISM. Proc. IEEE
laser altimetry elevation comparisons as a function of tree cover    IGARSS 2017, pp. 5666-5669.
and relief. Photogrammetry Engineering and Remote Sensing,
72(3), pp. 287–298.

                                                This contribution has been peer-reviewed.
                 https://doi.org/10.5194/isprs-archives-XLIII-B4-2021-401-2021 | © Author(s) 2021. CC BY 4.0 License.             407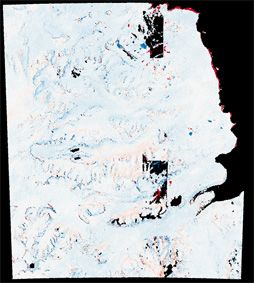
The International Archives of the Photogrammetry, Remote Sensing and Spatial Information Sciences, Volume XLIII-B4-2021
                                                XXIV ISPRS Congress (2021 edition)

Takaku, J., Tadono, T., Tsutsui, K., Ichikawa, M., 2018.            Wessel, B., Huber, M., Wohlfart, C., Marschalk, U., Kosmann,
Quality Improvements of ‘AW3D’ Global DSM Derived from              D., Roth, A., 2018. Accuracy Assessment of the Global
ALOS PRISM. Proc. IEEE IGARSS 2018, pp. 1612-1615.                  TanDEM-X Digital Elevation Model with GPS Data. ISPRS
                                                                    Journal of Photogrammetry and Remote Sensing. Vol. 139, pp.
Takaku, J., Tadono, T., Ohgushi, F., Doutsu, M., 2019. High         171-182.
resolution DSM generation from ALOS-3 stereo imageries.
Proc. IEEE IGARSS2019, pp. 1144-1147.                               Wessel, P., Smith, W. H. F., 1996. A Global Self-consistent,
                                                                    Hierarchical, High-resolution Shoreline Database. Journal of
Takaku, J., Tadono, T., Doutsu, M., Ohgushi, F., Kai, H., 2020.     Geophysical Research, 101(B4), pp. 8741-8743.
Updates of ‘AW3D30’ ALOS Global Digital Surface Model
with Other Open Access Datasets. Int. Arch. Photogramm.             Zwally, H., Schutz, R., Hancock, D., Dimarzio, J., 2012.
Remote Sens. Spatial Inf. Sci, XLIII-B4-2020, pp.183-189.           GLAS/ICEsat L2 Global Land Surface Altimetry Data (HDF5).
                                                                    Version 33. NASA DAAC at the National Snow and Ice Data
                                                                    Center, Boulder, CO, USA.

                                               This contribution has been peer-reviewed.
                https://doi.org/10.5194/isprs-archives-XLIII-B4-2021-401-2021 | © Author(s) 2021. CC BY 4.0 License.           408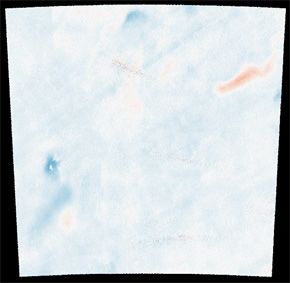
You can also read