The economic impact from the decreasing population mobility of China's mainland during the epidemic - Preprints.org
←
→
Page content transcription
If your browser does not render page correctly, please read the page content below
Preprints (www.preprints.org) | NOT PEER-REVIEWED | Posted: 21 December 2020                             doi:10.20944/preprints202012.0530.v1

          The economic impact from the decreasing population mobility of
          China’s mainland during the epidemic
          Yi Xiao 1, Jian Peng 2, Yuan Chen 1 and Zheming Yuan 1,*

                                      1 Hunan Engineering & Technology Research Centre for Agricultural Big Data Analysis & Decision-making,
                                        Hunan Agricultural University, Changsha, Hunan, 410128, China
                                      2 College of Information and Intelligence, Hunan Agricultural University, Changsha, Hunan, 410128, China

                                      * Correspondence: zhmyuan@sina.com;

                                      Abstract: The COVID-19 pandemic caused by SARS-CoV-2 poses a devastating threat to human
                                      society in terms of health, economy and lifestyle. Establishing accurate and real-time models to pre-
                                      dict and assess the impact of the epidemic on the economy is instructive. We have designed a new
                                      model to quantitatively assess the impact of the COVID-19 on the economy of China’s mainland.
                                      The nominal GDP in the Q1 of 2020 that we predicted for China’s mainland with the Baidu Migra-
                                      tion Data is RMB 20,785.7 billion, which is less by 3.59% than that in 2019. The estimated value is
                                      confirmed roughly by the official report released in April 17, 2020 (RMB 20,650 billion, 6.8% year-
                                      on-year declined). Strict control measures during the epidemic have greatly reduced China's eco-
                                      nomic activity and had a serious impact on the country's economy. Orderly promotion of popula-
                                      tion mobility plays a decisive role in economic recovery.

                                      Keywords: Economic impact; Population mobility data; Prediction; Assess; Covid-19

                                      JEL Classification:
                                      C15;C31;C51;C53;C55;C63;I18

                                      1. Introduction
                                            The COVID-19 hit Wuhan, China on December 29, 2019 and spread quickly across
                                      entire mainland [1]. As for April 12, 2020, 82052 were infected by the virus, and the deaths
                                      were 3339. The 31 provinces in China’s mainland raised their public health response level
                                      to the highest level (level-1) on January 29, 2020. To contain the spread of the epidemic,
                                      Chinese government has to adopt a series of large-scale public health interventions, such
                                      as inter- and intra-city travel restrictions, Staying Home Exercise, and Keeping Social Dis-
                                      tancing. These immediate and decisive measures have brought the epidemic under effec-
                                      tive control in early March [2,3], but have also significantly restricted the population mo-
                                      bility in China’s mainland [4]. According to the Baidu Migration Data, the inter-city trav-
                                      elers and the intra-city activity intensity in 346 cities in the Q1 of 2020 were 1.266 billion
                                      and 123218, which are less by 36.25% and 12.90% when compared to that in the same
                                      period of last year (1.985 billion and 141479) respectively (Fig.1).

                            Figure1. The population mobility in the Q1 of 2019 and 2020 in China's mainland
                                      Data source: Baidu Migration website

           © 2020 by the author(s). Distributed under a Creative Commons CC BY license.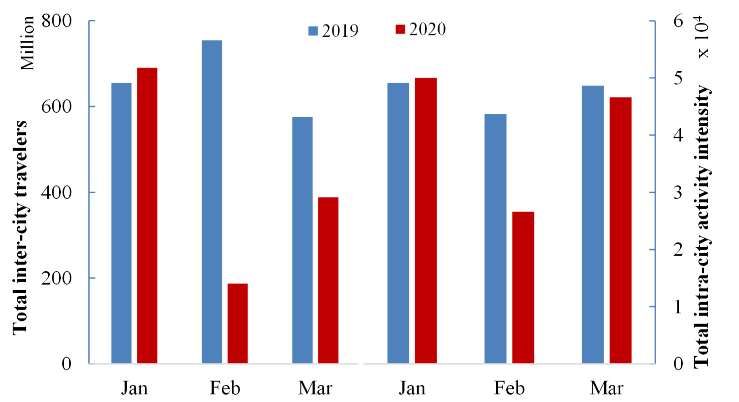
Preprints (www.preprints.org) | NOT PEER-REVIEWED | Posted: 21 December 2020                       doi:10.20944/preprints202012.0530.v1

                                                                                                                              2 of 8

               The population mobility, especially the inter-city and the inter-province travels, involving transportation, accom-
          modation, catering, business activities, sightseeing and shopping, has close associations with the regional economy [5-
          7]. The nationwide travel restriction has brought the entire service industry including transportation, catering, tourism,
          entertainment, and offline business, into a stagnation. The manufacturing supply chains have been hit heavily or even
          been partially broken. All of these have enormous negative impacts on the social and economic activities in the Q1 of
          2020 in China’s mainland. According to a recent report from the National Bureau of Statistics, some economic indicators
          in China dropped sharply in January and February of the year 2020 when compared to that in the same period of last
          year, such as the fixed asset investment(-24.5%), the total retail sales of consumer goods(-20.5%), the exports(-15.9%),
          the industrial added value(-13.5%), the service industry production index(-13%) and the profits of large-scale industrial
          enterprises(-38.3%).
               The Purchasing Manager Index (PMI) is an international macroeconomic monitoring index [8]. The mean PMI was
          45.9 in the Q1 of 2020 in China’s Mainland, which is less by 7.65% and 8.02% than that in the Q1 and the Q4 of 2019
          respectively. PMI is a leading indicator predicting GDP and usually has 3-6 months ahead [9], however, it is obviously
          invalid to predict the GDP for the Q1 of 2020 through the PMI of the Q3 or Q4 of 2019 when the epidemic heavily hit
          the economy. Economists, banks and institutions, etc. predicted at the early stage of the epidemic that the GDP growth
          rate of China in the Q1 of 2020 would decrease from 6% to 1.2% ~ 4.4%, for example 1.2% (China Economic Situation
          Report Website), 1.4%(Bloomberg), 2.5% (Goldman Sachs Asia), 2.8%(Standard Chartered) and 4.4%( Chinese Academy
          of Social Sciences). However, the predicted value dropped sharply to negative growth, -4.2% ~ -11%, when the epidemic
          has spread further to the world and seriously affected China's exports, for example, -4.2%(Standard Chartered), -
          5%(Morgan Stanley), -6% ~ -10%(Justin Lin), -6.48%(20 chief economists of China Business News), -9%(Goldman Sachs
          Asia) and -11%(Bloomberg). Evaluating the real impact of the epidemic on China's GDP in the Q1 of 2020 needs to
          develop a new quantitative predicting model. Based on the population mobility data from the Baidu Migration and the
          GDP data of 31 provinces in China’s mainland in the Q1 of 2019, we established a multiple regression model and pre-
          dicted the GDP of each province in the Q1 of 2020, and the real impact of the epidemic on the economy of China’s
          mainland was also assessed.

          2. Materials and Methods

          2.1 Data sources
               The GDP data and the population size in 2019 and 2020 of each province are from National Bureau of Statistics of
          China (http://www.stats.gov.cn/) and its affiliates. The population mobility data on inter-city and inter-province from
          January 1, 2020 to March 31, 2020 (including the same period data in 2019) in China’s mainland is from the Baidu Mi-
          gration (Baidu Inc., Beijing, China. http://qianxi.baidu.com), which is a largescale dataset based on an application that
          tracks the movements of mobile phone users and publishes the data in real time [10]. The Baidu platform represents the
          inter-city travel population of each city with the immigration and emigration indicators. The intensity of intra-city pop-
          ulation movements in each city is the ratio of the number of people travelling within a city to the number of residents
          in the city [4].

          2.2 Model design
               In the economic field, many methods, such as the Auto-regressive Integrated Moving Average Model and the Pur-
          chasing Managers' Index, are used for predicting and evaluating the GDP. These methods often rely on the parameters
          of a stationary time series and the results are lagging [11-13]. When certain major events causing large fluctuations in
          economic indicators occur, these forecasting methods will become unreliable. In response to the impact of the epidemic
          on the global economy, we estimated a model based on real-time population migration data to predict and evaluate the
          impact of the epidemic on the economy in time.

          2.3 Select parameters for the model
                At the level of province, we checked the relationship between the GDP in the Q1 of 2019 among the total emigration
          index of travelers leaving for other provinces, the total inter-city emigration index within the province, the population
          size; the determined coefficient were 0.7362, 0.7000 and 0.6981, respectively. The relationship between the population
          mobility index and the GDP is significantly stronger than that between the PMI and the GDP, respectively as: 0.44 [14],
          0.514 [15] and 0.75 [16], which shows that the population mobility index can be used to predict GDP in real-time. As for
          the population development index, there is a strong correlation between the previous economic inverse ranking of a
Preprints (www.preprints.org) | NOT PEER-REVIEWED | Posted: 21 December 2020 doi:10.20944/preprints202012.0530.v1
3 of 8
certain region and the subsequent economic development in the same period [17], so we further checked the inverse
ranking of the provincial GDP, and the determined coefficient was 0.7743.
The emigration index of travelers leaving from the ith province to other provinces on the jth day is denoted as PEIij
(i=1,2,…,31; j=1,2,…,90 for 2019 and 1,2,…,91 for 2020). The emigration index of travelers leaving from the kth city of the
ith province to other districts on the jth day is denoted as CEIkij (k=1,2,…,m; m is the total number of cities in the ith prov-
ince). Ratiokij represents the percentage of the number of travelers leaving from the kth city of the ith province to other
cities in the same province to the total number of travelers leaving from the kth city on the jth day. PEIij, CEIki and Ratiokij
are all listed in the Baidu Migration.
For each province, the total emigration index of travelers leaving from the ith province to other provinces from
January and February in 2019 can be calculated by the equation (1):
59
x1i PEI ij ,( i 1, 2,...31) (1)
j 1
The total inter-city emigration index within the province from January and February in 2019 can be calculated by the equation
(2):
59 m
x2 i CEI kij Ratiokij ,( i 1,2,...27) (2)
j 1 k 1
For each city, its x2r (r=28=“Beijing”, 29=“Chongqing”, 30=“Shanghai”, 31=“Tianjin”) can be represented with the
mean x2i of 27 provinces and adjusted by the population:
27
x 2i
x2 r 27
i 1
x5 r ,(r 28="Beijing", 29 "Chongqing", 30 "Shanghai", 31 "Tianjin") (3)
x
i 1
5i
/ 27
For each province, the total emigration index of travelers leaving from the ith province to other provinces in March
2019 can be calculated by the equation (4):
90
x3 i PEI ij ,(i 1, 2,...31) (4)
j 60
The total inter-city emigration index within the same province in March 2019 can be calculated by the equation (5):
90 m
x4i CEI
j 60 k 1
kij Ratiokij , (i 1, 2,...27) (5)
Similarly, x4r of each city can be calculated by the equation (6):
27
x 4i
x4 r 27
i 1
x5 r , (r 28, 29,30,31) (6)
x
i 1
5i / 27
x5: the population size of each province in 2019, represented with the population of 2018 end.
X6: the inverse ranking of the provincial GDP in the Q1 of 2019, represented with the ranking of the same period in 2018.
Y: the nominal GDP (RMB) of each province in the Q1 of 2019.
The data of the Q1 of 2019 for each province are listed in Table 1.Preprints (www.preprints.org) | NOT PEER-REVIEWED | Posted: 21 December 2020 doi:10.20944/preprints202012.0530.v1
4 of 8
Table 1. The nominal GDP and the population mobility data of each province in the Q1 of 2019.
Province x1 x2 x3 x4 x5×104 x6 Y×109
Anhui 530.5 718.1 196.8 258.6 6323.6 21 7065.7
Fujian 251.4 429.8 78.1 153.6 3941.0 24 8145.3
Gansu 127.4 238.2 54.0 106.9 2637.3 5 1736.5
Guangdong 1061.6 2125.6 266.8 867.5 11346.0 31 23886.8
Guangxi 314.7 588.3 100.8 194.0 4926.0 13 4225.3
Guizhou 267.4 428.6 96.4 157.9 3600.0 10 3205.8
Hainan 79.0 305.5 32.5 136.5 934.3 4 1300.3
Hebei 644.6 430.6 323.5 225.6 7556.3 19 8164.4
Henan 564.9 1033.9 220.7 476.6 9605.0 27 11639.1
Heilongjiang 130.8 280.9 50.7 114.4 3773.1 6 3184.6
Hubei 369.6 723.4 125.1 280.3 5917.0 25 9110.1
Hunan 418.6 824.2 127.7 277.1 6898.8 23 8335.0
Inner Mongolia 185.2 237.3 81.6 102.6 2534.0 11 3578.5
Jilin 125.9 274.1 50.9 128.0 2704.1 7 2701.8
Jiangsu 803.0 979.2 341.6 388.2 8050.7 30 22883.8
Jiangxi 328.4 368.3 102.7 114.6 4647.6 16 5373.1
Liaoning 193.1 442.0 82.3 205.0 4359.3 17 5486.2
Ningxia 53.9 123.9 24.0 56.8 688.1 3 752.4
Qinghai 34.6 61.4 15.3 32.6 603.2 2 557.1
Shaanxi 257.0 564.3 103.6 239.3 3864.4 12 5450.3
Shandong 430.2 914.8 199.8 427.2 10047.2 29 20177.4
Shanxi 203.3 398.8 94.5 186.4 3718.3 18 3533.2
Sichuan 485.3 1209.0 165.5 427.4 8341.0 26 9653.2
Tibet 12.0 15.9 4.4 8.2 343.8 1 324.1
Xinjiang 49.5 231.9 15.9 120.1 2486.8 8 2177.7
Yunnan 194.1 573.5 71.2 221.0 4829.5 14 3849.7
Zhejiang 703.4 551.3 221.9 214.9 5737.0 28 13084.1
Beijing 594.8 1117.8 273.6 554.5 2154.2 20 7409.6
Chongqing 329.2 1708.5 107.4 663.9 3101.8 15 5102.3
Shanghai 510.8 1117.8 232.6 665.7 2423.8 22 8308.3
Tianjin 219.7 869.3 104.4 418.7 1559.6 9 5198.6
Data source: Baidu Migration website and National Bureau of Statistics of China website Notes:
Notes:
x1: The total emigration index of travelers leaving for other provinces from January to February in 2019.
x2: The total inter-city emigration index within the same province from January to February in 2019.
x3: The total emigration index of travelers leaving for other provinces in March, 2019.
x4: The total inter-city emigration index within the same province in March,2019.
x5: The population size of each province in 2019.
x6: The inverse ranking of the provincial GDP in the Q1 of 2018
Y: The nominal GDP of each province in the Q1 of 2018.Preprints (www.preprints.org) | NOT PEER-REVIEWED | Posted: 21 December 2020 doi:10.20944/preprints202012.0530.v1
5 of 8
2.4 The construction of the regression equation
The epidemic in China’s mainlandhas been brought under effective control in early March of 2020. On March 18,
zero newly confirmed case was first reported. At the beginning of March, all provinces except Hubei began to recover
economic activities orderly, and the population mobility in March was significantly higher than that in February. The
share of the GDP in March to the GDP in the Q1 is usually 40%. Taking January, February and March as a whole, the
importance of March will be diluted and the predicted value will be decreased. To avoid the disturbance of the "Spring
Festival" when comparing the economic indexes among different years or months, the GDP of January and February
has always been viewed as a whole by the National Bureau of statistics. According to Table 1, the GDP of January and
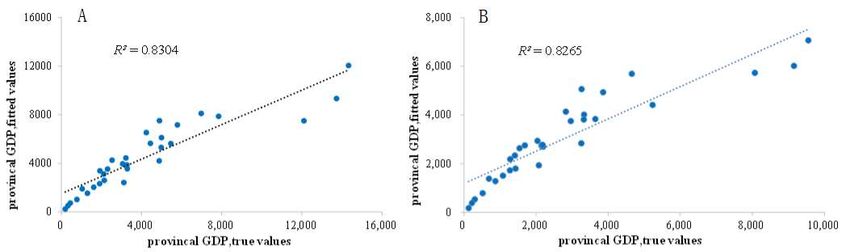
February (Y1-2) and the GDP of March (Y3) of each province can be predicted by the follow regression models.
Y1-2=0.6×Y= 6.3621×x1 + 0.02842×x2+0.3015×x5 +58.8302×x6 (n = 31, R2= 0.8304, PPreprints (www.preprints.org) | NOT PEER-REVIEWED | Posted: 21 December 2020 doi:10.20944/preprints202012.0530.v1
6 of 8
Y': The predicted nominal GDP of each province in the Q1 of 2020
Feeding the regression models with the corresponding population mobility data in the Q1 of 2020, we got the
predicted GDPs of January and February (Y'1-2) and the predicted GDPs of March (Y'3) for each province in 2020. In the
Q1 of 2020, the consumer price index (CPI) rose by 4.9% year-on-year (National Bureau of Statistics 2020), the predicted
GDPs in the Q1 of 2020 for each province (Y') can be adjusted by the following formula, and are listed in Table 2.
Y'= (Y'1-2+Y'3)×1.049 (n = 31, R2= 0.8907, PPreprints (www.preprints.org) | NOT PEER-REVIEWED | Posted: 21 December 2020 doi:10.20944/preprints202012.0530.v1
7 of 8
x'2: The total inter-city emigration index within the same province from January to February in 2020.
x'3: The total emigration index of travelers leaving foe other provinces in March, 2020.
x'4: The total inter-city emigration index within the same province in March,2020.
x'5: The population size of each province in 2020.
x'6: The inverse ranking of the provincial GDP in the Q1 of 2019
Y': The predicted nominal GDP of each province in the Q1 of 2019.
We predict that the nominal GDP of China in the Q1 of 2020 is RMB 20,785.7 billion, which is less by 3.59% when
compared to the same period of last year (RMB 21,560 billion). This result is confirmed roughly by the official report
released on April 17, 2020 (RMB 20,650 billion).
According to the GDP data of each province in the Q1 of 2020 published by the National Bureau of Statistics, we
conducted a correlation analysis over the predicted results, and the analytical results are shown in Figure 3.
20000
provincal GDP,predicted values
R² = 0.8907
15000
10000
5000
0
0 5000 10000 15000 20000 25000
provincal GDP,true values
Figure 3. The true and the predicted GDPs of 31 provinces of China’s mainland in the Q1 of 2020
3. Results
We used the stepwise linear regression method to select relevant parameters from the Baidu Migration Data and
established a regression equation to predict the nominal GDP of China’s mainland in the Q1 of 2020 is RMB 20,785.7
billion, which is less by 3.59% than that in 2019. Validity of this predicted value is strongly supported by the official
report released on April 17, 2020 (RMB 20,650 billion). The Population mobility data provides an important reference
method and a view for evaluating the impact of the epidemic on other economies and the global as a whole, and also
provides a new indicator for the real-time economic prediction when the epidemic ends.
Due to the international flights data is unobtainable, the international population mobility is not considered in our
research, which may be one reason for the higher predicted value of this paper. It is an interesting topic to predict the
GDP by using the real-time population mobility data and the leading PMI indicator. Since the Baidu Migration has
stopped disclosing its migration data for theQ2 of 2020 from May 8th, we do not forecast and assess the GDP of China’s
mainland in the Q2 of 2020.
4. Discussion
Although the population mobility has increased significantly since March and the PMI has rebounded
sharply, China’s economy in 2020 is still not optimistic because it will continue to suffer from the global epidemic,
and the expected target of the annual growth rate is most likely less than 6%. According to the National Bureau
of Statistics of China, China’s economy grew by 3.2% year-on-year in the Q2, which is still lower than expected.
Some suggestions are provided here. 1) Continue to actively enlarge the domestic demand. For example, fullyPreprints (www.preprints.org) | NOT PEER-REVIEWED | Posted: 21 December 2020 doi:10.20944/preprints202012.0530.v1
8 of 8
playing the advantages of China's large-scale market, actively enlarging the residential consumption, reasonably
increasing the public consumption, starting the consumption in physical stores, continuing to maintain the online
consumption enthusiasm, and releasing the consumption demand being suppressed for the epidemic. 2) Reason-
ably enlarge the effective investment scale. For example, accelerating the construction of 5G network, data center
and other new infrastructure, focusing on the layout of digital economy, life and health, new materials, and other
emerging strategic industries and future industries. 3) Precision foreign trade. For example, guiding foreign trade
enterprises to adjust their production capacity and structure so as to meet the special global consumption demand
during the pandemic, and be a better "world factory" to fight against the pandemic. 4) Continue to carry out the
proactive fiscal policy and the moderately easy monetary policy, further reduce taxes, fees and interest rates.
Supplementary Materials: Code and data are available on the following GitHub repository: https://github.com/Xiao-
Yii/Migration-economic-data.
Author Contributions: Data curation, Yi Xiao; Formal analysis, Yi Xiao and Yuan Chen; Resources, Yi Xiao; Software,
Yuan Chen; Writing – original draft, Yi Xiao and Zheming Yuan; Writing – review & editing, Jian Peng.
Funding: This research was funded by the Scientific Research Foundation of Education Office of Hunan Province, China
(17A096).
Acknowledgements: We thank Baidu for providing population mobility data.
Conflicts of Interest: The authors declare no conflict of interest. The funders had no role in study design, data collection
and analysis, the decision to publish, or in preparation of the manuscript.
References
1. Huang, C., Wang, Y., Li, X., Ren, L., Zhao, J., Hu, Y., Zhang, L., Fan, G., Xu, J., Gu, X., Cheng, Z., Yu, T., Xia, J., Wei, Y., Wu, W.,
Xie, X., Yin, W., Li, H., Liu, M., Xiao, Y., Gao, H., Guo, L., Xie, J., Wang, G., Jiang, R., Gao, Z., Jin, Q., Wang, J., Cao, B.,(2020).
Clinical features of patients infected with 2019 Novel Coronavirus in Wuhan, China. LANCET, 395(10223), 497-506.
2. Tian. H., Liu, Y., Li, Y., Wu, C., Chen, B., Kraemer, M., Li, B., Cai, J., Xu, B., Yang, Q., Wang, B., Yang, P., Cui, Y., Song, Y., Zheng,
P., Wang, Q., Bjornstad, O., Yang, R., Grenfell, B., Pybus, O., Dye, C., (2020). An investigation of transmission control measures
during the first 50 days of the COVID-19 epidemic in China. SCIENCE, 368(6491), 638-642.
3. Kraemer, M., Yang, C., Gutierrez, B., Wu, C., Klein, B., Pigott, D., Open COVID-19 Data Working Group; Plessis, L., Faria, N.,
Li, R., Hanage, W., Brownstein, J., Layan, M., Vespignani, A., Tian, H., Dye, C., Pybus, O., Scarpino, S.,(2020). The effect of
human Mobility and Control Measures on the COVID-19 Epidemic in China. SCIENCE, 368(6490), 493-497.
4. Yuan, Z., Xiao, Y., Dai, Z., Huang, J., Chen, Y., (2020). Modelling the effects of Wuhan’s lockdown during COVID-19, China. B
WORLD HEALTH ORGAN, 98(7), 484-494.
5. Goldschlag, N., Lane, J., Weinberg, B., Zolas, N., (2019). Proximity and Economic Activity: An Analysis of Vendor-University
Transactions. J REGIONAL SCI, 59, 163-182.
6. Bunten, D., Weiler, S., Thompson, E., Zahran, S., (2015). Entrepreneurship, Information, and Growth. J REGIONAL SCI, 55, 560-
584.
7. Yin, P., Lin, Z., Prideaux, B., (2019). The impact of high-speed railway on tourism spatial structures between two adjoining
metropolitan cities in China: Beijing and Tianjin. J TRANSP GEOGR, 80: 102495.
8. Afshar, T., Arabian, G., Zomorrodian, R., (2007). Stock return, consumer confidence, purchasing managers index and economic
fluctuations. JBER, 5(8),97-106.
9. Aprigliano, V. (2011). The relationship between the PMI and the Italian index of industrial production and the impact of the
latest economic crisis. Bank of Italy Temi di Discussione (Working Paper) No, 820.
10. Baidu Migration. Data on Population mobility in China. (2020).http://qianxi.baidu.com [cited 2020 May 8]
11. Stevenson, S. (2007). A comparison of the forecasting ability of ARIMA models. JPIF, 25(3), 223-240.
12. Khashei, M., Bijari, M., Hejazi, S. (2012). Combining seasonal ARIMA models with computational intelligence techniques for
time series forecasting. APPL SOFT COMPUT, 16(6), 1091-1105.
13. Lindsey, M., Pavur, R. (2005). As the PMI turns: a tool for supply chain managers. JSCM, 41(1), 30-39.
14. Eren, O. (2014). Forecasting the Relative Direction of economic growth by Using the Purchasing Managers' Index. IKTISAT
ISLET FINANS, 29(344),55-72.
15. Lahiri, K., Monokroussos, G. (2013). Nowcasting US GDP: The role of ISM business surveys. INT J FORECASTING, 29, 644-658.
16. Rolando, F. (2018). Improving the usefulness of the Purchasing Managers' Index. B ECON, 53,195-201.
17. Tektüfekçi F., Kutay N. (2016). The relationship between EPI and GDP growth: an examination on developed and emerging
countries. JMAA, 12(5), 268-276.
18. National Bureau of Statistics. The official release of Chinese statistics. (2020) .http://www.stats.gov.cn/ [cited 2020 March22]You can also read