MI COVID response Data and modeling update - August 2, 2021
←
→
Page content transcription
If your browser does not render page correctly, please read the page content below
MI COVID response
Data and modeling update
August 2, 2021

NOTE: all data as of Aug 1 unless otherwise noted
Draft and pre-decisional
Executive summary
Michigan is currently in Moderate Transmission

Percent Positivity (5.8%) is increasing for five weeks (up from 4.1% last week), and Case Rate (49.5 cases/million) have increased for
one month (up from 29.5 last week)

  Michigan has the 26th lowest number of cases (31st last week), and 7th lowest case rate (8th last week) in the last 7 days (source:
  CDC COVID Data Tracker)

Percent of inpatient beds occupied by individuals with COVID (1.9%) has increased for three weeks (up from 1.6% last week).

  Michigan has the 8th lowest inpatient bed utilization (9th last week), and the 11th lowest adult ICU bed utilization (11th last week) in
  the country (source: US HHS Protect)

Deaths (0.4 deaths/million) are plateaued (0.3 deaths/million last week). There were 25 COVID deaths between Jul 20 and Jul 26.

  Michigan has the T28th lowest number of deaths (T38th last week), and T9th lowest death rate (T18th last week) in the last 7 days
  (source: CDC COVID Data Tracker)

The 7-day average state testing rate has increased to 1,842.2 tests/million/day. Daily diagnostic tests (PCR) is 13.0K per day, and the
weekly average for PCR and antigen tests conducted in Michigan is 25.1K.

9.83 million COVID-19 vaccine doses reported to CDC, 4.89 million people have completed their vaccine series

                                                                                                                                             2
Agenda
Status of COVID-19 Epidemiological Risk
State-by-state comparison of epidemic spread
Michigan epidemic spread
Public health response
Science round-up
3
Global and National Comparisons
What we see today (data through 8/2):
•       Globally, 198,513,748 cases and 4,228,153 deaths
•       Countries with the highest number of cases are U.S. (35,007,081), India (31,695,958), and Brazil (19,938,358)
•       Within the U.S., North Dakota (14,650 per 100,000), Rhode Island (14,569/100,000), & South Dakota
        (14,154/100,000) lead the nation in cumulative case rates
•       Michigan currently has identified 14,224 variants of concern (VOC)*
         – Cumulatively, the vast majority are B.1.1.7 (13,638 which is 95.9%)
                 •   Other VOCs include B.1.351 (0.6%), P.1 (2.3%) and B.1.617.2(1.2%)
         – Using specimen collection date, there have been 99 VOC reported in the 4 most
           recent weeks
                 •   127 Delta (B.1.617.2) 96%
                 •   5 Alpha (B.1.1.7) 4%

                                                                                         Public Health     Other       Science
      National
    * CDC         Comparison
          removed Episilon (B.1.427/B.1.429) from the lists ofSpread
                                                               VOCs
                                                                                          Response       Indicators   Round-up

                                                                                                                                 4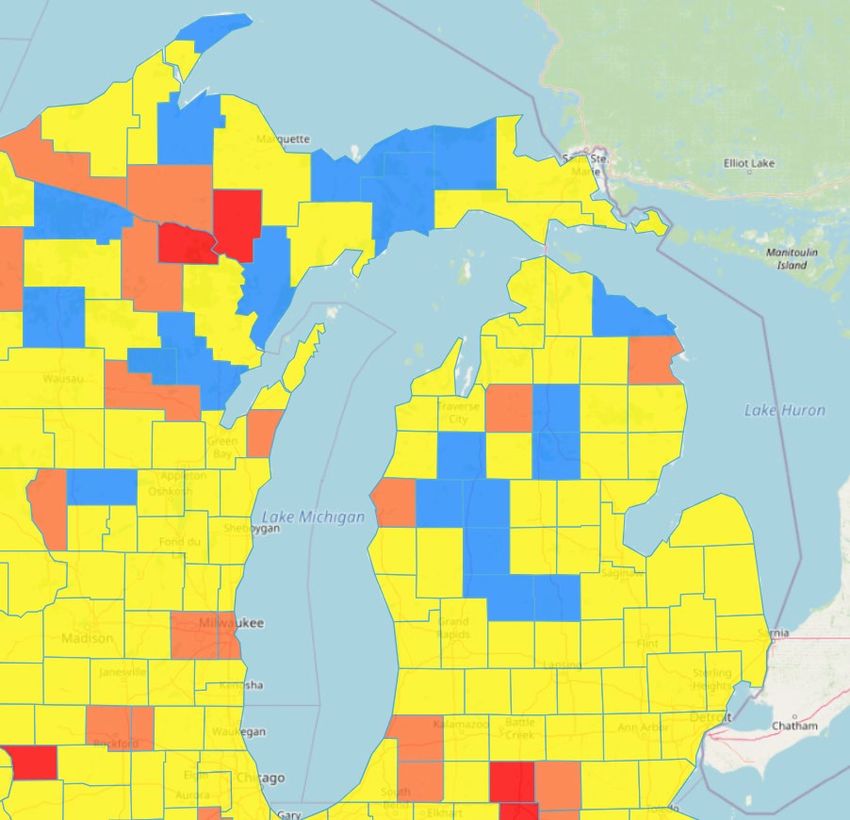
Key Messages: COVID-19 Spread
Statewide positivity has increased to 5.8% (last week: 4.1%)
• One week percent change is up 40% (vs. up 46% last week)
• Increasing for five weeks (up 370% since Jun 26 low)
• Positivity is increasing in all MERC regions and two regions are >7%
Case rate (49.5 cases/million) is at an incidence plateau (last week: 29.5 cases/million)
• One week increase of 43% (vs. 26% increase last week)
• Increasing for one month (257% increase since Jun 26 low)
• Cases per million are increasing in all MERC regions
• Select variants in Michigan: 13,645 confirmed Alpha (B.1.1.7); 85 confirmed Beta (B.1.351); 328 confirmed Gamma (P.1); and 233
confirmed Delta (B.1.617.2)
Michigan is in Moderate Transmission level
• 24 counties met substantial transmission and 7 county met high transmission level and CDC would recommend all individuals, regardless
of vaccination status, should mask indoors
• The U.S. is at high transmission level (133.4 cases/100,000 in last 7 days) with 48 states/jurisdictions in substantial or high transmission
Number of active outbreaks is up 112% from last week
Forty-two new outbreaks were identified in the past week
Long-Term Care/Skilled Nursing Facilities reported the most new and ongoing outbreaks this week
Public Health Other Science
National Comparison Spread
Response Indicators Round-up
Confirmed and probable case indicators                                                  Risk levels
Table Date: 8/2/2021 (7 days from date table was produced: 7/26/2021)         Low   A    B       C      D   E

                                                                                        Plateau – 3wk

 Cases                                              Positivity

    National                                Public Health          Other                  Science
                       Spread                                                                                   6
   Comparison                                Response            Indicators             Round-up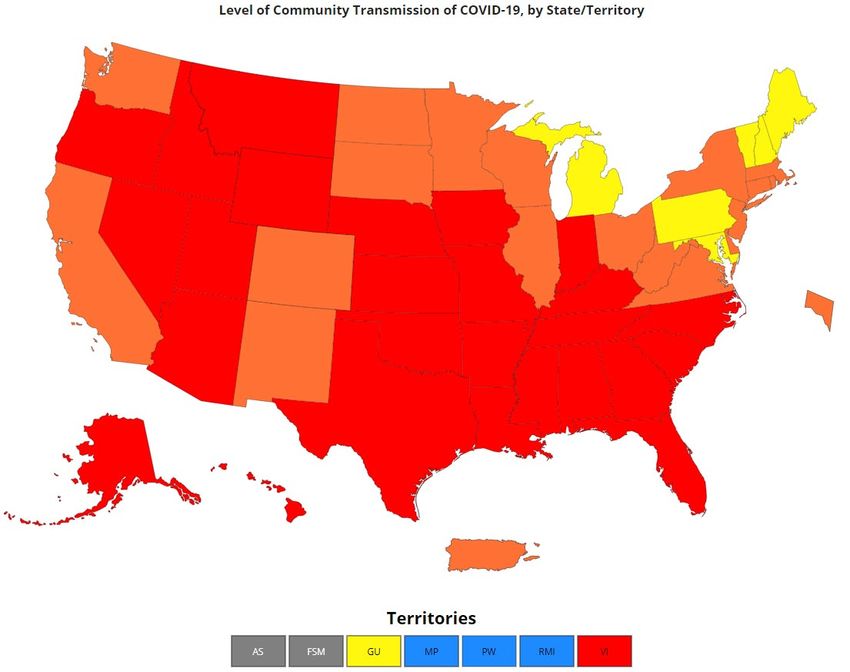
Percent Positivity and Case Rate Trends
                              MI Statewide Daily Positivity Test Rate                                          MI Statewide Daily Case Rate (per million)
7%                                                                                                60
6%                                                                                                50
5%
                                                                                                  40
4%
                                                                                                  30
3%
                                                                                                  20
2%
1%                                                                                                10

0%                                                                                                 0
         7/5                     7/12                      7/19                    7/26     8/2        7/5       7/12                  7/19            7/26        8/2
                                 Daily Positive Test Rate                   7-Day Average                     Daily cases per million population   7-Day Average

     •      Positivity has been gradually increasing for the previous five weeks
     •      Case rates have been increasing for a month and growth rate is increasing more rapidly

         *Source: MDSS and MiStartMap.info, cases displayed by onset date

                                                                                              Public Health                 Other                       Science
         National Comparison                                          Spread
                                                                                                  Response               Indicators                    Round-up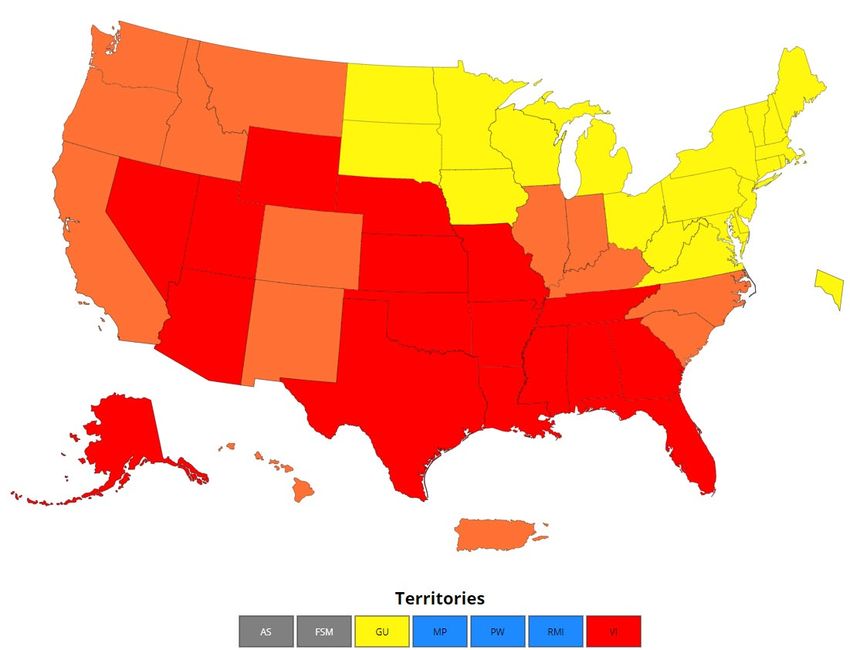
Overview of metrics for individuals
Comparing CDC community transmission thresholds to MI levels
Case Rate*†
       Low         A           B                            C                                                 D                                              E
MI*
CDC Transmission Levels, U.S. state (data through 8/2/2020)
•   Michigan is at moderate transmission level
    •   47.4/100,000/7day (CDC) (substantial is 50+)
    •   5.8% positivity
•   The number of jurisdictions at low is the same from 7
    days ago (3 blue colored jurisdictions)
•   20 jurisdictions have substantial transmission (orange
    states); up 7 from 7 days ago
•   27 jurisdictions have high transmission (red states); up
    9 from 7 days ago

                   Last Week

                                                               Public Health     Other       Science
National Comparison                    Spread                                                          10
                                                                Response       Indicators   Round-up
CDC County Transmission Levels, 8/2
This Week, 8/1 Transmission # of counties This week
Last week
Levels
Last week, 7/24 Low 7
14
Moderate 45
59
Substantial 24
8
High 7
2
Updates since last week:
• 7 of 83 counties met low transmission level this
week, a 7 county decrease from last week
• 45 of 83 counties met moderate transmission
classification, an 14 county decrease
• 24 of 83 counties met substantial transmission
classification, a 16 county increase from last week
• 7 of 83 counties met high transmission
classification, a 5 county increase from last week
*Source: CDC Levels of Community Transmission at https://covid.cdc.gov/covid-data-tracker/#county-view
Public Health Other Science
National Comparison Spread 11
Response Indicators Round-upAge group: average new daily cases
Daily new confirmed and probable cases per million by age group (7-day rolling average)
1000
0-9 30-39 60-69
10-19 40-49 70-79
20-29 50-59 80+
750
500
250
0
3/1 4/1 5/1 6/1 7/1 8/1 9/1 10/1 11/1 12/1 1/1 2/1 3/1 4/1 5/1 6/1 7/1 8/1
• Case rate trends for most age groups by decade are increasing
• Case rates for all age groups are between 30 and 81 cases per million (through 7/27)
Note: Case information sourced from MDHHS and reflects date of onset of symptoms
Source: MDHHS – Michigan Disease Surveillance System
Public Health Other Science
National Comparison Spread 12
Response Indicators Round-upAge group: average new daily cases, last 30 days
Daily new confirmed and probable cases per million by age group (7-day rolling average)
100 0-9 30-39 60-69
10-19 40-49 70-79
20-29 50-59 80+
75
50
25
0
6/26 7/3 7/10 7/17 7/24 7/31
• Case rate trends for most age groups by decade are increasing
• Case rates for all age groups are between 30 and 81 cases per million (through 7/27)
Note: Case information sourced from MDHHS and reflects date of onset of symptoms
Source: MDHHS – Michigan Disease Surveillance System
Public Health Other Science
National Comparison Spread 13
Response Indicators Round-upAge group: average new daily cases and daily case rate
Daily new confirmed and probable cases per million by age group (7-day rolling average)
Age Average Average One Week • Average daily number of cases (112) is
Group daily cases Daily Case % Change (Δ #) highest for those aged 20-29
Rate
• Avg. daily case rate (81.0 cases/mil) is
0-9 44.9 38.9 67% (+18) currently highest for 20-29
10-19 66.9 53.3 53% (+23) • Case rates for all age groups are
20-29 111.7 81.0 47% (+36) between 30-81 cases per million
30-39 90.0 74.2 33% (+22) • Case rate trends are increasing
40-49 72.4 61.4 30% (+17) • Case rates bottomed out on June 26,
50-59 61.3 45.4 32% (+15) 2021
60-69 48.4 38.0 53% (+17)
70-79 29.3 38.2 56% (+11)
80+ 12.4 30.0 40% (+1-5) * Highest 7-day avg. following spring 2021 surge
¶ Total may not reflect state due to missing age data
Total¶ 538.9 49.5 43% (+106.3)
Note: Case information sourced from MDHHS and reflects date of onset of symptoms
Source: MDHHS – Michigan Disease Surveillance System
Public Health Other Science
National Comparison Spread 14
Response Indicators Round-upAverage daily new cases per million people by race and ethnicity
Daily new confirmed and probable cases per million Daily new confirmed and probable cases per
(7 day rolling average) by race category million (7 day rolling average) by ethnicity category
American Indian/Alaska Native Black/African American Hispanic or Latino Not Hispanic or Latino Race Case Rate
Asian/Pacific Islander White Hispanic/Latino 60.7
75 Race Case Rate 75 Non-Hispanic 44.5
American Indian/ 24.8
Alaskan Native
Asian/Pacific Islander 23.5
50 50
Black/African American 44.5
White 42.9
25 25
0 0
6/26 7/3 7/10 7/17 7/24 7/31 6/26 7/3 7/10 7/17 7/24 7/31
Updates since last week:
• Cases per million are increasing for all races and ethnicities
• Hispanics, Blacks/African Americans, and Whites have the highest case rates
• In the past 30 days, 17% (↑1%) of race data and 20% (↑1%) ethnicity data was either missing or reported as unknown
Note: Case information sourced from MDHHS and reflects date of death of confirmed and probable cases.
Source: MDHHS – Michigan Disease Surveillance System
Public Health Other Science
National Comparison Spread 15
Response Indicators Round-upCumulative COVID-19 Case Rates: Midwest Comparison
Michigan
• Cumulative incidence per 100,000 cases in Michigan has been lower than other states in the Midwest following spring 2020 surge
• Michigan’s mitigation policies helped control the spread of SARS-CoV-2 relative to other states in the Midwest, particular during surge in
November and December
• The current trajectory in Michigan continues to be in the range of cumulative case rates of our Midwest neighbors Source: CDC – COVID Data Tracker
Public Health Other Science
National Comparison Spread 16
Source: CDC COVID Data Tracker – State Trend Comparison Response Indicators Round-upCumulative COVID-19 Case Rates: States with high Delta Comparison
Michigan
• Average daily incidence per 100,000 cases in Michigan is currently lower than other states experiencing a surge in delta cases
Source: CDC COVID Data Tracker – State Trend Comparison
Public Health Other Science
National Comparison Spread 17
Response Indicators Round-upVariants, transmissibility, severity, and vaccine effectiveness
Strain New WHO Transmissibility Immune Invasiveness Increased Vaccine effective at
nomenclature Severity disease reduction?
Wild Type - - - ✓
B.1.1.7 Alpha ~50% increased transmission Increased hospitalizations ✓
- and death
B.1.351 Beta ~50% increased transmission Reduced susceptibility to antibody ✓
treatment -
P.1 Gamma Reduced susceptibility to antibody ✓
- treatment -
B.1.427/B.1.429 Epsilon ~20% increased transmissibility Modest decrease in susceptibility ✓
to monoclonal antibody treatment -
B.1.617.2 Delta > 50% increased transmission Reduced susceptibility to antibody Increased hospitalizations ✓
treatment and death
Source: CDC https://www.cdc.gov/coronavirus/2019-ncov/variants/variant-info.html?CDC_AA_refVal=https%3A%2F%2Fwww.cdc.gov%2Fcoronavirus%2F2019-ncov%2Fcases-updates%2Fvariant-
surveillance%2Fvariant-info.html World Health Organization, accessed June 8, 2021. https://www.who.int/en/activities/tracking-SARS-CoV-2-variants/
Public Health Other Science
National Comparison Spread 18
Response Indicators Round-upIdentified COVID-19 Cases Caused by All Variants of Concern (VOC)
in US and Michigan
SARS-CoV-2 Variants Circulating in the Variants of Concern in Michigan, Aug 3
United States, Jul 4 – Jul 17 (NOWCAST)
Note: The low number of
specimens recently
submitted for sequencing
limits the ability to
estimate the prevalence
of variants in Michigan
718 cases in Wayne attributed to Detroit
Variant MI Reported Cases¶ # of Counties CDC est. prevalence for MI
B.1.1.7 (alpha) 13,645* 81 NA
B.1.351 (beta) 85 24 NA
P.1 (gamma) 328 35 NA
Data last updated Aug 3, 2021 B.1.617.2 (delta) 233(↑145) 39 (↑13) NA
Source: https://covid.cdc.gov/covid-data-tracker/#variant-proportions and MDSS
* 534 cases within MDOC; 37 cases with county not yet determined
¶
Public Health Other Science
National Comparison Spread
Response Indicators Round-upIdentified COVID-19 Delta Variants by County Note: The low number of
specimens recently
Last week (Jul 27, 2021) This week (Aug 3, 2021) submitted for sequencing
limits the ability to
estimate the prevalence
of variants in Michigan
Data last updated Aug 3, 2021
Source: MDSS
Public Health Other Science
National Comparison Spread
Response Indicators Round-upNumber of outbreak investigations by site type, week ending Jul 29
Visibility1 Easier to identify outbreak
Site type Outbreaks by ongoing/new classification, # Harder to identify outbreak
Ongoing New Total
SNF/L T C/ O T HE R A SSIS T E D LIV ING 9 8 17 Total number of active
CHIL DCA R E/Y O U T H PRO G RA M 8 4 12 outbreaks is up 112% from
*SOCIA L GA THER IN G 8 3 11 previous week, with 42 new
MA NUF A CT UR IN G , CONS T R U CT IO N 3 5 8 outbreaks identified (21 more
*RES TA U RA N T S A ND BA RS 4 4 8 than last week)
HEA L T HCA R E 3 4 7
OFF ICE SET T IN G 4 2 6
SNF/LTC reported the greatest
*REL I G I O U S SERV I CE S 1 3 4
number of new outbreaks (8),
*SHEL T E RS 3 1 4
followed by manufacturing/
OTHER 1 2 3
3 construction (5), childcare/
A GRICU L T U RA L / F O O D PRO CE S S I NG 0 3
CORRE C T I O N S 2 1 3 youth programs, restaurants/
K- 12 SCHO O L 0 1 1 bars, and healthcare (4 each),
*CO MMU N IT Y EXPO S UR E - OUT DO O R 0 1 1 and nine other settings with at
COLL EG E/ U N IV E R S IT Y 1 0 1 least 1 new outbreak in the last
*PER S O NA L SERV IC E S 1 0 1 week.
*RETA IL 1 0 1
*CO MMU N IT Y EXPO S UR E - INDO O R 0 0 0
TO TA L 49 42 91
1. Based on a setting’s level of control and the extent of time patrons/residents spend in the particular setting, different settings have differing levels of ability to ascertain whether a case derived from that setting
NOTE: Many factors, including the lack of ability to conduct effective contact tracing in certain settings, may result in significant underreporting of outbreaks. This chart does not provide a complete picture of
outbreaks in Michigan and the absence of identified outbreaks in a particular setting in no way provides evidence that, in fact, that setting is not having outbreaks.
Source: LHD Weekly Sitreps
Public Health Other Science
National Comparison Spread 21
Response Indicators Round-upKey Messages: COVID-19 and Healthcare Capacity and COVID Severity
Hospitalizations and ICU utilization are plateaued or increasing
COVID-like illness (CLI) is 0.9% (up from 0.7% last week)
Hospital admissions are plateaued or increasing for most age groups
Hospitalizations up 38% since last week (vs. 27% increase week prior)
Seven regions are showing increasing trends in hospitalization trends this week
Hospitalization for COVID-19 is highest in Regions 2S and 7
Volume of COVID-19 patients in intensive care has increased 38% since last week (vs. 34% increase last week)
Death rate is 0.4 daily deaths per million people
Death rate has remained steady over the past week (vs. plateaued from last week)
95% decrease since April 24 peak
Proportion of deaths among those under 60 years of age has declined from the prior week
Public Health Other Science
National Comparison Spread
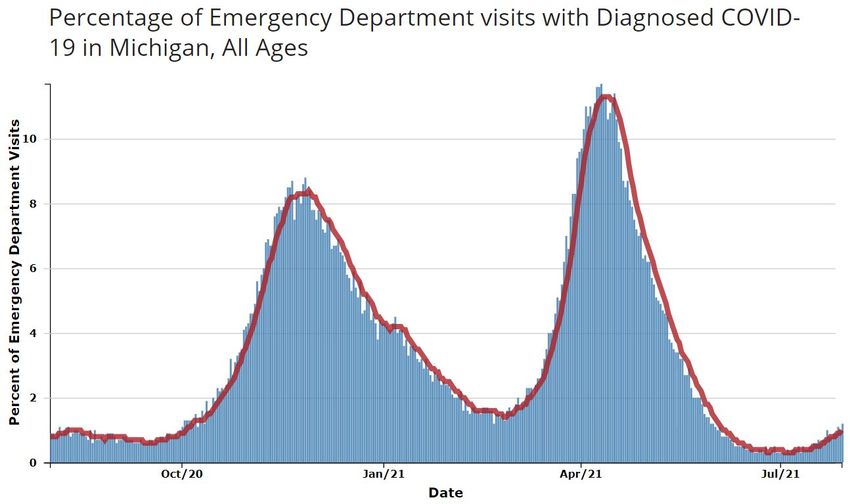
Response Indicators Round-upMichigan Trends in Emergency Department (ED) Visits for COVID-19-Like
Illness (CLI)
0.9%
• Trends for ED visits have increased to 0.9% since last week (up from 0.7% week prior)
• Trends vary by age groups with all age groups seeing an increase
• Over the past week, those 40-49 years have seen the highest number of avg. daily ED CLI visits, but those between 25 and 49 are all above the state average
Source: https://covid.cdc.gov/covid-data-tracker/#ed-visits
Public Health Other Science
National Comparison Spread
Response Indicators Round-upAverage Hospital Admissions by Age
15
10
5
0
6/20 6/23 6/26 6/29 7/2 7/5 7/8 7/11 7/14 7/17 7/20 7/23 7/26 7/29 8/1
Peds 18 - 19 20 - 29 30 - 39 40 - 49 50 - 59 60 - 69 70 - 79 80+ Age
Unkn
Source: CHECC & EM Resource
• Trends for daily average hospital admissions have increased 22% since last week (vs. 10% increase prior week)
• Trends within all age groups experiences increases in daily hospital admissions
• Over the past week, those 70-79 years have seen the highest number of avg. daily hospital admissions (9 admissions)
Public Health Other Science
National Comparison Spread 24
Response Indicators Round-upStatewide Hospitalization Trends: Total COVID+ Census
Hospitalization Trends 3/1/2021 – 8/3/2021 COVID+ census in hospitals has increased
Confirmed Positive & Persons Under Investigation (PUI) 38% from last week (previous week was
up 27%).
Confirmed Positive
Hospitalized COVID Positive Long Term
Trend (beginning March 2020)
PUI
25Statewide Hospitalization Trends: Regional COVID+ Census
All regions except for Region 8 show
Hospitalization Trends 3/1/2021 – 8/3/2021 increasing hospitalization trends this week.
Confirmed Positive by Region Region 7 showed a very large increase this
week.
Region 1
Region 2N
Region 2S 2 regions (Regions 2S and 7) are now at or
Region 3 above 50/M population hospitalized
Region 5
Region 6
Region 7 Region COVID+ COVID+
Region 8 Hospitalizations (% Δ Hospitalizations
from last week) / MM
Region 1 44 (52%) 41/M
Region 2N 98 (23%) 44/M
Region 2S 135 (36%) 61/M
Region 3 48 (33%) 42/M
Region 5 41 (41%) 43/M
Region 6 43 (43%) 29/M
Region 7 25 (150%) 50/M
Region 8 4 (0%) 13/M
26Statewide Hospitalization Trends: ICU COVID+ Census
Overall, the census of COVID+ patients in ICUs
Hospitalization Trends 3/1/2021 – 8/3/2021
has increased by 38% from last week.
Confirmed Positive in ICUs
4 regions (Regions 1, 2S, 5, 6) now have 5% or
greater of ICU beds occupied with COVID
patients.
Region Adult COVID+ in Adult ICU % of Adult ICU
ICU (% Δ from Occupancy beds COVID+
Confirmed last week)
Positive in ICU Region 1 9 (80%) 76% 5%
Region 2N 20 (11%) 72% 4%
Region 2S 33 (32%) 85% 5%
Region 3 9 (13%) 80% 3%
Region 5 13 (63%) 65% 7%
Region 6 17 (113%) 79% 7%
Region 7 6 (20%) 67% 3%
Region 8 2 (0%) 56% 3%
27Average and total new deaths, by age group
Daily confirmed and probable deaths per million by Total confirmed and probable deaths by age group
age group (7 day rolling average) (past 30 days, ending 7/27/2021)
0-19 40-49 70-79 • 25% of deaths below age
20-29 50-59 80+ sixty
30-39 60-69 Total
50
40 48
30 31 38
20
20
10 6 8
0 1-5
0
5/6 5/20 6/3 6/17 7/1 7/15 7/29 0-19 20-29 30-39 40-49 50-59 60-69 70-79 80+
• Overall trends for daily average deaths are steady since last week
• Through 7/27, the 7-day avg. death rate is below 1.0 daily deaths per million people for those under the age of 70
Note: Death information sourced from MDHHS and reflects date of death of confirmed and probable cases.
Source: MDHHS – Michigan Disease Surveillance System
Public Health Other Science
National Comparison Spread 28
Response Indicators Round-up30-day rolling average daily deaths per million people by race and
ethnicity
Average daily deaths per million people by race Average daily deaths per million people by
ethnicity
American Indian/Alaska Native Black/African American Hispanic or Latino Not Hispanic or Latino
20 White 10
Asian/Pacific Islander
8
15
6
10
4
5
2
0 0
5/6 5/20 6/3 6/17 7/1 7/15 7/29 5/6 5/20 6/3 6/17 7/1 7/15 7/29
• An additional review of vital records death data was performed the week of 6/30-7/6 to search for race and ethnicity
• This review has resulted in an adjustment of deaths for American Indian and Alaskan Natives from previous weeks
• Currently, Blacks/African American have the highest death rate
Note: Death information sourced from MDHHS and reflects date of death of confirmed and probable cases.
Source: MDHHS – Michigan Disease Surveillance System
Public Health Other Science
National Comparison Spread 29
Response Indicators Round-up• `
COVID-19 Vaccination
Administration (doses administered)
• 8th state in doses delivered; 12th in first doses provided and number of completed individuals 8/2/2021)
• 82.2% adjusted administration ratio (excluding federal entities, CDC channel portfolio 7/23/2021
• 41,150 first doses were administered week ending 7/31/21 (62,466 total): most administered frequently by
pharmacies, local health departments, and hospitals (MCIR data only, will be undercount of all doses
administered)
Coverage (people vaccinated)
• 64.4% of those 18+ have received first dose of vaccine; 85.9% of people aged 65 or older have had first dose
• 4,890,859 people in Michigan have completed vaccination series (4,858,654 last week)
• Initiation highest among Asian, Native Hawaiian or Pacific Islander and American Indian/Alaskan Native
individuals (MI COVID Vaccine Dashboard 8/3/21)
• Less than 1% of Vaccinated Individuals Later Tested Positive for COVID-19 (Number of cases who are fully
vaccinated (n= 9,504)
Public Health Other Science
National Comparison Spread
Response Indicators Round-up• `
Doses Administered as of 8/3/2021
12,051,770 doses delivered to providers and 9,828,892 doses administered (CDC tracker)
82.2% adjusted administration ratio (excluding federal entities, CDC channel portfolio 7/23/2021)
• 58,550 doses administered last week; on average 8.4K/day (3,352-10,870)
• 35,015 first doses administered last week; on average 5K/day (1,741-6,433)
July 25-July 31 (inclusive), doses were most frequently administered by
- Pharmacies (45.0K) (MCIR data may undercount)
- LHD (5.5K) and hospitals (3.5K)
- Pediatricians (927), family practice (2.5K), and FQHCs (2.4K)
Public Health Other Science
National Comparison Spread
Response Indicators Round-upOver 4.8 Million Michiganders fully vaccinated
4.89 million people in the state are fully Vaccination Coverage in Michigan as of 8/3/21
vaccinated
81.7% of people aged 65 and older have Age Group % At Least % Fully Number Fully
completed the series
One Dose Vaccinated Vaccinated
Race/Ethnicity for those 12 years and older:
Total Population 53.3 49.0 4,890,859
• Initiation coverage highest among those
of Non-Hispanic (NH) Asian, Native ≥ 12 years 61.9 56.9 4,890,768
Hawaiian or Pacific Islander Race
(52.4%), then NH American Indian ≥ 18 years 64.4 59.4 4,661,562
(48.5%), NH White (45.5%), NH Black
or African American Races (34.2%). ≥ 65 years 85.9 81.7 1,442,400
• Initiation is at 43.7% for those of
Hispanic ethnicity
• Completion follows the same pattern
• 21.0% data missing or unknown
Public Health Other Science
National Comparison Spread
Response Indicators Round-up`
Potential COVID-19 Vaccination Breakthrough Cases
Michigan part of CDC’s nationwide investigation (COVID-19 Breakthrough Case Investigations and Reporting | CDC)
Michigan Data (1/1/21 through 7/30/21):
• 9,504 cases met criteria based on a positive test 14 or more days after being fully vaccinated
• Less than 1% of people who were fully vaccinated met this case definition
• Includes 229 deaths (204 persons age 65 years or older)
• 622 cases were hospitalized
• Vaccine breakthrough cases are expected. COVID-19 vaccines are effective and are a critical tool to bring the pandemic
under control. However, no vaccines are 100% effective at preventing illness in vaccinated people. There will be a small
percentage of fully vaccinated people who still get sick, are hospitalized, or die from COVID-19.
• More than 163 million people in the United States have been fully vaccinated as of July 26, 2021. Like with other
vaccines, vaccine breakthrough cases will occur, even though the vaccines are working as expected. Asymptomatic
infections among vaccinated people will also occur.
• There is some evidence that vaccination may make illness less severe for those who are vaccinated and still get sick.
• Current data suggest that COVID-19 vaccines authorized for use in the United States offer protection against most
SARS-CoV-2 variants currently circulating in the United States. However, variants will cause some vaccine
breakthrough cases.
Public Health Other Science
National Comparison Spread
Response Indicators Round-upScience Round Up
• CDC updating guidance and urging vaccination
• Health Alert: urgent need to increase COVID-19 vaccination coverage across the United States to prevent surges in new infections that could
increase COVID-19 related morbidity and mortality, overwhelm healthcare capacity, and widen existing COVID-19-related health disparities.
• MMWR: Guidance for Implementing COVID-19 Prevention Strategies in the Context of Varying Community Transmission Levels and
Vaccination Coverage
• FDA revised EUA for REGEN-COV for post-exposure prophylaxis is a new tool for preventing severe COVID-19 outcomes
• Delta variant expected to increase cases in fall and will impact hospital capacity
• Events that congregate many people together (indoor or outdoor) for long periods of time can result in superspreading events
• Recently, Michigan has seen outbreaks related to fairs and festivals in summer 2021
• When outbreaks are identified, attendees are encouraged to get tested for COVID-19, regardless of vaccination status
• Rates of cases lower among people who are fully vaccinated
• As percent of the population that is vaccinated increases, the number of cases among fully vaccinated may be higher than the number among
those who are unvaccinated; this does not mean the effectiveness of vaccine has changed
Public Health Other Science
National Comparison Spread
Response Indicators Round-upCDC Health Alert Network Health Advisory (7/27/21)
Notifies public health practitioners and clinicians about urgent need to
increase COVID-19 vaccination coverage to prevent surges in new
infections that could increase morbidity and mortality, overwhelm
healthcare, and widen existing health disparities.
- COVID-19 vaccination is our most effective strategy to prevent
infection and severe disease.
- Vaccination coverage at skilled nursing facilities helps prevent
infection.
- Increasing coverage especially urgent in areas where current
coverage is low.
- Unvaccinated persons account for majority of new COVID-19
infections, hospitalizations, and deaths.
- Variants of concern, especially the highly infectious Delta variant, are
accelerating spread of infection.
- Unvaccinated and partially vaccinated people need to practice all
recommended prevention measures.
- In areas with substantial and high transmission, CDC recommends
fully vaccinated individuals wear a mask in public indoor settings.
Public Health Other Science
National Comparison Spread
Response Indicators Round-upCDC Guidance for Implementing COVID-19 Prevention Strategies in the
Context of Varying Community Transmission Levels and Vaccination
Coverage
• Until vaccination coverage is high and community transmission is low,
public health practitioners, as well as schools, businesses, and
institutions need to regularly assess the need for prevention strategies
to avoid stressing health care capacity and imperiling adequate care
for both COVID-19 and other non–COVID-19 conditions
• CDC recommends five critical factors be considered to inform local
decision making:
1) Level of SARS-CoV-2 community transmission
2) Health system capacity
3) COVID-19 vaccination coverage
4) Capacity for early detection of increases in COVID-19 cases
5) Populations at increased risk for severe outcomes from COVID-19
• Proven effective strategies against SARS-CoV-2 transmission,
beyond vaccination, include
1) Using masks consistently and correctly
2) Maximizing ventilation
3) Maintaining physical distance and avoiding crowds
4) Staying home when sick
5) Handwashing
6) Regular cleaning of high-touch surfaces
• To maximize protection of the community, prevention strategies
should be strengthened or added if transmission worsens.
• Prevention strategies should only be relaxed after several weeks
of continuous improvement in level of community transmission
Sources: Guidance for Implementing COVID-19 Prevention Strategies in the Context of Varying Community Transmission Levels and Vaccination Coverage
Public Health Other Science
National Comparison Spread
Response Indicators Round-upMONOCLONAL ANTIBODY POST EXPOSURE PROPHYLAXIS: FDA
revision of Emergency Use Authorization of REGEN-COV
The new authorization is for post-exposure prophylaxis use of REGEN-COV (casirivimab and imdevimab) in
individuals 12 years of age and older who are
- Are at high risk for progression to severe COVID-19 (including hospitalization or death), and
- Are not fully vaccinated or who are not expected to mount an adequate immune response to complete
SARS-CoV-2 vaccination, and
- Have been exposed to an individual infected with SARS-CoV-2 consistent with close contact criteria per CDC
or because of occurrence of COVID-19 infection in other individuals in the same institutional setting (for
example, nursing homes or prisons)
This new authorized use is in addition to the prior authorization of REGEN-COV to treat non-hospitalized
patients with mild to moderate COVID-19 in adult and pediatric patients, with positive results of direct SARS-
CoV-2 viral testing, and who are at high risk for progression to severe COVID 19.
REGEN-COV is expected to be effective against circulating variants, including the Delta variant.
Post-exposure prophylaxis with REGEN-COV is not a substitute for vaccination against COVID-19.
Additional information on monoclonal antibody therapy is available at www.michigan.gov/covidtherapy.
Public Health Other Science
National Comparison Spread
Response Indicators Round-upCDC model projections for
Michigan showing signs of
increase
• Ensemble model suggests slowly
increasing trends for cases and
deaths
• Uncertainty ranges from flat to
increasing and recent data has shown
increasing cases
• Individual models shown as grey lines, ensemble
shown in red
Data Sources: CDC mathematical model
forecasting, CovidComplete Data Center model
forecast evaluationsTotal projected
Modeling scenarios for Current vaccination &
social contact trends
deaths Aug-Nov:
3937 - 6177
Michigan: COVID surge Deaths observed
Mar-Jun: 4391
on the horizon
Spring surge
• If vaccination slowing and
increased social contact rates Median
continue, model simulations (dashed)
project a surge is likely,
Best-fit (solid)
potentially similar size to spring
• If contact rates return to low
levels and/or vaccinations Current vaccination rate, April vaccination rate,
increase to April uptake, the lower contact rate current contact rate
surge can be reduced/stopped Total projected deaths Total projected deaths
Aug-Nov: 433 Aug-Nov: 2430 - 2851
Model projections are scenarios rather than forecasts—actual
contact patterns may not reflect the projected scenarios.
Model calibrated to MDSS case data (through 7/16, as of
7/23), using mobility data (Unacast encounter rate), increased
transmission probability in June for the Delta variant.
Vaccination rates based on MCIR. Uncertainty: top 10% of
1000 parameter estimates.How do these cases translate to hospitalizations?
• Projected hospital admissions, based Age group Projected total
on the model simulations and fraction hospital admissions
of hospital admissions for different age Aug-Nov
groups over March-May 0-17 204 – 428
18-19 110 – 229
• These projections assume the same
age distribution of cases and 20-29 959 – 2007
hospitalizations as the spring surge 30-39 1217 – 2547
• Projected hospital admissions ranges 40-49 1463 – 3061
are based only on the best fit and 50-59 2256 – 4722
median simulations (not the full 60-69 2550 – 5336
uncertainty range) 70-79 2041 – 4271
80+ 1592 – 3331
Model calibrated to MDSS case data (through 7/16, as of 7/23), using Total 12,186 – 25,505
mobility data (Unacast encounter rate), increased transmission probability
in June for the Delta variant. Vaccination rates based on MCIR.
Uncertainty: top 10% of 1000 parameter estimates.Outbreaks related to festivals
78 cases in 25 counties to date
• Individuals infected with COVID-19 who attend fairs
and festivals can spread COVID-19.
• When cases are identified, attendees are encouraged
to get tested for COVID-19, regardless of vaccination
status. Information on testing is available at 16 cases to date
www.Michigan.gov/coronavirustest
• If you are in an outdoor crowded setting or
participating in activities with close contact with
others who are not fully vaccinated, CDC
recommends wearing a mask, particularly in areas
with high numbers of cases.
10 cases to date
Public Health Other Science
National Comparison Spread
Response Indicators Round-upUnderstanding breakthrough cases: When more people are
vaccinated, more cases will come from the vaccinated
population—even if the vaccine is working
Scenario 1: 50% Vaccinated Scenario 2: 90% Vaccinated
Unvaccinated
Unvaccinated
More cases are
25 vaccinated! But
More cases are the vaccine is 5
unvaccinated still working
9
5
Vaccinated
20 infections 36 infections
Vaccinated
stopped by stopped by
vaccination vaccination
Both Scenarios: Vaccine reduces disease by 80%, 2.5% infection level, 2000 total peopleUnderstanding breakthrough cases: as more people are
infected, there will be more cases among both vaccinated
and unvaccinated people
Scenario 2: 2.5% of unvaccinated people infected Scenario 3: 5% of unvaccinated people infected
5 10
Vaccine still More cases in
preventing both groups as More
80% of 9 36 transmission 72 infections
infection increases prevented by
18
vaccination—
the vaccine is
still working
equally well
Both Scenarios: 90% Vaccinated, Vaccine reduces disease by 80%, 2000 total peopleYou can also read