MI COVID response Data and modeling update - July 14, 2021 - State of ...
←
→
Page content transcription
If your browser does not render page correctly, please read the page content below
MI COVID response
Data and modeling update
July 14, 2021

NOTE: all data as of July 13 unless otherwise noted
Draft and pre-decisional
Executive summary
Percent Positivity (2.0%) is increasing for two weeks (up from 1.8% last week), and Case Rate (16.8 cases/million)
have increased for the first time in three months (up from 12.4 last week)

  Michigan has the 31st lowest number of cases (30th last week), and 15th lowest case rate (8th last week) in the last
  7 days (source: CDC COVID Data Tracker)

Percent of inpatient beds occupied by individuals with COVID has decreased 9% since last week and is decreasing
for eleven weeks. There are 1.3% inpatient beds occupied by COVID-19 patients.

  Michigan has the 9th lowest inpatient bed utilization (13th last week), and the 9th lowest adult ICU bed utilization
  (15th last week) in the country (source: US HHS Protect)

Deaths have decreased 40% since last week. There were 27 COVID deaths between Jun 30 and Jul 6, and the Death
Rate is 0.4 deaths per million residents.

  Michigan has the 40th lowest number of deaths (T21st last week), and T21st lowest death rate (T7th last week) in
  the last 7 days (source: CDC COVID Data Tracker)

The 7-day average state testing rate has decreased to 1,097.0 tests/million/day. Daily diagnostic tests (PCR) is 10.6K
per day, and the weekly average for PCR and antigen tests conducted in Michigan is 19.4K.

9.58 million COVID-19 vaccine doses reported to CDC, 4.79 million people have completed their vaccine series             2
Agenda
Status of COVID-19 Epidemiological Risk
State-by-state comparison of epidemic spread
Michigan epidemic spread
Public health response
Science round-up
3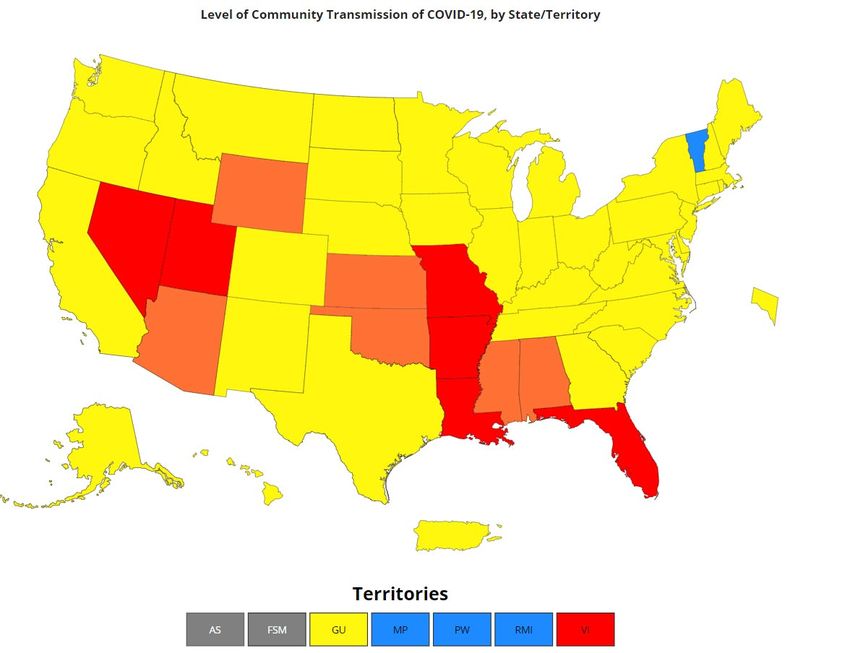
Global and National Comparisons
What we see today (data through 7/13):
• Globally, 187,722,824 cases and 4,047,669 deaths
• Countries with the highest number of cases are U.S. (33,911,823), India (30,907,282), and Brazil (19,151,993)
• Within the U.S., California (3,733,743), Texas (3,007,562), & Florida (2,376,643) lead the nation in total cases
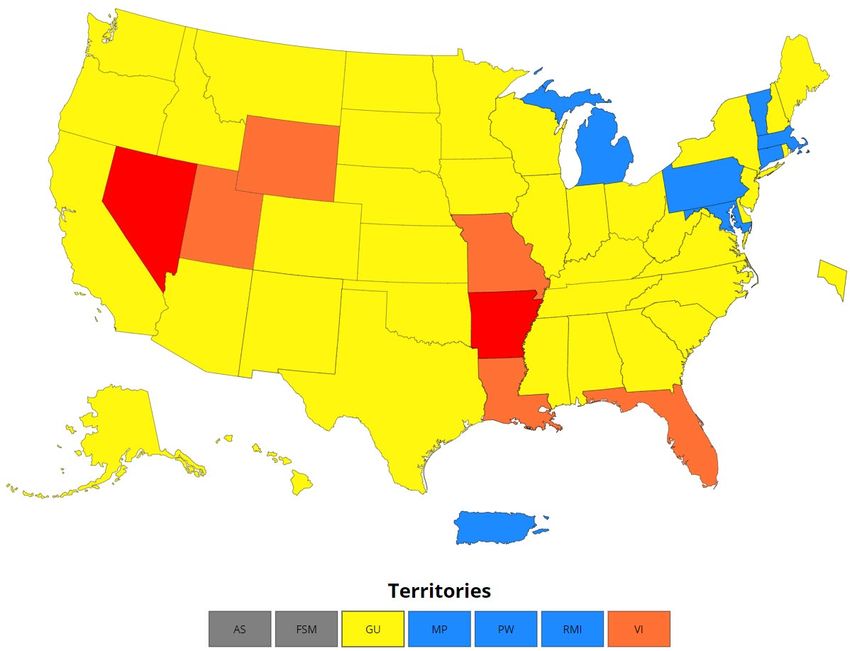
• CDC Data Tracker currently lists 4 states and territories at low transmission level which no longer includes MI
• Michigan currently has identified 13,464 variants of concern (VOC)*
– Cumulatively, the vast majority are B.1.1.7 (13,023 which is 97%).
• Other VOCs include B.1.351 (0.6%), P.1 (2.2%) and B.1.617.2(0.4%)
– In the 4 most recent weeks,
• 93.2% of specimens were Alpha (B.1.1.7)
• 0.5% were Beta (B.1.351)
• 3.8% were Gamma (P.1)
• 1.7% were Delta (B.1.617.2)
* CDC removed Episilon (B.1.427/B.1.429) from the lists of VOCs
Public Health Other Science
National Comparison Spread
Response Indicators Round-up
4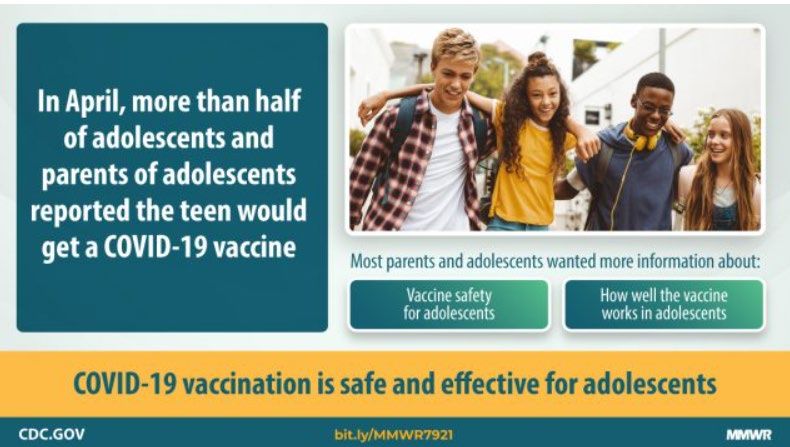
Key Messages: COVID-19 Spread
Statewide positivity has increased to 2.0% (last week: 1.8%)
•   One week percent change is up 14% (vs. up 36% last week)
•   Increasing for two weeks (up 63% since Jun 26 low)
•   Positivity is increasing in all MERC regions, but remains
Confirmed and probable case indicators                                                  Risk levels
Table Date: 7/13/2021 (7 days from date table was produced: 7/6/2021)         Low   A    B      C     D   E

 Cases                                              Positivity

    National                                Public Health          Other                 Science
                       Spread                                                                                 6
   Comparison                                Response            Indicators             Round-up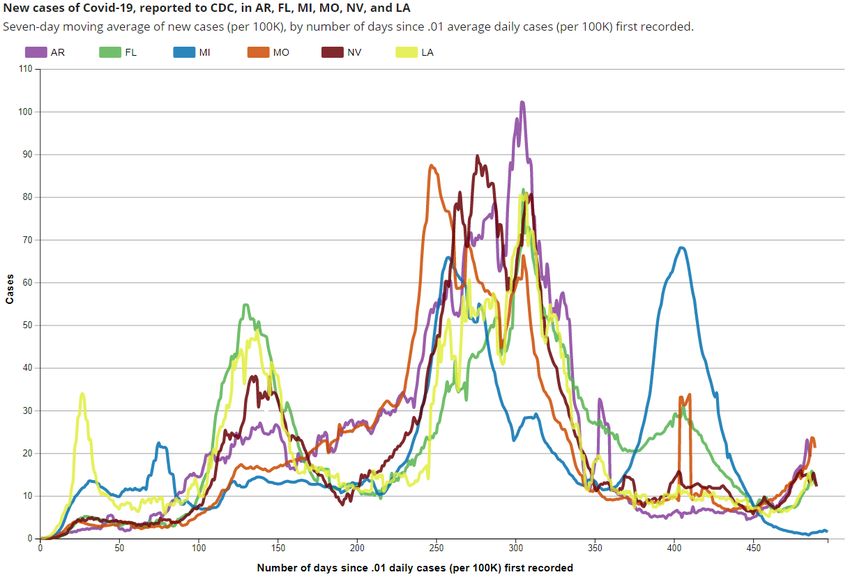
Percent Positivity and Case Rate Trends
                             MI Statewide Daily Positivity Test Rate                                 MI Statewide Daily Case Rate (per million)
 3%                                                                                      25

                                                                                         20
 2%
                                                                                         15

                                                                                         10
 1%
                                                                                          5

 0%                                                                                       0
       6/14                    6/21                6/28             7/5       7/12            6/14        6/21               6/28          7/5            7/12
                                Daily Positive Test Rate      7-Day Average                          Daily cases per million population   7-Day Average

 •      Positivity has been gradually increasing for the previous two weeks
 •      Case rates have been gradually increasing for the past week and half and backfill is expected in show future increases

     *Source: MDSS and MiStartMap.info

                                                                                Public Health                    Other                       Science
     National Comparison                                   Spread
                                                                                     Response                Indicators                    Round-up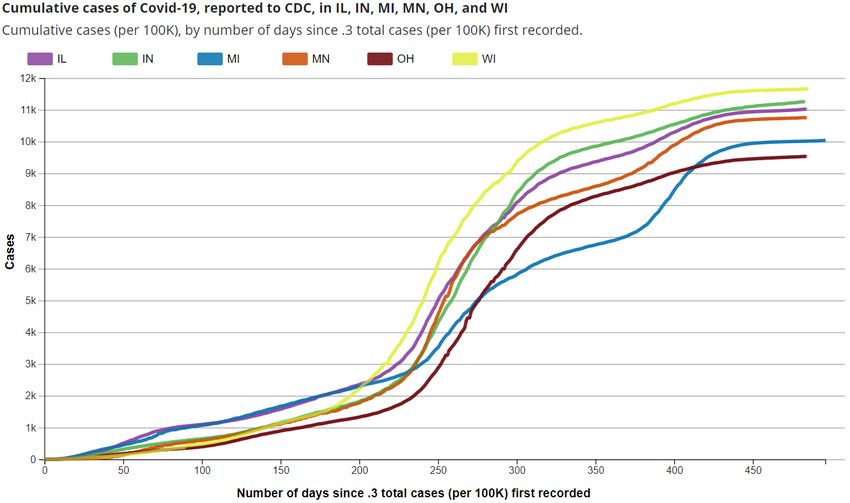
Overview of metrics for individuals
Comparing CDC community transmission thresholds to MI levels
Case Rate*†
       Low         A           B                            C                                                 D                                              E
MI*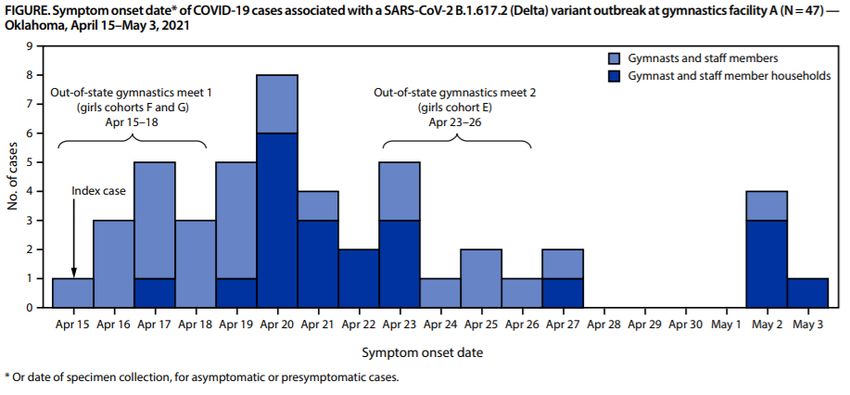
Adjusted* CDC Transmission Levels, 7/6-7/12
This Week, 7/6-7/12                                                                                                                                   Transmission                          # of counties                        This week
                                                                                                                                                                                                                                 Last week
                                                                                                                                                      Levels
                                                                                         Last week, 6/29-7/5                                                Low                                                      48
                                                                                                                                                                                                                            60
                                                                                                                                                                  Moderate                                     34
                                                                                                                                                                                                         23
                                                                                                                                                                  Substantial                 1
                                                                                                                                                                                              0
                                                                                                                                                                  High                        0
                                                                                                                                                                                              0

                                                                                                                                                      Updates since last week:
                                                                                                                                                      •     48 of 83 counties met low transmission
                                                                                                                                                            level this week, a 12 county decrease
                                                                                                                                                      •     34 of 83 counties met moderate
                                                                                                                                                            transmission classification, an 11 county
                                                                                                                                                            increase from last week
                                                                                                                                                      •     1 of 83 counties met substantial
                                                                                                                                                            transmission classification, a 1 county
                                                                                                                                                            increase from last week
*Source: SEOC Testing Results – Excluding MDOC; MDSS – Cases by onset date incorporating 7-day reporting lag; CDC Levels of Community Transmission are described at https://covid.cdc.gov/covid-data-tracker/#county-view

                                                                                                            Public Health                                      Other                                        Science
National Comparison                                           Spread                                                                                                                                                                10
                                                                                                              Response                                     Indicators                                     Round-up
Age group: average new daily cases
Daily new confirmed and probable cases per million by age group (7-day rolling average)
1000
0-9 30-39 60-69
10-19 40-49 70-79
20-29 50-59 80+
750
500
250
0
3/1 4/1 5/1 6/1 7/1 8/1 9/1 10/1 11/1 12/1 1/1 2/1 3/1 4/1 5/1 6/1 7/1
• Case rate trends for most age groups by decade are plateaued
• Case rates for all age groups are between 8 and 22 cases per million (through 7/6)
Note: Case information sourced from MDHHS and reflects date of onset of symptoms
Source: MDHHS – Michigan Disease Surveillance System
Public Health Other Science
National Comparison Spread 11
Response Indicators Round-upAge group: average new daily cases, last 30 days
Daily new confirmed and probable cases per million by age group (7-day rolling average)
40
0-9 30-39 60-69
10-19 40-49 70-79
20-29 50-59 80+
30
20
10
0
6/14 6/21 6/28 7/5 7/12
• Case rate trends for most age groups by decade are plateaued
• Case rates for all age groups are between 8 and 22 cases per million (through 7/6)
Note: Case information sourced from MDHHS and reflects date of onset of symptoms
Source: MDHHS – Michigan Disease Surveillance System
Public Health Other Science
National Comparison Spread 12
Response Indicators Round-upAge group: average new daily cases and daily case rate
Daily new confirmed and probable cases per million by age group (7-day rolling average)
Age Average Average One Week • Average daily number of cases (29) is
Group daily cases Daily Case % Change (Δ #) highest for those aged 20-29
Rate
• Avg. daily case rate (22.1 cases/mil) is
0-9 13.4 11.6 34% (+1-5) currently highest for 30-39
10-19 23.4 18.7 18% (+1-5) • Case rates for all age groups are
20-29 29.3 21.2 18% (+1-5) between 8 and 22 cases per million
30-39 26.9 22.1 27% (+6) • Case rate trends are no longer
40-49 24.0 20.3 5% (+1-5) decreasing and have entered a low
50-59 19.9 14.7 26% (+1-5) incidence plateau
60-69 15.1 11.9 -12% (-1-5) • Case rates bottomed out on June 26,
2021
70-79 6.3 8.2 -23% (-1-5)
80+ 5.1 12.4 -20% (-1-5) * Highest 7-day avg. following spring 2021 surge
¶ Total may not reflect state due to missing age data
Total¶ 168.3 16.8 15% (21.1)
Note: Case information sourced from MDHHS and reflects date of onset of symptoms
Source: MDHHS – Michigan Disease Surveillance System
Public Health Other Science
National Comparison Spread 13
Response Indicators Round-upAverage daily new cases per million people by race and ethnicity
Daily new confirmed and probable cases per million Daily new confirmed and probable cases per
(7 day rolling average) by race category million (7 day rolling average) by ethnicity category
American Indian/Alaska Native Black/African American Hispanic or Latino Not Hispanic or Latino
50 50
Asian/Pacific Islander White Race Case Rate
American Indian/ 9.3
40 Alaskan Native 40 Race Case Rate
Asian/Pacific 6.7 Hispanic/Latino 17.3
Islander
Non-Hispanic 13.9
30 30
Black/African 16.0
American
20 White 13.3 20
10 10
0 0
6/14 6/21 6/28 7/5 7/12 6/14 6/21 6/28 7/5 7/12
Updates since last week:
• Cases per million are plateaued for all races and ethnicities
• Blacks/African Americans, and Hispanic/Latinos have the highest case rates
• In the past 30 days, 16% (↔) of race data and 20% (↓1%) ethnicity data was either missing or reported as unknown
Note: Case information sourced from MDHHS and reflects date of death of confirmed and probable cases.
Source: MDHHS – Michigan Disease Surveillance System
Public Health Other Science
National Comparison Spread 14
Response Indicators Round-upCumulative COVID-19 Case Rates: Midwest Comparison
Michigan
• Cumulative incidence per 100,000 cases in Michigan has been lower than other states in the Midwest following spring 2020 surge
• Michigan’s mitigation policies helped control the spread of SARS-CoV-2 relative to other states in the Midwest, particular during surge in
November and December
• The current trajectory in Michigan continues to be in the range of cumulative case rates of our Midwest neighbors
Public Health Other Science
National Comparison Spread 15
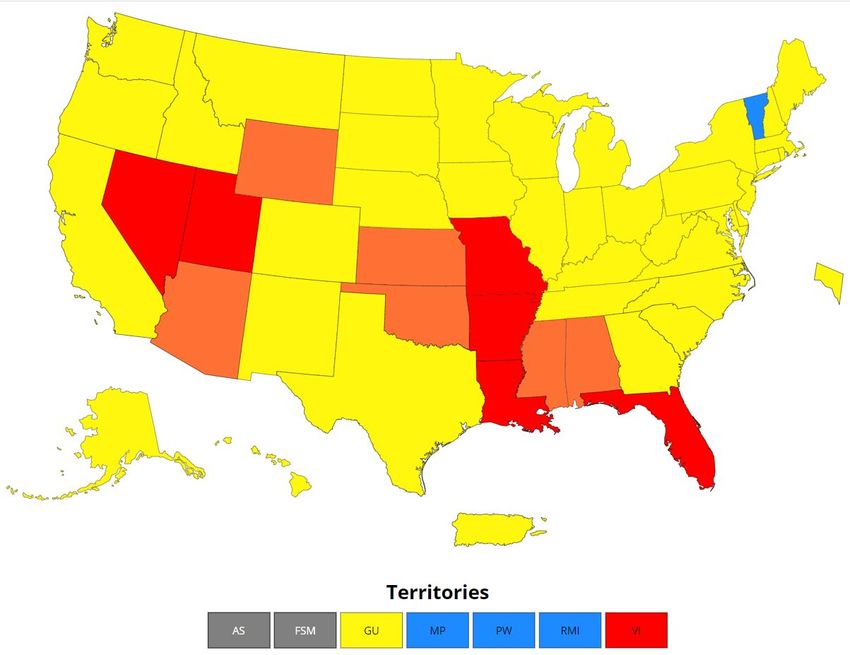
Source: CDC COVID Data Tracker – State Trend Comparison Response Indicators Round-upCDC Transmission Levels, U.S. state (data through 7/13/2020)
• Michigan is now at moderate transmission level
• 14.7 Case/100,000 population
•Cumulative COVID-19 Case Rates: States with high Delta Comparison
Michigan
• Average daily incidence per 100,000 cases in Michigan is currently lower than other states experiencing a surge in delta cases
Source: CDC COVID Data Tracker – State Trend Comparison
Public Health Other Science
National Comparison Spread 17
Response Indicators Round-upVariants, transmissibility, severity, and vaccine effectiveness
Strain New WHO Transmissibility Immune Invasiveness Increased Vaccine effective at
nomenclature Severity disease reduction?
Ancestral - - - ✓
B.1.1.7 Alpha ~50% increased transmission Increased hospitalizations ✓
- and death
B.1.351 Beta ~50% increased transmission Reduced susceptibility to antibody ✓
treatment -
P.1 Gamma Reduced susceptibility to antibody ✓
- treatment -
B.1.427/B.1.429 Epsilon ~20% increased transmissibility Modest decrease in susceptibility ✓
to monoclonal antibody treatment -
B.1.617.2 Delta > 50% increased transmission Reduced susceptibility to antibody Increased hospitalizations ✓
treatment and death
Source: CDC https://www.cdc.gov/coronavirus/2019-ncov/variants/variant-info.html?CDC_AA_refVal=https%3A%2F%2Fwww.cdc.gov%2Fcoronavirus%2F2019-ncov%2Fcases-updates%2Fvariant-
surveillance%2Fvariant-info.html World Health Organization, accessed June 8, 2021. https://www.who.int/en/activities/tracking-SARS-CoV-2-variants/
Certain mono-clonal antibody therapies are less effective in presence of some variants. Due to national increase in
P.1 and B.1.315 variant infections, HHS has paused distribution of bamlanivimab and etesevimab together and
etesevimab alone until further notice. FDA recommends health care providers use REGEN-COV.
Public Health Other Science
National Comparison Spread 18
Response Indicators Round-upIdentified COVID-19 Cases Caused by All Variants of Concern (VOC)
in US and Michigan
SARS-CoV-2 Variants Circulating in the Variants of Concern in Michigan, Jul 13
United States, Jun 6 – Jun 19
671 cases in Wayne attributed to Detroit
Variant MI Reported Cases¶ # of Counties CDC est. prevalence for MI
B.1.1.7 (alpha) 13,023* 81 NA
B.1.351 (beta) 78 23 NA
P.1 (gamma) 309 35 NA
Data last updated July 13, 2021 B.1.617.2 (delta) 54 16 NA
Source: https://covid.cdc.gov/covid-data-tracker/#variant-proportions and MDSS
* 533 cases within MDOC; 318 cases with county not yet determined
¶
Public Health Other Science
National Comparison Spread
Response Indicators Round-upNumber of outbreak investigations by site type, week ending Jul 8
Visibility1 Easier to identify outbreak
Site type Outbreaks by ongoing/new classification, # Harder to identify outbreak
Ongoing New Total
SNF/L T C/ O T HE R A SSIS T E D LIV ING 12 1 13 Total number of active
MA NUF A CT UR IN G , CONS T R U CT IO N 8 0 8 outbreaks is down 14% from
CHIL DCA R E/Y O U T H PRO G RA M 4 3 7 previous week, but 12 new
*RES TA U RA N T S A ND BA RS 0 4 4 outbreaks identified
OFF ICE SET T IN G 1 2 3
A GRICU L T U RA L / F O O D PRO CE S S I NG 3 0 3
Restaurants and bars reported
*RETA IL 2 1 3
the most number of new
HEA L T HCA R E 2 0 2
outbreaks (4), followed by
*SOCIA L GA THER IN G 1 1 2
childcare/youth programs
CORRE C T I O N S 1 0 1
1 0 1 (3),and office setting (2).
K- 12 SCHO O L
COLL EG E/ U N IV E R S IT Y 1 0 1
*CO MMU N IT Y EXPO S UR E - OUT DO O R 0 0 0 One new outbreak was
*CO MMU N IT Y EXPO S UR E - INDO O R 0 0 0 reported in each of the
*PER S O NA L SERV IC E S 0 0 0 following settings: LTCF/SNF,
OTHER 0 0 0 Retail, and social gatherings
*SHEL T E RS 0 0 0
*REL I G I O U S SERV I CE S 0 0 0
TO TA L 36 12 48
1. Based on a setting’s level of control and the extent of time patrons/residents spend in the particular setting, different settings have differing levels of ability to ascertain whether a case derived from that setting
NOTE: Many factors, including the lack of ability to conduct effective contact tracing in certain settings, may result in significant underreporting of outbreaks. This chart does not provide a complete picture of
outbreaks in Michigan and the absence of identified outbreaks in a particular setting in no way provides evidence that, in fact, that setting is not having outbreaks.
Source: LHD Weekly Sitreps
Public Health Other Science
National Comparison Spread 20
Response Indicators Round-upKey Messages: COVID-19 and Healthcare Capacity and COVID Severity
Hospitalizations and ICU utilization are plateaued
COVID-like illness (CLI) is steady 0.3% (vs. 0.3% last week)
Hospital admissions are plateaued statewide and for all age groups
Hospitalizations down 3% since last week (vs. 17% decline week prior)
Six regions are showing decreases or stable trends in hospitalization trends this week
— Region 2N has shown an increase over the previous week, which will be closely monitored
Volume of COVID-19 patients in intensive care has plateaued since last week (vs. 32% decline week prior)
Death rate has decreased to 0.4 daily deaths per million people
40% decrease since last week (vs. 51% decrease last week)
95% decrease since April 24 peak
Proportion of deaths among those under 60 years of age is stable from the prior week
Public Health Other Science
National Comparison Spread
Response Indicators Round-upMichigan Trends in Emergency Department Visits for COVID-19-Like
Illness (CLI)
0.3%
Source: https://covid.cdc.gov/covid-data-tracker/#ed-visits
Public Health Other Science
National Comparison Spread
Response Indicators Round-upAverage Hospital Admissions by Age
15
10
5
0
6/7 6/10 6/13 6/16 6/19 6/22 6/25 6/28 7/1 7/4 7/7 7/10 7/13
Peds 18 - 19 20 - 29 30 - 39 40 - 49 50 - 59 60 - 69 70 - 79 80+ Age
Unkn
Source: CHECC & EM Resource
• Trends for daily average hospital admissions have increased 4% since last week
• Trends within all age groups have plateaued
• Over the past week, those 50-59 years have seen the highest number of avg. daily hospital admissions (5 admissions)
Public Health Other Science
National Comparison Spread 23
Response Indicators Round-upStatewide Hospitalization Trends: Total COVID+ Census
Hospitalization Trends 3/1/2021 – 7/13/2021 COVID+ census in hospitals continues to
Confirmed Positive & Persons Under Investigation (PUI) decline although at a slower pace than in
prior weeks. This week is down only 3%
from the previous week (previous week was
down 17%).
Confirmed Positive
Hospitalized COVID Positive Long Term
Trend (beginning March 2020)
PUI
24Statewide Hospitalization Trends: Regional COVID+ Census
Six regions show decreasing or flat
Hospitalization Trends 3/1/2021 – 7/13/2021
hospitalization trends this week. Two regions
Confirmed Positive by Region
have increased from last week (Region 2N,
Region 7) although Region 7’s growth
Region 1
Region 2N represents only 1 incremental patient.
Region 2S
Region 3
Region 5
Region 2N bears watching.
Region 6
Region 7 Region COVID+ COVID+
Region 8 Hospitalizations (% Δ Hospitalizations
from last week) / MM
Region 1 14 (-7%) 13/M
Region 2N 52 (30%) 23/M
Region 2S 86 (-7%) 39/M
Region 3 14 (-22%) 12/M
Region 5 25 (0%) 26/M
Region 6 25 (-19%) 17/M
Region 7 5 (25%) 10/M
Region 8 0 0/M
25Statewide Hospitalization Trends: ICU COVID+ Census
Overall, volume of COVID+ patients in ICUs has
Hospitalization Trends 3/1/2021 – 7/13/2021 remained flat from last week, with 5 regions showing
Confirmed Positive in ICUs decreasing or flat trend. Regions 2N, 3, and 7 have
increased in the number of COVID+ patients in ICUs
since last week although numbers are very small in all
regions.
All regions haveAverage and total new deaths, by age group
Daily confirmed and probable deaths per million by Total confirmed and probable deaths by age group
age group (7 day rolling average) (past 30 days, ending 7/6/2021)
0-19 40-49 70-79 • 25% of deaths below age
20-29 50-59 80+ sixty 88
30-39 60-69 Total 77
50
64
40
47
30
20
15 10
10
1-5 1-5
0
4/15 4/29 5/13 5/27 6/10 6/24 7/8 0-19 20-29 30-39 40-49 50-59 60-69 70-79 80+
• Overall trends for daily average deaths have decreased 40% since last week
• Through 7/6, the 7-day avg. death rate is below 1.0 daily deaths per million people for those under the age of 80
Note: Death information sourced from MDHHS and reflects date of death of confirmed and probable cases.
Source: MDHHS – Michigan Disease Surveillance System
Public Health Other Science
National Comparison Spread 27
Response Indicators Round-up30-day rolling average daily deaths per million people by race and
ethnicity
Average daily deaths per million people by race Average daily deaths per million people by
ethnicity
American Indian/Alaska Native Black/African American Hispanic or Latino Not Hispanic or Latino
20 White 6
Asian/Pacific Islander
15
4
10
2
5
0 0
4/15 4/29 5/13 5/27 6/10 6/24 7/8 4/15 4/29 5/13 5/27 6/10 6/24 7/8
Updates since last week:
• An additional review of vital records death data was performed the week of 6/30-7/6 to search for race and ethnicity
• This review has resulted in an adjustment of deaths for American Indian and Alaskan Natives from previous weeks
• Currently, Blacks/African American have the highest death rate
Note: Death information sourced from MDHHS and reflects date of death of confirmed and probable cases.
Source: MDHHS – Michigan Disease Surveillance System
Public Health Other Science
National Comparison Spread 28
Response Indicators Round-up• `
COVID-19 Vaccination
Administration (doses administered)
10th state in doses delivered; 9th in first doses provided and number of completed individuals (7/12/21)
82.1% adjusted administration ratio (excluding federal entities, CDC channel portfolio 7/8/2021)
28,435 first doses were administered week ending 7/10/21 (62,542 total): most administered frequently by pharmacies, local
health departments, and hospitals (MCIR data only, will be undercount of all doses administered)
Coverage (people vaccinated)
63.1% of those 18+ have received first dose of vaccine
4,788,482 people in Michigan have completed vaccination series (4,728,832 last week)
85.1% of people aged 65 or older have had first dose; 63.1% of people over age 18
Initiation highest among Asian, Native Hawaiian or Pacific Islander and American Indian/Alaskan Native individuals (MI COVID
Vaccine Dashboard 7/13/21)
Less than 1% of Vaccinated Individuals Later Tested Positive for COVID-19 (Number of cases who are fully vaccinated (n= 7,658 )
Public Health Other Science
National Comparison Spread
Response Indicators Round-up• `
Doses Administered as of 7/12/2021
11,712,540 doses delivered to providers and 9,582,679 doses administered (CDC tracker)
82.1% adjusted administration ratio (excluding federal entities, CDC channel portfolio 7/8/2021)
• 62,542 doses administered last week; on average 8.9K/day (884-12,041)
• 28,435 first doses administered last week; on average 4,062/day (374-5,758)
July 3-July 10 (inclusive), doses were most frequently administered by
- Pharmacies (51.9K) (MCIR data may undercount)
- LHD (5.6K) and hospitals (2.3K)
- Pediatricians (971), family practice (2.1K), and FQHCs (2.1K)
Public Health Other Science
National Comparison Spread
Response Indicators Round-upNearly 4.8 Million Michiganders fully vaccinated
4.79 million people in the state are fully Vaccination Coverage in Michigan as of 7/13/21
vaccinated
81% of people aged 65 and older have Age Group % At Least % Fully Number Fully
completed the series
One Dose Vaccinated Vaccinated
Race/Ethnicity for those 12 years and older:
Total Population 52.1 47.9 4,788,482
• Initiation coverage highest among those
of Non-Hispanic (NH) Asian, Native ≥ 12 years 60.5 55.7 4,788,396
Hawaiian or Pacific Islander Race
(51.2%), then NH American Indian ≥ 18 years 63.1 58.4 4,578,134
(47%), NH White (44.4%), NH Black or
African American Races (32.5%). ≥ 65 years 85.1 81.0 1,429,523
• Initiation is at 42.1% for those of
Hispanic ethnicity
• Completion follows the same pattern
• 21.6% data missing or unknown
Public Health Other Science
National Comparison Spread
Response Indicators Round-up`
Potential COVID-19 Vaccination Breakthrough Cases
Michigan part of CDC’s nationwide investigation (COVID-19 Breakthrough Case Investigations and Reporting | CDC)
Michigan Data (1/1/21 through 7/6/21):
• 7,658 cases met criteria based on a positive test 14 or more days after being fully vaccinated
• Less than 1% of people who were fully vaccinated met this case definition
• Includes 205 deaths (185 persons age 65 years or older)
• 518 cases were hospitalized
• Vaccine breakthrough cases are expected. COVID-19 vaccines are effective and are a critical tool to bring the pandemic
under control. However, no vaccines are 100% effective at preventing illness in vaccinated people. There will be a small
percentage of fully vaccinated people who still get sick, are hospitalized, or die from COVID-19.
• More than 150 million people in the United States have been fully vaccinated as of June 21, 2021. Like with other
vaccines, vaccine breakthrough cases will occur, even though the vaccines are working as expected. Asymptomatic
infections among vaccinated people will also occur.
• There is some evidence that vaccination may make illness less severe for those who are vaccinated and still get sick.
• Current data suggest that COVID-19 vaccines authorized for use in the United States offer protection against most
SARS-CoV-2 variants currently circulating in the United States. However, variants will cause some vaccine
breakthrough cases.
Public Health Other Science
National Comparison Spread
Response Indicators Round-upScience Round Up
CDC Updates K-12 COVID-19 Mitigation Guidance
• Transmission in schools depends on many factors including transmission in schools, variants, and vaccination coverage
• Safely returning to in-person instruction is a priority
• Vaccination is leading public health prevention strategy
• Other mitigation measures also continued to be recommended (e.g., masking, physical distancing, testing, etc.)
Acceptability of Adolescent COVID-19 Vaccination
• More than half of unvaccinated adolescents and their parents reported intent for adolescent COVID-19 vaccination
• Education material directed toward adolescents and their families can further improve intention to vaccinate
SARS-CoV-2 B.1.617.2 (Delta) Variant COVID-19 Outbreak Associated with a Gymnastics Facility
• The Delta variant is highly transmissible in indoor sports settings
• 23% of all cases were < 12 years of age (cases as young as 5)
• Multicomponent prevention strategies including vaccination remain important to reduce the spread of SARS-CoV-2
Recent Press Releases on Vaccine Boosters amid concerns over B.1.617.2 (Delta) variant
• Currently, CDC and FDA indicate that Americans do not need for a booster vaccine at this time
Global COVID-19 Surges
• Internationally, many countries are experiencing another surge in cases attributed to the spread of the Delta variant
Public Health Other Science
National Comparison Spread
Response Indicators Round-upCDC Update to science brief on schools and early childhood education
Transmission in schools depends on 1) local transmission rates; 2) types of variants circulating; 3) epidemiology of
COVID-19 among children, adolescents, and staff; 4) vaccine coverage; and 5) mitigation measures in place.
Epidemiology of COVID-19 for pediatric population
• Estimated rates of COVID-19 infection and illness in children ages 5-17 years were comparable to rates for adults
ages 18-49 and higher than rates in adults ages 50 and older.
• Children and adolescents more commonly asymptomatic or have mild symptoms.
• Youth who belong to some racial and ethnic minority groups are disproportionately affected by severe events,
similar to adults.
Multiple studies have shown that transmission within school settings is typically lower than – or at least similar to –
levels of community transmission, when prevention strategies are in place in schools.
Significant secondary transmission of SARS-CoV-2 infection has occurred in school settings when prevention strategies
are not implemented or are not followed.
Science Brief: Transmission of SARS-CoV-2 in K-12 Schools and Early Care and Education Programs -
Updated | CDC
Public Health Other Science
National Comparison Spread
Response Indicators Round-upUpdate to CDC Guidelines for K-12 Schools and
Early Childhood Education programs: Take Aways
• Safely returning to in-person instruction is a • Students, teachers, and staff should stay home
priority. when they have signs of any infectious illness and
• Vaccination is leading public health prevention be referred to their healthcare provider for testing
strategy and care.
• Many schools serve children under the age of 12.
• Masks should be worn indoors by individuals (age Guidance emphasizes implementing layered
2 and older) who are not fully vaccinated. prevention strategies to protect people who are
• Schools recommended to maintain at least 3 feet not fully vaccinated.
of physical distance between students in
classrooms, combined with indoor mask wearing. • COVID-19 prevention strategies remain critical,
especially in areas of moderate-to-high
When not possible to maintain physical distance, community transmission levels.
it is especially important to layer multiple other
prevention strategies. • Localities should monitor community
transmission, vaccination coverage, screening
• Screening testing, ventilation, handwashing and testing, and occurrence of outbreaks to guide
respiratory etiquette, staying home when sick, decisions on the level of layered prevention
contact tracing with quarantine and isolation, and strategies.
cleaning and disinfection are also important
layers of prevention to keep schools safe. Guidance for COVID-19 Prevention in K-12 Schools | CDC
Public Health Other Science
National Comparison Spread
Response Indicators Round-upUpdate to CDC Guidelines for K-12 Schools and Early Childhood
Education programs
Guidance for COVID-19 Prevention in K-12 Schools | CDC
Schools and ECE programs can limit transmission by layering the following effective prevention strategies:
Promoting COVID-19 vaccination for those eligible
Consistent and correct use of masks by people who are not fully vaccinated
Physical distancing among people who are not fully vaccinated
Screening testing in K-12 schools
Improving ventilation
Handwashing and respiratory etiquette
Staying home when sick and getting tested
Testing and contact tracing in combination with isolation and quarantine
Routine cleaning with disinfection under certain conditions.
Public Health Other Science
National Comparison Spread
Response Indicators Round-upAcceptability of Adolescent
COVID-19 Vaccination
Surveys administered April 15–23 to U.S .
adolescents aged 13–17 years and parents of
U.S. adolescents aged 12–17 years using a
nonprobability–based, independently recruited
Internet panel.
52% of unvaccinated adolescents and 56% of
parents reported intent for adolescent COVID-
19 vaccination.
Receiving more information about adolescent
COVID-19 vaccine safety and efficacy would
increase vaccination intent.
53.1% of parents and 57.8% of adolescents
reported government agencies including CDC
and FDA as trusted sources of information, Source: Scherer AM, Gedlinske AM, Parker AM, et al. Acceptability of Adolescent COVID-19 Vaccination Among
followed by primary care professionals (47.3% Adolescents and Parents of Adolescents — United States, April 15–23, 2021. MMWR Morb Mortal Wkly Rep. ePub:
9 July 2021. DOI: http://dx.doi.org/10.15585/mmwr.mm7028e1external icon
and 45.7%), and state or local health officials
(46.6% and 49.4%, respectively)
Public Health Other Science
National Comparison Spread
Response Indicators Round-upMMWR Early Release: SARS-CoV-2 B.1.617.2 (Delta) Variant COVID-19 Outbreak
Associated with a Gymnastics Facility — Oklahoma
• Evidence suggests that the Delta (B.1.617.2)
variant is potentially more transmissible than other
variants
• The Delta variant is highly transmissible in indoor
sports settings, including non-contact sports, and
households
• Among those infected were children as young as 5
• 23% of all cases were < 12 years of age
(ineligible for vaccination)
• This outbreak required hospitalizations for two
individuals (both unvaccinated)
• Multicomponent prevention strategies including
vaccination remain important to reduce the spread
of SARS-CoV-2
SARS-CoV-2 B.1.617.2 (Delta) Variant COVID-19 Outbreak Associated with a Gymnastics Facility — Oklahoma, April–May 2021. https://www.cdc.gov/mmwr/volumes/70/wr/mm7028e2.htm
Public Health Other Science
National Comparison Spread
Response Indicators Round-upRecent Press Releases on Vaccine Boosters amid concerns over
B.1.617.2 (Delta) variant
• Only July 8, 2021 Pfizer/BioNTech announced that
the company will be looking develop a booster for
their SARS-CoV-2 mRNA vaccine
• The company reasons that antibody titers may
improve after 6 months and were seen in ancestral
(wild type) and B.1.351 (beta) variants
• CDC and FDA, however, issued a joint
statement on the very same day indicating that,
given the current data, no booster vaccine is
needed
• To ensure messaging remains clear and consistent,
public health leaders and industry will work to unify
communications
• It is fortunate that pharmaceutical companies are
prepared and ready to examine the need for a
booster vaccine
Source: Pfizer and BioNTech Press Release and CDC/FDA Joint Statement
Public Health Other Science
National Comparison Spread
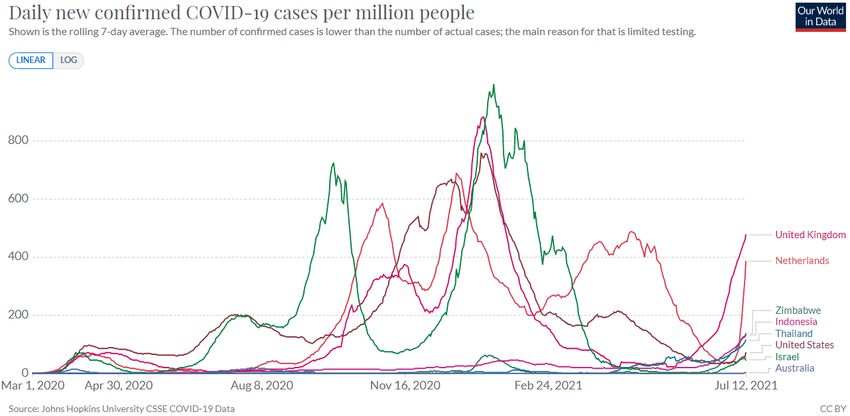
Response Indicators Round-upNext Wave of Global COVID-19 Surges
• Delta (B.1.617.2) is highly transmissible
• Internationally, many countries are
experiencing another surge in cases, including
countries that previously had been able to
mitigate spread
• The surge in the United Kingdom and
Netherlands is particularly concerning given
the rapid rise in case rates over a short period
of time
• Given the low population vaccination coverage
throughout the United States, another surge is
inevitable
• Multicomponent prevention strategies including
vaccination remain important to reduce spread
of SARS-CoV-2
Source: Pfizer and BioNTech Press Release and CDC/FDA Joint Statement
Public Health Other Science
National Comparison Spread
Response Indicators Round-upYou can also read