MI COVID response Data and modeling update - May 4, 2021
←
→
Page content transcription
If your browser does not render page correctly, please read the page content below
MI COVID response
Data and modeling update
May 4, 2021

NOTE: all data as of May 1 unless otherwise noted

Executive summary
Percent Positivity is down 11% and Case Rate is down 30% since mid-April highs. Positivity (12.6%, ↓1.5%) and case
rates (397.8, ↓157.2) have decreased for three weeks

  Michigan has the 2nd highest number of cases (↔), and highest case rate (↔) in the last 7 days (source: CDC
  COVID Data Tracker)

Percent of inpatient beds occupied by individuals with COVID has decreased 20% since the April 20 high to 15.9%
(↓3.1%). Trends for COVID hospitalizations are decreasing for 1 week

  Michigan has the highest inpatient bed utilization (↔), and the highest adult ICU bed utilization (↑1) (source: US
  HHS Protect)

Deaths have increased 371% since Mar 9 low. There were 452 (↑37) between April 18 and April 24, and the Death Rate
is 6.5 deaths per million residents (↑1.0)

  Michigan has the 5th highest number of deaths (↔), and 2nd highest death rate (↔) in the last 7 days (source: CDC
  COVID Data Tracker)

The 7-day average state testing rate has decreased to 3,662.0 tests/million/day (↓522.3). Daily diagnostic tests (PCR)
is 36.4K per day (↓6.1), and the weekly average for PCR and antigen tests conducted in Michigan is 66.6K (↓2.0K).

7.0 million COVID-19 vaccine doses reported to MDHHS, 50.6% of Michigan population 16+ has at least one dose
Comparison across states: Summary
What we see today (data through 5/1):
• 5 states are seeing increasing 1 week case trends (>=10%) (same as last week)
• 14 states are seeing 1 week increases (>=10%) in new COVID hospital admissions (up vs. 12
  last week)
• Michigan, DC, Pennsylvania, Maryland and Delaware have highest per capita hospitalized
  patient numbers.
• Midwest (case data from CDC as of 5/2):
   –   Wisconsin with slight decrease in hospitalizations (66/M) and stable cases (88/100k last 7d)
   –   Indiana with stable hospitalizations (124/M), and slight increase in cases (117/100k last 7d)
   –   Illinois showing slight decrease in hospitalizations (155/M), and stable cases (148/100k last 7d)
   –   Ohio with decrease in hospitalizations (129/M) and slight decrease in cases (92/100k last 7d)
   –   Michigan showing decrease in hospitalizations (303/M) and decrease in cases (252/100k last 7d)

                                                                                                           3
COVID-19 Spread
Statewide positivity has decreased to 12.6%
• One week decrease of 11% (vs. 14% decrease last week)
• Decreasing for three weeks (32% decrease since April 8 high)
• Positivity is declining in all MERC regions but remains above 10% in seven regions
• Saginaw remains above 15%
Case rates (397.8 cases/million) are decreasing in the state (555.0 cases/million last week)
• One week decrease of 30% (vs. 14% decrease last week)
• Decreasing for three weeks (40% decrease since April 11 high)
• Cases per million are declining in all MERC regions
• Variants in Michigan: 6,857 confirmed B.1.1.7; 38 confirmed B.1.351; 249 confirmed B.1.427/B.1.429 ; 88 confirmed P.1
Number of active outbreaks is up 2% from previous week
— There were 311 outbreaks in K-12 school settings
— In the past week, the highest number of new clusters have been identified in baseball/softball, volleyball, lacrosse,
soccer, and track and field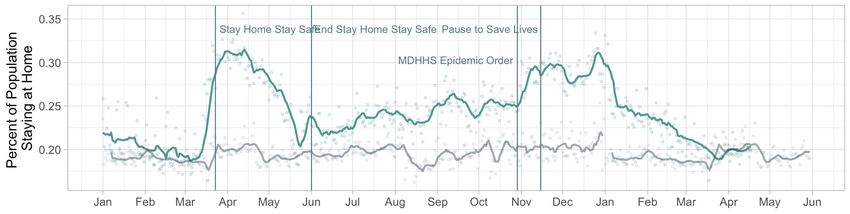
Confirmed and probable case indicators                                            Risk levels
Table Date: 5/1/2021 (7 days from date table was produced: 4/24/2021)   Low   A    B      C     D   E

 Cases                                             Positivity
Statewide Positivity Trends
Daily positivity and 7-day rolling average positivity for Michigan
    0.7
                                                                                                                                    7-day average         Daily values
    0.6

    0.5

    0.4

    0.3

    0.2

    0.1

      0
          3/1           4/1             5/1             6/1            7/1             8/1   9/1   10/1   11/1   12/1   1/1   2/1    3/1            4/1            5/1

•      Early in the pandemic, testing was not as robust as it has been since July 2020 to present
•      Positivity is an indicator of whether we are testing enough to identify cases and an early indicator of SARS-CoV-2
       transmission (as positivity increases, we expect case rates to follow)
•      Positivity decreased by 11% between this week and last
•      Note: These are for PCR tests only and exclude tests conducted with Michigan Department of Corrections
    Note: Case information sourced from MDHHS and reflects date of onset of symptoms
    Source: MDHHS – Michigan Disease Surveillance System
Positivity by county, 4/23-4/29
                                                Average            # of counties                This week
                                                positivity per day                              Last week

                                                      =20%             5
                                                                            8

                                                Updates since last week:
                                                64 of 83 counties saw double digit positivity
                                                in the last week (3 county decrease)
                                                70 of 83 counties saw positivity > 7% in the
                                                last week (steady)

Source: SEOC Testing Results – Excluding MDOC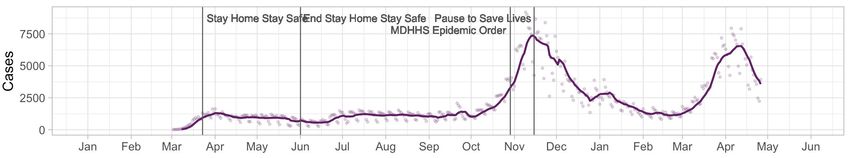
COVID-19 cases by onset date: State of Michigan

            Cumulative confirmed and probable cases, by date of                                                           New confirmed and probable cases, by date of
            onset of symptoms                                                                                             onset of symptoms
              1000000                                                                                                       10000

                750000                                                                                                        7500

                500000                                                                                                        5000

                250000                                                                                                        2500

                         0                                                                                                         0
                             3/1        5/1         7/1         9/1        11/1         1/1         3/1         5/1                    3/1         5/1         7/1          9/1         11/1          1/1         3/1          5/1

Updates since last week:
•     Cases have decreased for three weeks
•     Statewide case rate is at risk level E (above 150 cases/million)
•     There are nearly 4,000 new cases per day (data through 4/24) which is down 1,500 from the prior week
•     Almost 950,000 cases since Mar 1, 2020
Note: Case information sourced from MDHHS and reflects date of onset of symptoms (refers to lab-confirmed cases). Case spike on 5/12 is a result of batch of test results, not all of which have onset date of symptoms completed
Source: MDHHS – Michigan Disease Surveillance System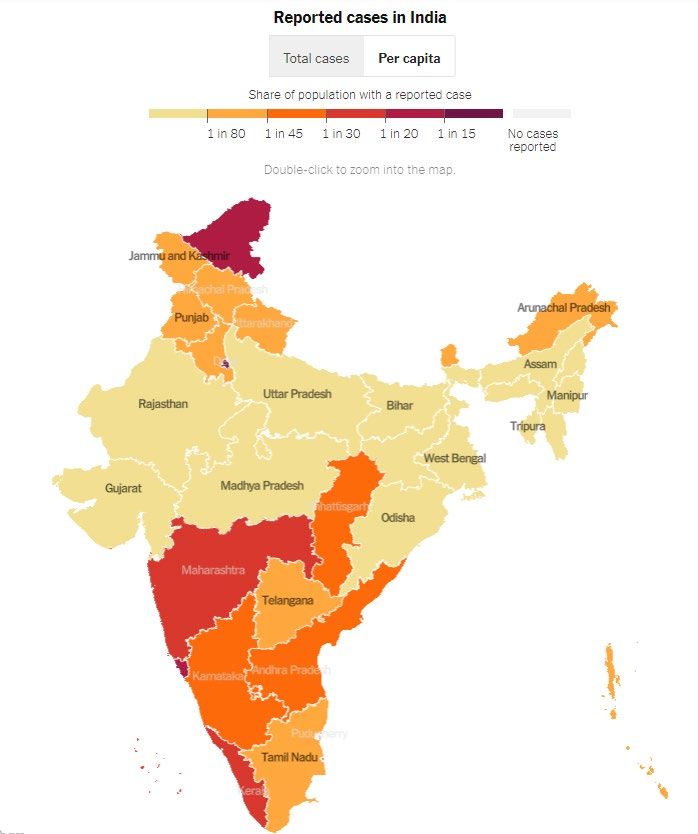
Cumulative COVID-19 Case Rates: Midwest Comparison + PA
                                    12000

                                    10000
                                                                                                                                                   Michigan
                                     8000

                                     6000

                                     4000

                                     2000

                                          0
                                              3/15      4/15    5/15   6/15   7/15   8/15   9/15   10/15 11/15 12/15   1/15   2/15   3/15   4/15
                                                     Illinois    Indiana      Michigan      Minnesota    Ohio     Pennsylvania       Wisconsin

•    Cumulative incidence per 100,000 cases in Michigan has been lower than other states in the Midwest following spring 2020 surge
•    Michigan’s mitigation policies helped control the spread of SARS-CoV-2 relative to other states in the Midwest, particular during surge in
     November and December
•    The current trajectory in Michigan has brought us into the range of cumulative case rates of our Midwest neighbors

Source: CDC COVID Data Tracker – State Trend Comparison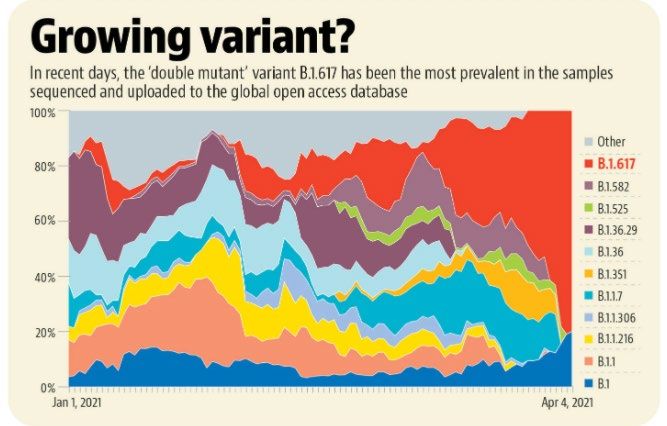
Age group: average new daily cases
Daily new confirmed and probable cases per million by age group (7-day rolling average)

                                   0-9                 30-39               60-69
    1000                           10-19               40-49               70-79
                                   20-29               50-59               80+

     750

     500

     250

         0
             3/1           4/1             5/1            6/1             7/1          8/1   9/1   10/1   11/1   12/1   1/1   2/1   3/1   4/1   5/1

•      All age groups by decade are now decreasing
•      Those aged 10-19 have the highest case rates, followed by 20-29 and 30-39 age groups
•      Case rates for all age groups are near or above 150 cases per million (Risk Level E)
    Note: Case information sourced from MDHHS and reflects date of onset of symptoms
    Source: MDHHS – Michigan Disease Surveillance System
Age group: average new daily cases and daily case rate
Daily new confirmed and probable cases per million by age group (7-day rolling average)
Age Average Average One Week % Change since
Group daily cases Daily Case % Change (Δ #) 4/11/21* (Δ #)
Rate
0-9 331.4 287.5 -21% (-87) -23% (-98)
10-19 740.9 590.4 -30% (-322) -39% (-466)
20-29 726.4 526.6 -29% (-302) -40% (-491)
30-39 620.1 511.2 -31% (-275) -41% (-434)
40-49 540.3 458.1 -30% (-233) -43% (-400)
50-59 482.4 357.3 -33% (-236) -45% (-398)
60-69 313.4 245.7 -29% (-126) -40% (-207)
70-79 132.9 173.3 -27% (-49) -33% (-64)
80+ 61.9 149.3 -26% (-22) -29% (-25)
* Highest 7-day avg. following spring 2021 surge
Total¶ 3,977.4 397.8 -29% (-1,656) -40% (-2,594) ¶ Total may not reflect state due to missing age data
• Daily number of cases (740.9) and daily case rate (590.4 cases/mil) are currently highest for those 10-19
• All age groups under 70 are experiencing an average of more than 300 cases per day
• Since April 11, case rate decreases and number of cases have been highest among those between the ages 10 to 69
Note: Case information sourced from MDHHS and reflects date of onset of symptoms
Source: MDHHS – Michigan Disease Surveillance SystemAverage daily new cases per million people by race and ethnicity
Daily new confirmed and probable cases per million Daily new confirmed and probable cases per
(7 day rolling average) by race category million (7 day rolling average) by ethnicity category
600 American Indian/Alaska Native Black/African American Hispanic or Latino Not Hispanic or Latino
600
Asian/Pacific Islander White
400 400
200 200
0 0
2/1 2/15 3/1 3/15 3/29 4/12 4/26 2/1 2/15 3/1 3/15 3/29 4/12 4/26
Updates since last week:
• Cases per million are decreasing for all races and ethnicities
• Blacks and Hispanic/Latinos continue to have the highest case rates
• In the past 30 days, 36% of all cases represent unknown, multiple, or other races (30% of race is unknown, ↓1%)
• In the past 30 days, 34% of all cases have an unknown ethnicity reported (↓1%)
Note: Case information sourced from MDHHS and reflects date of death of confirmed and probable cases.
Source: MDHHS – Michigan Disease Surveillance SystemIdentified COVID-19 Cases Caused by All Variants of Concern
in US and Michigan
SARS-CoV-2 Variants Circulating in the Emergent Variants of Cases in Michigan, May 1
United States, Mar 28 – Apr 10 .
229 cases in Wayne attributed to Detroit
Variant MI Reported Cases¶ # of Counties CDC est. prevalence
B.1.1.7 6,857* 70 69.9%
B.1.351 38 18 0.3%
B.1.427/B.1.429 249 39 4.1%
P.1 88 19 1.1%
Data last updated May 01, 2021 * 519 cases within MDOC; ¶ Numerous cases with county not yet determined
Source: https://covid.cdc.gov/covid-data-tracker/#variant-proportions and Michigan Disease Surveillance System (MDSS)Number of outbreak investigations by site type, week ending Apr 29
Easier to identify outbreak
Pr e - d ecision al, f o r d iscussion o nly Dr af t Harder to identify outbreak
Site type Outbreaks by ongoing/new classification, # Visibility1 Total number of active
Ongoing New Total outbreaks is about the same
from previous week
K- 12 SCHO O L 238 73 311
MA NUF A CT UR IN G , CONS T R U CT IO N 232 26 258
172 26 198 Following K-12 (73), the
SNF/L T C/ O T HE R A SSIS T E D LIV ING
*RETA IL 115 11 126 greatest number of new
CHIL DCA R E/Y O U T H PRO G RA M 53 28 81 outbreaks were reported in
*RES TA U RA N T S A ND BA RS 68 12 80 childcare/youth programs (28),
OFF ICE SET T IN G 62 10 72 manufacturing/construction
*SOCIA L GA THER IN G 23 7 30 (26), SNF/LTC (26), bars &
HEA L T HCA R E 26 4 30 restaurants (12), retail (11),
OTHER 20 5 25 and office settings (10).
A GRICU L T U RA L / F O O D PRO CE S S I NG 17 1 18
COLL EG E/ U N IV E R S IT Y 18 0 18 LHDs reported new outbreaks
*REL I G I O U S SERV I CE S 13 4 17 in all settings except in College
CORRE C T I O N S 13 3 16 and Universities, Shelters, and
*PER S O NA L SERV IC E S 4 2 6 both Indoor and Outdoor
*SHEL T E RS 5 0 5 Community Exposures.
*CO MMU N IT Y EXPO S UR E - OUT DO O R 1 0 1
*CO MMU N IT Y EXPO S UR E - INDO O R 1 0 1
TO TA L 1081 212 1293
1. Based on a setting’s level of control and the extent of time patrons/residents spend in the particular setting, different settings have differing levels of ability to ascertain whether a case derived from that setting
NOTE: Many factors, including the lack of ability to conduct effective contact tracing in certain settings, may result in significant underreporting of outbreaks. This chart does not provide a complete picture of
outbreaks in Michigan and the absence of identified outbreaks in a particular setting in no way provides evidence that, in fact, that setting is not having outbreaks.
Source: LHD Weekly SitrepsK-12 school outbreaks, recent and ongoing, week ending Apr 29
There were 311 outbreaks in K-12 school settings, including 134 outbreaks in High Schools (↓), 109 outbreaks in Pre-K – Elementary (↑), 63
outbreaks in Middle/Jr High (↓), and 5 outbreaks in the Administrative settings (↑).
Number of Range of cases
Region Number of reported cases, # # Ongoing - Excluding New # New outbreaks per outbreak
Region 1 632 45 85 2-47
Region 2n 102 93 66 2-14
Region 2s 62 12 15 2-15
Region 3 501 26 56 2-51
Region 5 132 30 25 2-41
Region 6 267 13 26 2-46
Region 7 182 15 30 2-25
Region 8 39 14 8 2-19
Total 1,917 248 311 2-51
Number of Range of cases
Grade level Number of reported cases, # # Ongoing - Excluding New # New outbreaks per outbreak
Pre-school - elem. 354 121 109 2-23
Jr. high/middle school 299 52 63 2-23
High school 1,255 74 134 2-51
Administrative 9 1 5 2-3
Total 1,917 248 311 2-51
Many factors, including the lack of ability to conduct effective contact tracing in certain settings, may result in significant underreporting of outbreaks. This chart does not provide a complete picture
of outbreaks in Michigan and the absence of identified outbreaks in a particular setting in no way provides evidence that, in fact, that setting is not having outbreaks.
Source: LHD Weekly SitrepsCOVID-19 K-12 Sports Related Clusters and Cases
Cumulative Since Jan 2021 through Apr 2021
488 cases 351 cases 280 cases 108 cases 44 cases 43 cases 43 cases
123 clusters 56 clusters 72 clusters 23 clusters 4 clusters 24 clusters 13 clusters
33 cases 19 cases 17 cases 15 cases 14 cases 11 cases 27 cases
8 clusters 10 clusters 9 clusters 7 clusters 3 clusters 8 clusters 16 clusters
• Cases identified by local public health which include school-affiliated and club/travel/regional sports (spectators,
collegiate, and professional sports as well as secondary cases to collegiate/professional sports are excluded)
• Since January 2021, basketball, hockey, and wrestling have had the highest number of cases and clusters
• Largest number of new clusters identified in spring sports of baseball/softball, volleyball, lacrosse, soccer, and track
• Cases and clusters have occurred in 24 different sport settings
Source: MDHHS – Michigan Disease Surveillance SystemCOVID-19 and Healthcare Capacity and COVID Severity Multisystem Inflammatory Syndrome in Children (MIS -C) has been identified in 106 children in Michigan • Majority of cases are male, between the ages of 5-10, Caucasian, and non-Hispanic/Latino Hospitalizations and ICU utilization are decreasing COVID-like illness (CLI) has fallen to 6.4% (vs. 7.6% last week) Overall hospital admissions are decreasing but trends vary by age group — Since last week, those under 29 years are increasing — Since April peak, peds have increased 40% Hospitalizations down 19% since last week (vs. 16% decline week prior) All regions are showing some level of decline in hospitalization trends this week Volume of COVID-19 patients in intensive care (ICU) has decreased 10% since last week (vs. 5% decline week prior) Death rate has increased to 6.5 daily deaths per million people Deaths are a lagging indicator of cases and hospitalization 371% increase since the March 9 low Proportion of deaths among those under 60 years of age is increasing
Multisystem Inflammatory Syndrome in Children (MIS -C)

Source: MDHHS – Michigan Disease Surveillance System and Michigan.gov/coronavirus dashboard
Michigan Trends in Emergency Department Visits for COVID-19-Like
Illness (CLI)

                                                                                         6.4%

                                            Source: https://covid.cdc.gov/covid-data-tracker/#ed-visits
Average Hospital Admissions by Age
Confirmed COVID-19 Hospital Admissions by Age Group - Statewide Rolling Weekly Average
Age Daily Avg One Week % % Change
130 Group Adm. Change (#) since 4/14*
120 (#)
110
Peds 10.4 9% (0.9) 40% (3.0)
100
90 18-19 2.1 25% (0.4) -56% (-2.7)
80
20-29 28.1 8% (2.0) -17% (-5.6)
70
60 30-39 35.7 -12% (-4.9) -26% (-12.7)
50 40-49 44.0 -17% (-9.1) -43% (-33.4)
40
30 50-59 74.7 -23% (-21.4) -36% (-41.7)
20 60-69 80.9 -29% (-31.3) -40% (-50.9)
10
0 70-79 62.3 -25% (-19.7) -32% (-27.3)
3/28 3/31 4/3 4/6 4/9 4/12 4/15 4/18 4/21 4/24 4/27 4/30 80+ 44.0 -12% (-6.0) -28% (-16.7)
Peds 18 - 19 20 - 29 30 - 39 40 - 49 Total¶ 389.1 -19% (-93) -35% (-212)
50 - 59 60 - 69 70 - 79 80+ Age * Highest 7-day avg. hosp. adm. following Spring 2021 surge
Unkn ¶ Total may not reflect state due to missing age data
• Currently, there are approximately 389 daily hospital admissions for COVID-19
• Over the past week, those 60-69 have seen the highest avg. daily hospital admissions (81 admissions)
• Since Apr 14 high, those 40-79 have seen the > 30% decrease in avg. daily hospital admissions
Source: CHECC & EM ResourceStatewide Hospitalization Trends: Total COVID+ Census
COVID+ census in hospitals continues to
Hospitalization Trends 10/1/2020 – 5/3/2021
decline from the April 19th peak.
Confirmed Positive & Persons Under Investigation (PUI)
This week is down 19% from the previous
week (vs. 16% decline the week prior).
Confirmed Positive
Hospitalized COVID Positive Long Term
Trend (beginning March 2020)
PUI
21Statewide Hospitalization Trends: Regional COVID+ Census
All regions are showing decreasing hospital
Hospitalization Trends 10/1/2020 – 5/3/2021 COVID census trends this week although the
Confirmed Positive by Region decline is minimal in Region 5 (SW).
Region 1 All regions are now below 400/M population
Region 2N
Region 2S hospitalized, with 3 regions (Regions 5, 7, and 8)
Region 3 now below 200/M hospitalized.
Region 5
Region 6
Region 7 Region COVID+ COVID+
Region 8 Hospitalizations (% Δ Hospitalizations
from last week) / MM
Region 1 231 (-19%) 214/M
Region 2N 737 (-25%) 333/M
Region 2S 867 (-16%) 389/M
Region 3 364 (-21%) 321/M
Region 5 190 (-1%) 199/M
Region 6 366 (-12%) 250/M
Region 7 80 (-32%) 160/M
Region 8 22 (-19%) 71/M
22Statewide Hospitalization Trends: ICU COVID+ Census
Overall, the census of COVID+ patients in ICUs has
Hospitalization Trends 8/1/2020 – 5/3/2021 decreased 10% from last week, with all regions
Confirmed Positive in ICUs showing decreases.
Regions 2S and 6 continue to have >30% ICU beds
occupied with COVID patients and Region 3
continues to have >90% overall ICU occupancy.
Region Adult COVID+ in Adult ICU % of Adult ICU
ICU (% Δ from Occupancy beds COVID+
last week)
Region 1 56 (-5%) 90% 28%
Region 2N 156 (-20%) 87% 25%
Region 2S 250 (-7%) 85% 32%
Confirmed
Positive in ICU Region 3 107 (-4%) 94% 29%
Region 5 43 (-4%) 79% 25%
Region 6 108 (-8%) 85% 40%
Region 7 40 (-13%) 67% 22%
Region 8 8 (-20%) 76% 14%
Hospital bed capacity updated as of 4/30
23Average and total new deaths, by age group
Daily confirmed and probable deaths per million by Total confirmed and probable deaths by age group
age group (7 day rolling average) (past 30 days, ending 4/24/2021)
0-19 40-49 70-79 • All age groups are seeing increases
414
20-29 50-59 80+ in number of deaths 409
60 30-39 60-69 Total
• 22% of deaths below age sixty
360
50
40
30
183
20
81
10
44
17
0 6
2/1 2/15 3/1 3/15 3/29 4/12 4/26
0-19 20-29 30-39 40-49 50-59 60-69 70-79 80+
Note: Death information sourced from MDHHS and reflects date of death of confirmed and probable cases.
Source: MDHHS – Michigan Disease Surveillance System30-day rolling average daily deaths per million people by race and
ethnicity
Average daily deaths per million people by race Average daily deaths per million people by
ethnicity
American Indian/Alaska Native Black/African American Hispanic or Latino Not Hispanic or Latino
8 Asian/Pacific Islander White 8
6 6
4 4
2 2
0 0
2/1 2/15 3/1 3/15 3/29 4/12 4/26 2/1 2/15 3/1 3/15 3/29 4/12 4/26
Updates since last week:
• Deaths are a lagging indicator of cases, and death rates are increasing among racial and ethnic groups
• All racial and ethnic groups are seeing an increase in COVID deaths
• American Indian/Alaskan Natives, Blacks and Non-Hispanics/Latinos have the most reported deaths per capita
• Deaths are not adjusted for confounders (e.g., age, sex, comorbidities)
Note: Death information sourced from MDHHS and reflects date of death of confirmed and probable cases.
Source: MDHHS – Michigan Disease Surveillance SystemHow is public health capacity?
Diagnostic testing volume (PCR and antigen) has decreased slightly from last week
• PCR testing decreased since last week
• Percent of antigen tests have increased since last week
Cases identified for investigations has declined
• Number of cases not investigated this week (15,881) is 33% lower than prior week (24,409)
• Consistent low proportion of cases interviewed with a source of known infection (indicating community acquisition)
• As cases have decreased, the percent of interviews attempted has improved
• Consistent low proportion of those quarantining when their symptoms begin (indicating no effective halt in community
transmission)`
Daily diagnostic tests, by message date
Last 90 Days Tests By Test Type and Message Date Weekly Update
120,000 • 66,557 rolling 7-day
average daily
diagnostic tests
100,000
reported to MDHHS
(PCR + Ag) (↓)
80,000
• 41,304 average daily
PCR tests (↓)
60,000
• 37.9% are antigen
tests over the past
40,000 week (↑)
20,000
• 12.6% positivity in
PCR tests (↓)
-
1/30 2/6 2/13 2/20 2/27 3/6 3/13 3/20 3/27 4/3 4/10 4/17 4/24
Total Diagnostic Tests Total Antigen Tests 7 day moving average, diag. tests
Source: MDSS/Michigan Medical Advantage Group, MDHHS, testing labsNew Case Investigation Metrics (Statewide)
New Communicable Disease metrics this week:
• Number of cases identified for investigations (↓), and percent of completed interviews (↑) have improved from prior week
• 43% of investigated cases having a known source (50% last week, 55% week prior)
• 29% of investigated cases noted that they were quarantining before symptoms (34% last week)
04/17-04/23 Case report form information 04/24-04/30 Case report form information
33,103
Yes No Not answered
24,327
24,409
15,881
8,694 8,694
10% 7% 8,446 8,446
40% 20% 30%
8,694 65%
8,446 36%
(26%) 41%
50% (35%)
34% 43% 29%
Case investigation complete? Known source of infection? Already quarantining at time Case investigation complete? Known source of infection? Already quarantining at time
of symptom onset? of symptom onset?
Source: MDHHS – Michigan Disease Surveillance SystemCOVID-19 Vaccination
Administration
• 8th among all states for doses administered; 7th for number fully vaccinated (CDC data tracker 5/3/2021)
• 77.9% adjusted administration ratio (excluding federal entities, CDC channel portfolio 5/2/2021)
• Weekly doses administered declined for two weeks
Coverage
• 50.6% of MI residents age 16+ have initiated COVID vaccination and 39.3% have completed their series
• Coverage is highest among 65-75 and 75+ age groups, but more than 66% of people 50-64 have started vaccine
• Initiation coverage was highest among Asian, Native Hawaiian or Pacific Islander individuals
Vaccinated Individuals Who Test Positive
• Number of cases who are fully vaccinated (n=4,031) is not in excess of what might be expected with vaccines
with 95% efficacy.
• Possibility of infection and further transmission is why recommend precautions in public (e.g., wearing masks,
washing hands and social distancing) even after receiving the vaccine until more Michiganders have been able to
be vaccinatedDoses Delivered and Administered, and Coverage as of 5/4
9,702,905 doses delivered to Michigan providers*
7,068,833 doses Administered
• 77.9% Federal-Jurisdiction adjusted administration ratio (excluding federal entities, per CDC channel portfolio as of
5/2/2021)
• 6 weeks with more than 500,000 doses administered in a week; 19 days over 100,000 in a day
• 409,591 doses administered last week (down ~135,100 doses over previous week). Loss is in first doses.
*Includes state allocated doses ordered by State of Michigan, SOM allocation transferred to federal programs, and federal doses from federal programs to Michigan providers. Does
not include federal doses sent to federal providers (i.e., Veteran’s Administration hospitals, federal prison system, or Department of Defense programs). The State of Michigan does
not have control over how much vaccine is allocated or administered by Federal program.Coverage Demographics as of 5/4/2021
50.6% of MI residents age 16+ have
initiated COVID vaccination
3,182,912 people have completed series
Age Group
• 66.1% of those 50+ have started
vaccine series
• 67.9% people aged 65 or older have
completed their vaccine series
Race/Ethnicity
• Initiation coverage highest among
those of Asian, Native Hawaiian or
Pacific Islander Race (42.4%) then
NH (Non-Hispanic) White (38.2%),
American Indian (37.4%), NH Black
or African American (25.2%) Races,
and Hispanic (26.7%) ethnicity
• 25.4% data missing or unknown
Source: Michigan Coronavirus Dashboard https://www.michigan.gov/coronavirus/0,9753,7-406-98178_103214-547150--,00.htmlPotential COVID-19 Vaccination Breakthrough Cases
Process:
Michigan part of CDC’s nationwide investigation (COVID-19 Breakthrough Case Investigations and Reporting | CDC)
Weekly match COVID-19 cases to records of all fully vaccinated persons
Absence of a positive test less than 45 days prior to the post-vaccination positive test
Send data to CDC and, if available, gather respiratory specimens for whole genome sequencing
Michigan Data (1/1/21 through 4/27/21):
4,031 cases met criteria based on a positive test 14 or more days after being fully vaccinated
Less than 1% of people who were fully vaccinated met this case definition
— Includes 34 deaths, 32 persons 65 years or older, one had prior PCR positive greater than 45 days prior
— 135 cases were hospitalized
Summary Points:
• Number of potential cases identified to date is not in excess of what might be expected with vaccines with 95% efficacy.
• Proportions of those symptomatic, hospitalized, and who died are all lower than those who are unvaccinated.
• Continue to encourage precautions while out in public, including wearing masks, washing hands and social distancing,
even after receiving the vaccine until more Michiganders have been able to be vaccinated.Other Public Health Indicators Childhood Vaccination Coverage • Vaccination coverage for Michigan children 19 through 35 months of age has declined from April 2020 to April 2021 • Since 2020Q2, trends for vaccination coverage among children 19-35 months has decreased for most races with the greatest disparities among those who are black or for whom race is missing or unknown
Routine Childhood Vaccination Coverage

•   Vaccination coverage for Michigan
    children 19 through 35 months of age
    has declined from April 2020 to April
    2021
•   Coverage for the primary 4313314
    series has decreased 2.9%, from 72.3
    to 69.4%
•   Coverage for each individual antigens
    assessed decreased
•   Most concerningly, coverage for 1
    dose of the measles containing MMR
    vaccine has declined the most (3.7%)
    and is only at 80.9% (recommended:
    95% to achieve herd immunity*)

                      * WHO recommendations

Source: Michigan Department of Health and Human Services   – Immunization Program
Routine Childhood Vaccination Coverage: Racial Disparities
• This table displays the trends over time by race for the childhood vaccine coverage of 4313314 (4 DTaP, 3 Polio, 1 MMR, 3 Hib, 3 HepB,
1 Varicella, 4 PCV)
• Since 2020Q2, trends for vaccination coverage among children 19-35 months has decreased for most races
• Vaccine coverage is lowest for Black and Missing/Unknown Race
Source: Michigan Department of Health and Human Services – Immunization ProgramScience Round Up Nationwide Seroprevalence Update • Approximately 19.7% of Michiganders have been infected with SARS-CoV-2 (lower than neighboring states) • This equates to almost 2 million Michiganders • Those who are younger and female are more likely to have antibodies for SARS-CoV-2 in this study International Update: India • Healthcare capacity overwhelmed • Perfect Storm: easing of restrictions + emergency of variants (B.1.1.7 and B.1.617) • B.1.617: WHO Variant of Interest Concepts in Herd Immunity • Using testing, surveillance, and vaccination to estimate future projections
• Michigan seroprevalence has been relatively stable between 17-20% since January                       Source:
• Michigan had lower estimated seroprevalence than some of our neighboring          https://covid.cdc.gov/covid-
  states (WE, IL, IN, OH estimates range from 25-32%)                                 data-tracker/#national-lab
Michigan Commercial Laboratory Seroprevalence
Survey – Age and Sex Distributions
Change in average mobility
Unacast mobility
patterns in MI
• All metrics decreasing,
  particularly avg. mobility
  & non-essential visits              Change in non-essential visits
• Mobility decreases
  precede case decreases
•   Blue lines show approximately
    when mobility decreases
    began, cases shown as bars at
    top of each chart
•   Data through 4/29/21 (data as     Difference in encounter density
    of 5/3/21)
         Unacast social distancing
         scoreboard
         https://www.unacast.com/co
         vid19/social-distancing-
         scoreboard
How might vaccination levels change through
the summer?
• If 1st doses/week fall
to 60% of last week by
6/1 and 30% by 8/1,
expect 60-65% 1st
dose coverage by
August 1
• If 1st doses/week stay
constant at last week
levels, could reach
70% by August 1
• Sooner if 1st
doses/week return to
previous weeks levels
https://sph-
umich.shinyapps.io/
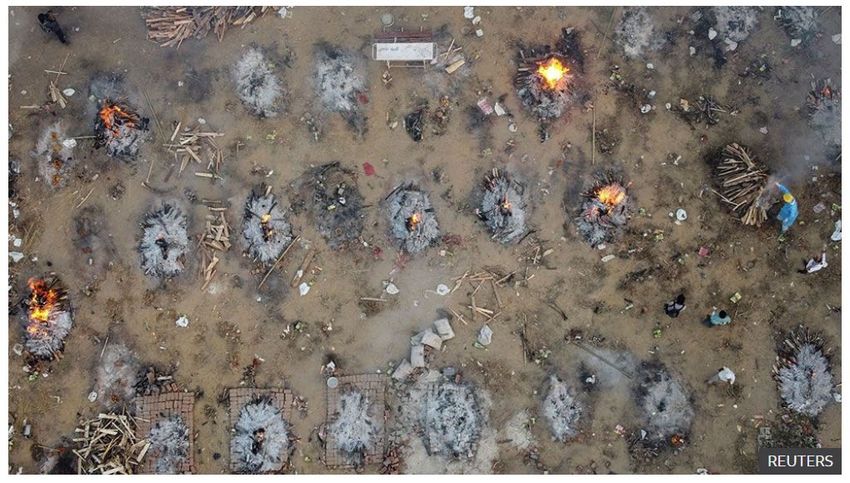
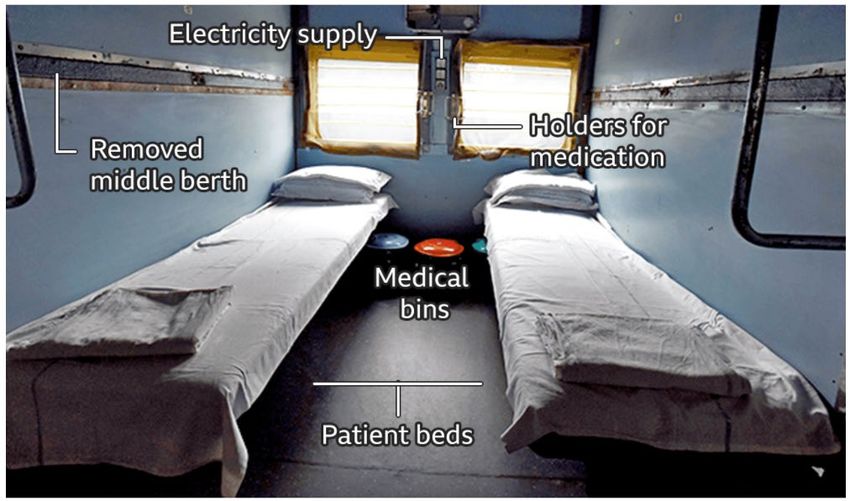
covid19-vaccines/International Update: India
• Oxygen shortages • Overwhelmed hospitals
• Medication shortages • Crematoriums full
https://www.bbc.com/news/world-asia-india-56891016What Happened?
India had escaped an earlier onslaught Dry tinder for viral spread
• More time spent outdoors • Relaxed restrictions
• Low levels of obesity • Weddings, political rallies,
religious gatherings
• Relatively young population
• Variants
• Previous viruses had created • B.1.617 & B.1.1.7
natural immunity?
• Those with previous mild
infections may have had limited
immunity
https://www.nytimes.com/2021/04/26/briefing/Nomadland-Europe-travel-Covid-19.html?smid=url-shareB.1.617
WHO Variant of Interest
“Preliminary modelling by WHO
based on sequences submitted to
GISAID suggest that B.1.617 has a
higher growth rate than other
circulating variants in India,
suggesting potential increased
transmissibility.”
“Double mutant”
L452R found in the B.1.427/B.1.429 variant (California),
associated with increased transmissibility.
E484Q, is similar to the E484K mutation found in the P.1
variant (Brazil) and the B.1.351 variant (South African).
May help the virus partially evade immunity from prior
infection or vaccines.
https://www.hindustantimes.com/india-news/double-mutant-now-most-common-of-variantsdata-101618512310963.html
https://www.the-scientist.com/news-opinion/what-scientists-know-about-the-b-1-617-coronavirus-variant-68733The End of the Pandemic: First exponential growth, now exponential decay
The Journey to Herd Immunity

•   Widespread symptomatic testing and
                                                  •   Targeted testing and case identification is
    contact tracing is needed to identify cases
                                                      needed to prevent outbreaks.
    and prevent large-scale transmission.
                                                  •   Surveillance is needed to gauge the
•   Asymptomatic screening is helpful to
                                                      incidence of disease.
    identify occult infections.

                                                              Graphic courtesy of https://www.bloomberg.com/
The reality Pockets with high levels of vaccination and pockets with low levels
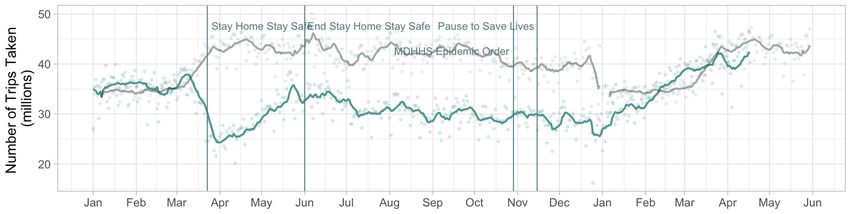
How many people are staying at home in Michigan?
  2020 - 2021
        2019

                                    • % Stay-at-home
                                      levels have declined
                                      to 2019 levels
                                    • Number of trips
                                      taken/day has
                                      increased to 2019
                                      levels
                                    • Most recent data is
                                      4/17/21 (data as of
                                      4/26/21)

                                      Data Source: Bureau of
                                     Transportation Statistics
You can also read