Association of Greek Institutional Investors - November 2015 - METKA
←
→
Page content transcription
If your browser does not render page correctly, please read the page content below
Association of Greek Institutional
 Investors

November 2015
Disclaimer

These preliminary materials and any accompanying oral presentation (together, the “Materials”) have
been prepared by MYTILINEOS Holdings SA (the “Company”) and are intended solely for the information
of the Recipient. The Materials are in draft form and the analyses and conclusions contained in the
Materials are preliminary in nature and subject to further investigation and analysis. The Materials are
not intended to provide any definitive advice or opinion of any kind and the Materials should not be relied
on for any purpose.
            purpose The Materials may not be reproduced, in whole or in part, nor summarised,
excerpted from, quoted or otherwise publicly referred to, nor discussed with or disclosed to anyone else
without the prior written consent of the Company.

The Company has not verified any of the information provided to it for the purpose of preparing the
Materials and no representation or warranty, express or implied, is made and no responsibility is or will
be accepted by the Company as to or in relation to the accuracy, reliability or completeness of any such
information. The conclusions contained in the Materials constitute the Company’s preliminary views as
of the date of the Materials and are based solely on the information received by it up to the date hereof.
The information included in this document may be subject to change and the Company has no
obligation to update any information given in this report. The Recipient will be solely responsible for
conducting its own assessment of the information set out in the Materials and for the underlying
business decision to effect any transaction recommended by, or arising out of, the Materials. The
Company has not had made an independent evaluation or appraisal of the shares, assets or liabilities
(contingent or otherwise) of the Company.

All projections and forecasts in the Materials are preliminary illustrative exercises using the assumptions
described herein, which assumptions may or may not prove to be correct. The actual outcome may be
materially affected by changes in economic and other circumstances which cannot be foreseen. No
representation or warranty is made that any estimate contained herein will be achieved.

                                                                                                              2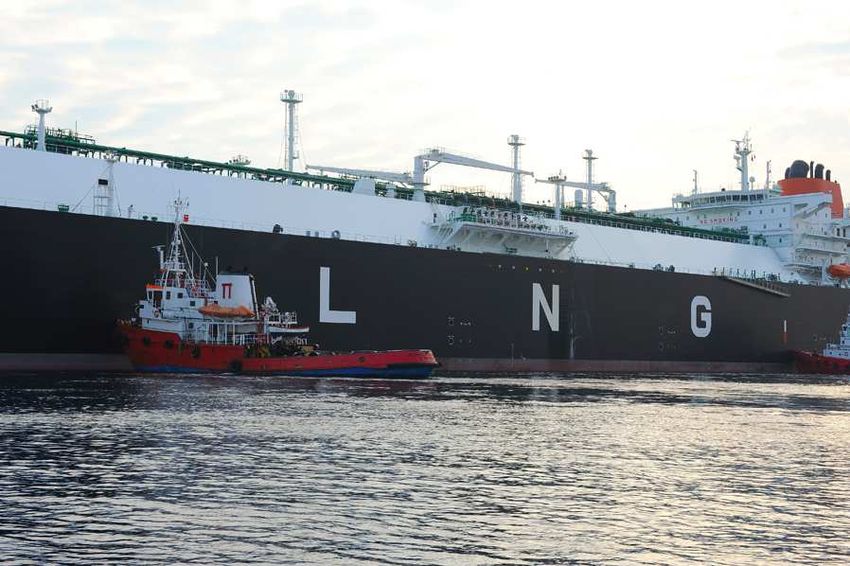
Contents

MYTILINEOS GROUP OVERVIEW
• Group Structure
• Subsidiaries
• International Presence
• Vision and Strategy

AREAS OF ACTIVITY
• Metallurgy & Mining
• Power & Gas
• EPC- turn key energy projects

FINANCIAL REVIEW
• Consolidated Figures
• Segments Performance

APPENDIX
• Stock Data - Performance
• ESG

                                  3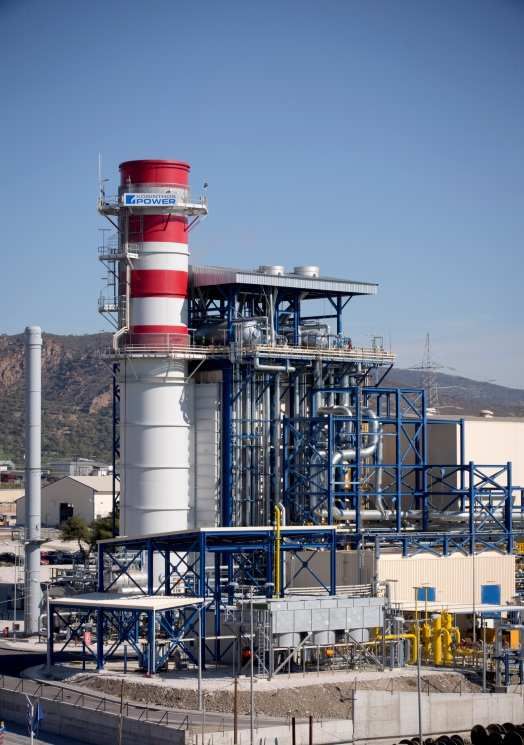
Mytilineos Group Overview
• Mytilineos Holdings SA (“Mytilineos” or the “Group”), founded in 1908, is one of the leading industrial groups in
  SE Europe active in Metallurgy and Mining, Power and Gas, and EPC sectors
• Mytilineos is listed on the Athens Stock Exchange (ASE) and is 32.0% owned by the Mytilineos family

Main Activities

                             Leading producer of refined alumina and primary aluminium in South-East Europe
                             Vertically integrated
Metallurgy & Mining
                             – Own bauxite mines, an alumina refinery and an aluminium smelter with annual
                                production capacity of 815k MT and 182k MT respectively

                             Leading independent power producer (IPP) in Greece, with a long term strategy of
                             becoming an integrated energy player. Sole private Gas importer after the local
Power & Gas                  incumbent DEPA.
                             Total Power capacity of 1.2GW

EPC                           Leading EPC contractor in the EMEA region
(METKA)                       Currently c. €1.4bn backlog, of which 75% stems from projects outside Greece

                                                                                                                                     4

                                                                                                                Source: Company Information.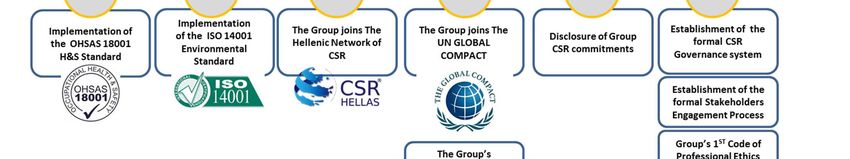
A well balanced portfolio of industrial activities

                                                                                          Mkt Cap: €578mn

                      METALLURGY                                          POWER                        METKA (EPC)
                        & MINING                                          & GAS                             50.0%

                                                                                                               Listed with
                                                                                                               Mkt Cap*: €452mn

                                                             POWER
     BAUXITE             ALUMINA                 ALUMINIUM                        NATURAL              EPC ENERGY
                                                             GENERATION
                                                                                  GAS SUPPLY           PROJECTS
                                                             ASSETS

Source: Company Information.
Note: Market data 29 October 2015.                                                                                           5
METKA is the only remaining listed subsidiary.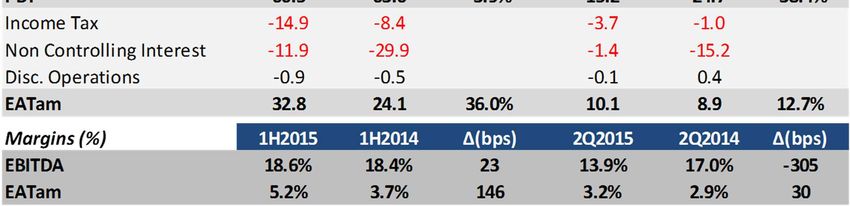
Well diversified and export oriented
                                                                                              Revenue (FY 2014)

                                                                                              EBITDA (FY 2014)

   Non-Greek revenues and exports represent 75% of the consolidated turnover
• EPC – 93% of revenues generated through projects outside of Greece, mainly in MENA region
• Power & Gas – 100% of revenues generated within Greece
• Metallurgy & Mining – 75% of revenues generated through exports, mainly to EU countries
                                                                                                                  6
Source: Company Information.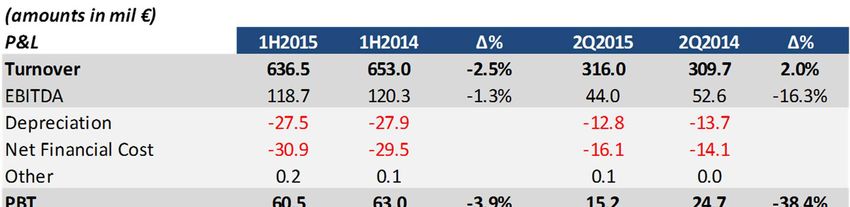
Regional Champion and European Leader in the Making – Stands to
                                benefit the most of the ongoing structural weakening of the Euro

                                            GROUP STRATEGY
                                               Pursue regional leadership position in all three main sectors
                                               Maximise operating synergies
                                               Create value for stakeholders

                                            Power & Gas
                                               Increase market share and establish the Largest IPP in Greece
                                               Enhance its portfolio of assets and become a fully integrated
                                               power producer / supplier
                                               Optimize Natural Gas sourcing and extract synergies
                                            Metallurgy & Mining
                                               Vertical integration
                                               Focus on exports
                                               Become the lowest cost producer in Europe

                                            EPC
                                                  Expand in regional growth markets with strong fundamentals
                                                  Full EPC scope
                                                  Explore new opportunities in local infrastructure projects

                                                                                                               7
Source: Company Information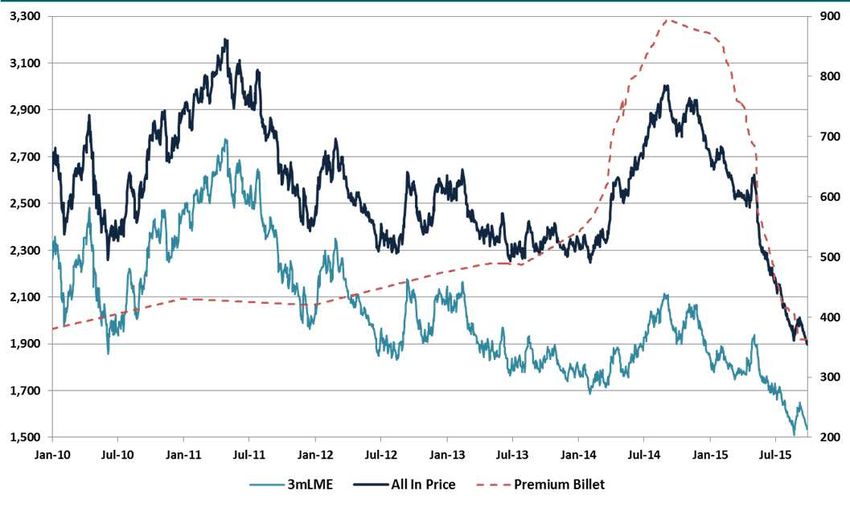
Metallurgy and Mining

                        8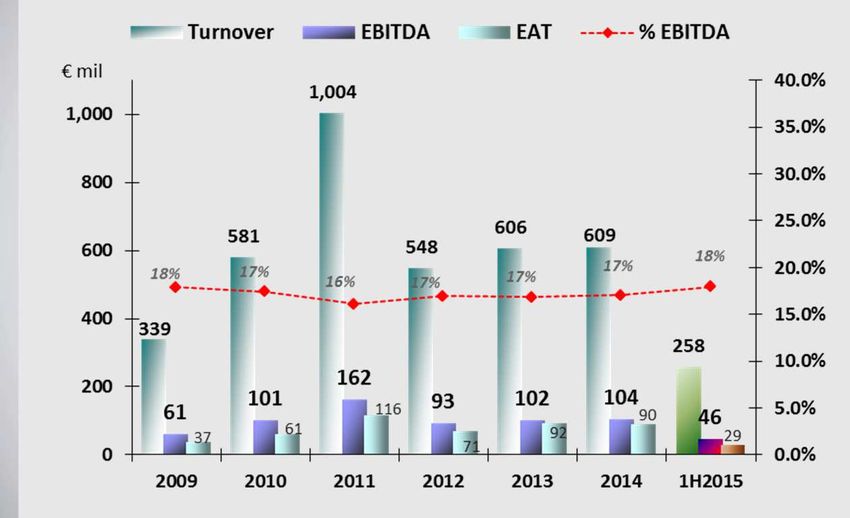
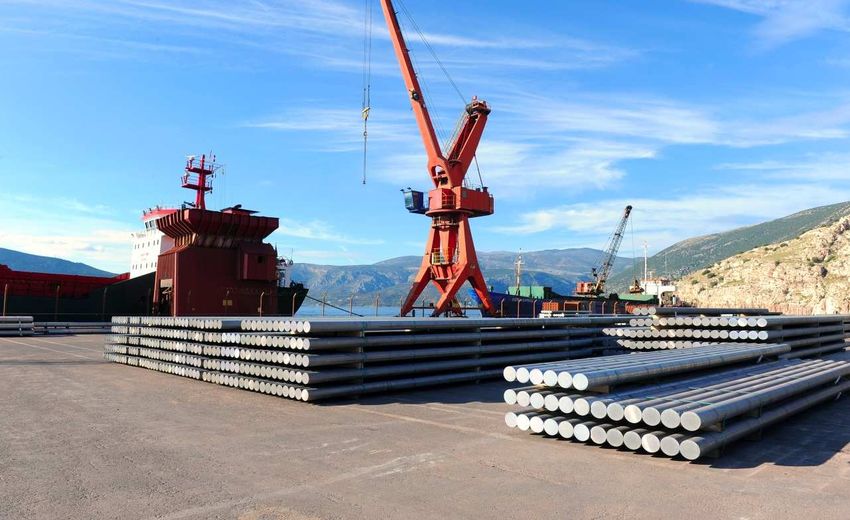
Largest vertically integrated and one of the lowest cost
                             Aluminium & Alumina producers in E.U.

     Bauxite Mines               Alumina Refinery               Aluminium Smelter              334 MW CHP                   Port Facilities

Key highlights                Key highlights                  Key highlights             Key highlights                Key highlights
     Second largest bauxite        Producer of 17% of              ~180ktpa of                On-site power and             On-site port facilities
     producer in Europe            total European Alumina          production capacity        steam production              for incoming raw
     with ~700ktpa of              output - ~815ktpa               Established                offering purchasing           materials outgoing
     production capacity           Sufficient capacity to          customer base              flexibility – Secured         finished products,
     Long life of mine             cover internal needs for        Long-term export           Electricity Supply            minimising logistical
     underpinned by                the smelter and to              sales with European        Internal Steam                costs.
     11mt of resources             export ~500ktpa                 customers provide          production using              On-site casthouse
     Long-term off-take            Long-term off-take              security of sales          Natural Gas                   providing value - add
     agreement with third          agreement with global                                                                    products
     parties in Greece and         and regional players
     abroad.
                                                                                                          Primary Aluminium Capacity           182Ktn

                                                                                                          Refined Alumina Capacity             815ktn

                                                                                                                                                      9

                                                                                                                               Source: Company Information.
Global aluminium market overview
    Global AL consumption trend                                                 • Total world consumption is expected to remain robust
                                                                                  for yet another year in 2015.
        Mt
                                                                                • After premiums collapse in 2015, current “All – in” prices
                                                                                  seem unsustainable making a large part of the global ex.
                                                                                  China production loss making.
                                                                                • The Global Aluminium Market faces a minor surplus in
                                                                                  FY15e.
                                                                                • Strong performance of the US Dollar against most other
                                                                                  currencies is particularly favourable for vertically
                                                                                  integrated producers that operate in a non-dollar
                                                                                  environment.

    LME & Premium prices (USD/TN)                                               LME Inventories / Global Consumption Ratio

                                                                                   Before
                                                                                Global Crisis

                                                                                                                                         10

Source: Bloomberg, Harbor Intelligence. HSBC, Morgan Stanley brokers reports.
One of the largest Alumina Refiners in Europe
Alumina Production in Europe
• AoG produces 815ktn which represents c.17% of
the total Alumina Production in Europe.
• The Indonesian ban on bauxite exports changes
market dynamics in favor of upstream business.
• Continuous migration to indexed pricing against
traditional LME – linked contracts.
Alumina (USD/TN) Alumina Market Balance (Tt)
11
Source: Bloomberg, Harbor Intelligence..Delivering on Costs: One of the world’s most
ambitious cost - cutting programs, completed
successfully.
Achieving our Targets “MELLON”: Continuous Cost Focus
• Competitive Electricity Tariff
• CHP Commercial Operation
• Labor Cost - Productivity
• Logistics – Freight Costs
• Raw Materials
• Replacement of HFO with NG
• Numerous other actions
• Total investments of $300 m.
Sustainable Cost Reduction 2014vs11 = $145m p.a.
Cost cutting continues after 2014 , aided by lower Oil & Gas prices, falling raw materials cost and lower €/$ parity.
New program “EXCELLENCE” targets to save additional 200 $/tn. 12
Source: Company InformationSafeguarding profitability through the cycle
Metallurgy & Mining EBITDA Quarterly Performance - All in Aluminium Prices
Best Semi Annual Performance
• 1H15 EBITDA: € 65.4 (+175.6% from 1H14) – 1H15 EBITDA margin 22.0%.
• Reaping the benefits of the “MELLON” cost cutting program.
• Weakening of the Euro against the USD.
• Lower Oil and Natural Gas prices.
13
Source: Company Information. Bloomberg, Harbour Intelligence.Repositioning drastically in the global cost curve
Global Primary Aluminium Cash Cost Production Curve ($/MT)
1st Quartile 2nd Quartile 3rd Quartile 4th Quartile
2011 AoG
Most competitive Smelters
(Middle East, North West
China)
2014 AoG
Target at the
end of 2016 AoG
(1st Quartile)
High Cost Chinese Smelters
Global Average Cost:
1,850 $/MT
14
Source: Company Information, HARBOR Intelligence, CRU ANALYSIS, MBR.Power production and Natural Gas
15Leading IPP and 2nd largest player in the domestic electricity
market
Overview
The Greek electricity market is under liberalisation. Most of the existing capacity is old and inefficient,
underlying the need for new capacity and replacements.
Total 2014 Power demand: 50.2 TWh (down 0.9%).
Fuel Mix 2014: Lignite 45%, NG 13%, Hydro: 8%, RES: 18%, Net Imports: 17%.
Mytilineos Group operates 1.2 GW – c. 10% market share of the total thermal installed capacity.
Owning and operating the most efficient Gas plants.
Expected Fuel Mix Evolution (MW)
2020F 16
FY2014
Source: IPTO, Company Information.Fuel Mix changing in favour of NG fired capacity
• NG power production up 40% y-o-y in
September.
• NET imports fall over 40% after the end of
1H2015 – Growing domestic power production
to meet increasing power consumption (+3.8%
ytd).
• NG plants currently compete head to head with
Lignite fired capacity.
• In a typical day of October 50% of hourly
System Marginal Prices defined by NG plants.
• Falling NG prices boost CCGT’s competitiveness
against Lignite capacity in the medium term.
17
Source: IPTO, Company Information.Strategic Investment programme completed end 2012
CCGT Viotia Portfolio – Renewable Energy Sources (RES)
• The most efficient CCGT in Greece.
• Combined cycle natural gas fired unit. Wind
• Gross capacity 444.48MW. Operational:
• Net efficiency 58% (LHV) 36MW
• MH Stake: 100% Under
construction:
130 MW
CCGT KORINTHOS
• Combined cycle natural gas fired unit.
• Site located in Korinthos, within the Solar
MOH refinery complex. Operational:
• Gross capacity 436.6MW 14MW
• Net efficiency 57.7% (LHV)
• MH Stake: 65%
CHP Viotia Hydro
• Among the largest CHP plants in South Operational:
Europe 6MW
• Gross Capacity 334 MW.
• Priority dispatch & Feed in Tariff -
Operating as Base Load RES.
• MH Stake: 100%
18
Source: Company Information.
Source: HTSO, Company Information.Largest Natural Gas consumer in Greece
MG Natural Gas Fired Plants 1.2 GW
+
AoG Refinery
+
MOTOR OIL Refinery
MYTILINEOS Group is active in the domestic gas market through the 50% - 50% JV with MOTOR OIL
HELLAS, named M&M NATURAL GAS S.A.
M&M helps the Group secure Natural Gas at competitive rates becoming also the 2nd largest gas
supplier in Greece.
Mytilineos Group with total natural gas consumption representing c. 30% of the total market,
maintains maximum flexibility to select over alternative sources of supply (ie. LNG spot) and reduce
its overall energy costs.
Well placed to benefit the most from lower Gas prices in Greece.
19
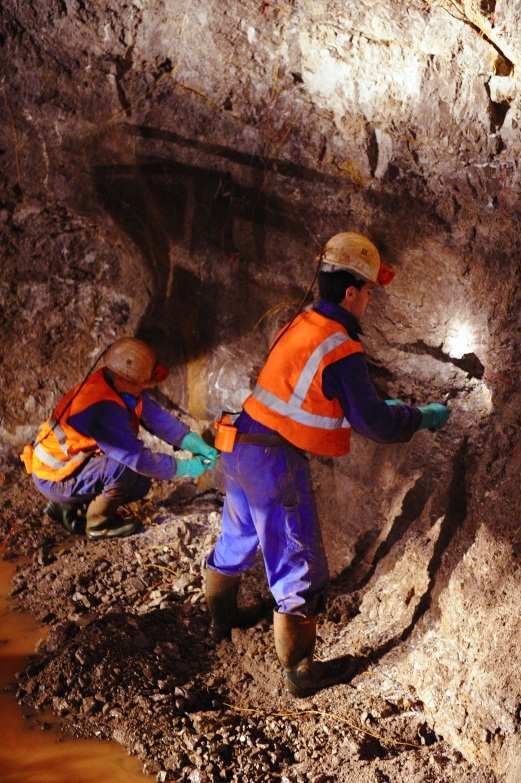
Source: Company Information.EPC – Turn Key Energy Projects
20Leading EPC Contractor, expanding in regional
growth markets
Athens - listed Leading EPC contractor with International Profile since 1972.
Active across Europe, Turkey, Middle East and Africa.
Specialised in Natural Gas Fired Power Plants.
Broad range of skills in project management, engineering, procurement, construction and
plant commissioning.
Traditional Long Term Relationships with leading global energy players, namely GE, Ansaldo.
Established close ties with world class technology providers.
Exploring new opportunities in local infrastructure projects.
Energy Projects:
• Focus on Complete Power Plants.
• Full EPC scope or in consortium with technology suppliers.
Manufacturing:
• Focus on technically demanding infrastructure applications
• Complex steel constructions, civil engineering applications, Oil&Gas/ refinery market.
• Manufacturing co-production with defense majors. 21
Source: Company Information.Running simultaneous demanding projects
worldwide
Geographically Diverse with Strong Partners Backlog: €1.4bn
Project Equipment Expected
Country MW
Owner Supplier End Date
SPE GE 368 2nd Half 2015
Romania Algeria
SPE GE 590 2nd Half 2015
Turkey
Greece Jordan SEPCO Alstom 143 1st Half 2015
Rep. of Iraq GE 1,250 1st Half 2016
Algeria Pakistan Iraq
Middle East Rep. of Iraq - - 1st Half 2016
Syria PEEGT Ansaldo 724 Delayed
Ghana Gov. of Ghana - 250 2nd Half 2020
Greece ERGOSE - - 2nd Half 2016
• METKA undertakes the implementation of turn-key projects from design and procurement through to construction and commissioning
• Strong presence in developing markets, with non-Greek projects accounting for 85% of Sales.
• Established close ties with world class technology providers
• The project in Ghana is a 5-year Build, Own, Operate and Transfer (BOOT).
22
Source: Company Information.Energy Demand Outlook
Mt
Rest World
OECD
China
23
Source: International Energy Agency 2014Maintained high profitability margins, fighting
domestic contraction through international expansion
• Strong Cash Flows – Significant liquidity.
• Top Quality Balance Sheet – Zero Debt – Low Capex Requirements.
• Strong Execution Skills - Excellent track record of complicated energy projects successfully delivered.
• Well positioned to benefit from the expansion in regional growth markets.
Source: Company Information. 24Financial Review • Group financial performance • Segments financial performance
Solid Financial Performance

Consolidated P&L

Key Performance Drivers
•   Strong overall Performance in 1H 2015 – Intensifying activity abroad.
•   Significant increase in the Profitability of the Metallurgy sector on the back of drastic cost savings program, USD strengthening and
    falling energy prices.
•   Solid Performance of the EPC sector on the back of the existing backlog.
                                                                                                                                         26
•   Weak performance of the Energy Sector expected to turn around in the 2nd Half of the year.
                                                                                                                   Source: Company Information.
Strong Balance Sheet
Consolidated Balance Sheet Figures
€mil 2009 2010 2011 2012 2013 2014 1H2015
Fixed assets 1,135 1,516 1,624 1,666 1,674 1,693 1,674
Current assets 854 1,102 1,059 1,058 983 988 1,044
Total assets 1,989 2,619 2,683 2,724 2,657 2,681 2,718
Shareholders’ Equity 764 844 901 976 1,090 1,161 1,192
Net Debt 431 533 575 725 510 373 429
Total Liabilities 1,225 1,775 1,783 1,728 1,567 1,520 1,526
Key Ratios
Net Debt / EBITDA 3.6x 3.3x 2.8x 4.2x 2.3x 1.5x 1.8x
EV/EBITDA 8.3x 6.5x 4.5x 6.4x 4.9x 4.6x 4.7x
27Strong cash flows drive net debt lower
Group Net Debt Evolution
28
Source: Company Information.Balanced Performance among the three main
activities
EPC Power & Gas Metallurgy & Mining
EBITDA Contribution - The evolution of the Group since 2008
Metallurgy
2008 & Mining 2011 2014
14%
Metallurgy
Power &
& Mining
46% Gas
EPC 54% 13%
EPC 73% 29
Source: Company Information.Concluding Remarks
Emerging Stronger out of the Greek Crisis
• Largest Greek investment programme in energy and industrial assets completed,
all assets now performing as expected.
• Solid Balance Sheet, Strong Cash Flows.
• Strong financial performance despite market headwinds drives valuation ratios (ie
EV/EBITDA, EV/FCF, P/E) at record low levels.
• Metals & Mining coming back to gain top European positions in the cost charts.
METKA being established as one of the most reliable EPC contractors in the wider
region - Protergia already #1 private power generator in the country .
• Extracting synergies and delivering value to the shareholders.
• Well placed to take advantage of the privatisation activities in the domestic field.
30
Source: Company Information.Appendix • Stock data • ESG • 1H2015 financial results
MYTIL outperforming the market

Share Price Information

•       Market Cap: €578mn
•       Avg. Trading Value: €1.8 mn {12M}
•       Total No of shares: 116,915,862
•       Free Float: 68.0%
•       Listing FTSE LARGE CAP 25
•       Tickers: MYTIL.GA, MYTr.AT

Shareholder structure

                                            Mytilineos
    Retail                                  Family

                                        Fairfax Financial
                                        Holdings

Foreign Institutional          Greek Institutional
Investors                      Investors
                                                               Notes: Data as of 29 October 2015.   32
                                                               Source: Company Information.
METTK: Stock Data – Dividend payout
Share Price Information
• Market Cap: €452mn.
• Avg. Trading Value: €0.9mn {12M}
• Total No of shares: 51,950,600
• Free Float: 50.0%
• Listing FTSE LARGE CAP 25
• Tickers: METTK.GA, MTKr.AT
Shareholder structure
Distributed > €100m. in dividends over the last 5yrs
Retail
Mytilineos Holdings
Foreign
Institutional
Investors
Greek
Institutional
Investors
33
Notes: Data as of 29 October 2015. Source: Company Information.Sustainability / ESG highlights
34
Source: Company Information.Mytilineos Group – 1H2015 Results Highlights
35Mytilineos Group – Business Unit Performance
TURNOVER - EBITDA PER ACTIVITY
EBITDA 1H2015: €118.7 m.
EBITDA 1H2014: € 120.3m.
*Corporate Center includes all other activities that are not directly linked to M&M, EPC & Energy.
*EPC does not include intercompany transactions. 36
Source: Company Information.Metka Group – 1H2015 Results Highlights
37Focused on Long Term Performance
Book Value per Share
€/Share 19 Year Compound Annual Growth Rate of 14.1%
Outstanding Growth during severe
Greek Crisis with GDP falling 25%
in 5 years
5yrs: +52%
Source: Company Information. 38
* 2005 – 06 figures adjusted for the acquisition of AoG in 2005 followed by the merger in 2007.Contact Information
Dimitris Katralis
IR Officer
Email: dimitrios.katralis@mytilineos.gr
Tel: +30-210-6877476
Fax: +30-210-6877400
Mytilineos Holdings S.A.
5-7 Patroklou Str.
15125 Maroussi
Athens
Greece
Tel: +30-210-6877300
Fax: +30-210-6877400
www.mytilineos.gr
www.metka.com
39You can also read