Modeling the Coronavirus Disease 2019 Incubation Period: Impact on Quarantine Policy - MDPI
←
→
Page content transcription
If your browser does not render page correctly, please read the page content below
mathematics
Communication
Modeling the Coronavirus Disease 2019 Incubation
Period: Impact on Quarantine Policy
Daewoo Pak 1 , Klaus Langohr 2 , Jing Ning 3 , Jordi Cortés Martínez 2 ,
Guadalupe Gómez Melis 2, * and Yu Shen 3, *
 1   Department of Information & Statistics, Yonsei University, Wonju 26493, Korea; dpak@yonsei.ac.kr
 2   Departament d’Estadística i Investigació Operativa, Universitat Politècnica de Catalunya-BarcelonaTECH,
     08034 Barcelona, Spain; klaus.langohr@upc.edu (K.L.); jordi.cortes-martinez@upc.edu (J.C.M.)
 3   Department of Biostatistics, The University of Texas, MD Anderson Cancer Center, Houston, TX 77030, USA;
     jning@mdanderson.org
 *   Correspondence: lupe.gomez@upc.edu (G.G.M.); yshen@mdanderson.org (Y.S.)

 Received: 16 July 2020; Accepted: 17 September 2020; Published: 21 September 2020

 Abstract: The incubation period of coronavirus disease 2019 (COVID-19) is not always observed
 exactly due to uncertain onset times of infection and disease symptoms. In this paper, we demonstrate
 how to estimate the distribution of incubation and its association with patient demographic factors
 when the exact dates of infection and symptoms’ onset may not be observed. The findings
 from analysis of the confirmed COVID-19 cases indicate that age could be associated with the
 incubation period, and an age-specific quarantine policy might be more efficient than a unified one in
 confining COVID-19.

 Keywords: COVID-19; generalized odds-rate class of models; incubation period; infectious disease;
 interval censoring; left censoring; quarantine policy

1. Introduction
     The coronavirus disease 2019 (COVID-19) was first reported in Wuhan, China, in December 2019;
an outbreak rapidly spread worldwide. The novel virus infection can be asymptomatic or unapparent
during a certain period, and asymptomatic persons could spread the virus unknowingly [1].
Among patients who develop symptoms, the incubation period is defined as the elapsed time between
infection and the appearance of the first symptom. Knowled ge of the incubation period is essential for
disease prevention, facilitating an optimal quarantine guideline to confine the spread.
     The distribution of the incubation of COVID-19 has been investigated in several reports. In the
early outbreak, Backer et al. [2] estimated the incubation period distribution among travelers from
Wuhan, and Linton et al. [3] investigated the geographic spread of the infections from Wuhan.
Lauer et al. [4] estimated the distribution among confirmed cases outside Wuhan. The demographic
and clinical characteristics of COVID-19 in China were also discussed in Guan et al. [5]. Despite its
importance, it remains unclear how the incubation distribution could vary by age and gender.
The current 14 day quarantine period, ignoring the patient demographic factors, may be insufficient
for the containment of COVID-19. Only a few studies [6,7] addressed these concerns using a limited
amount of confirmed cases. A more accurate estimation of the incubation period using these factors is
necessary to optimize the surveillance guidelines.
     We model uncertain dates of infection and symptom onset with the best available information,
by classifying COVID-19 confirmed cases into plausible observing scenarios. The observed data are
subject to both right-censoring and left-censoring; if these censoring mechanisms are not properly
considered, the estimates for the incubation period could lead to severe biases. Ignoring the left-censoring

Mathematics 2020, 8, 1631; doi:10.3390/math8091631                         www.mdpi.com/journal/mathematics
Mathematics 2020, 8, 1631 2 of 8
tends to overestimate the incubation period. This approach allows the use of incomplete observations of
the COVID-19 incubation period and thereby provides more reliable results and inferences. A sufficiently
general parametric class, the generalized odds-rate class of regression models, is employed for modeling
the incubation period of COVID-19. This parametric class includes the log-logistic proportional odds
model and the Weibull proportional hazards model as special cases. This modeling is more flexible than
the distributions commonly used in the previous relevant work [2–8]. We also revisit the impact of the
current quarantine duration on the spread of COVID-19 by estimating the distribution of the incubation
periods of COVID-19 and its association with gender and age.
2. Exposure History Reports for Confirmed COVID-19 Cases
We outline a modeling approach to enable the analysis of publicly reported, clinically confirmed
cases with symptoms from two sources [9,10], available as of 30 March 2020. The publicly
available datasets for these two sources are freely available without permission requirement by
DXY [9] (https://docs.google.com/spreadsheets/d/e/2PACX-1vQU0SIALScXx8VXDX7yKNKWWPK
E1YjFlWc6VTEVSN45CklWWf-uWmprQIyLtoPDA18tX9cFDr-aQ9S6/pubhtml) and Xu et al. [10] (https:
//github.com/beoutbreakprepared/nCoV2019/tree/master/covid19/raw-data), respectively. To obtain
the period of potential exposure, defined as contact with infected persons or visiting contaminated regions,
we included the following patients in the analytic dataset: (1) non-residents of Wuhan who visited Wuhan
since 1 December 2019 and for whom the exposure period was the time between the earliest possible
arrival to and the latest possible departure from Wuhan; (2) people with a travel history of visiting the
coronavirus-affected nations known at the time or taking the Diamond Princess Cruises; (3) non-travel
related cases with an exposure history based on contact with infected persons. Among these, three-hundred
twelve cases had recorded exposure periods, or at least an exposure end date, and dates of symptom onset
or hospitalization, as well as gender, and age; this number reflects the removal of 34 potentially duplicated
cases (see Figure 1).
Records on Records on
DXY Xu et al
(n=3397) (n=8392)
Confirmed cases combined from two sources
(n=11789)
Cases known as residents of Wuhan
excluded due to no clear exposure periods
(n=11430)
Cases with onset/hospitalization date
and exposure ending date
(n=368)
Cases with information on age and gender
(n=349)
Unusable cases excluded: symptom onset
occurred before exposure starting date
(n=2); and all dates for the symptom
onset and exposure are the same (n=1)
Cases for analysis
(n=346)
Potentially duplicated cases
excluded (n=34): country,
Analyzed cases gender, age, date of symptom
Analyzed cases
onset, and travel history were
from DXY from Xu et al.
used for searching
(n=163) (n=183)
Combined cases
for analysis
(n=312)
Figure 1. Flow diagram of confirmed cases for data analysis. Two data sources were combined from
DXY [9] and Xu et al. [10].Mathematics 2020, 8, 1631 3 of 8
There were 111 (35.6%) cases with known exposure start and end dates, illustrated in
Supplementary Figure S1. For cases without an exact start date of the exposure period, the initial date
was set to have a maximum of thirty days of exposure or was set to 1 December 2019, whichever one
was later. In addition, the end date of exposure was set to precede the known dates of symptom
onset and hospitalization. If the exact date of symptom onset was unknown, it was assumed to have
occurred before hospitalization (i.e., left-censored).
3. Model and Estimation
The distribution of the COVID-19 incubation period is estimated with the patient related covariates
by modeling the interval-censored exposure duration and the possibly left-censored symptom onset
time. The proposed method allows us to use a larger data cohort consisting of more confirmed
COVID-19 cases; the cases may not have the exact symptom onset time (left-censored) and include
an interval-censored incubation period. We parameterize the underlying incubation period under
the generalized odds-rate class of regression models with the patient’s age and gender. Let T be the
incubation period and X be the covariate vector including both the patient’s age and gender. Within the
generalized odds-rate class of regression models, the conditional probability density function of T
given X = x is defined as:
Tβ
n Tβ
o−(1+ρ)/ρ
f (t| x) = φλ−φ tφ−1 e x 1 + ρ (t/λ)φ e x , (1)
where ρ, λ, and φ are the positive model parameters and β is the vector of the regression parameters.
The corresponding survival function is:
n T
o−1/ρ
S(t| x) = 1 + ρ (t/λ)φ e x β . (2)
This class of models includes the log-logistic proportional odds model (ρ = 1) and the Weibull
proportional hazards model (ρ → 0) as special cases [11], where survival functions are respectively
expressed as:
n T
o −1
Proportional odds model: S1 (t| x) = 1 + (t/λ)φ e x β , and
φ exT β
Proportional hazard model: S2 (t| x) = e−(t/λ) .
To construct the likelihood function of COVID-19 data from (1) and (2), we distinguish the four
types of observation, as shown in Figure 2. Let d denote the difference between the exposure start
date and end date and r denote the difference between the exposure end date and either the symptom
onset date (if available) or the date of hospitalization. If the date of infection is at best known to be
within a potential exposure period (i.e., d > 0), let δd = 1; otherwise, δd = 0. If a patient’s symptom
onset date was observed, let δs = 1; otherwise, δs = 0. Under the assumption of a uniform risk
for infection during the potential exposure periods, the contributions of each type to the likelihood
function, defined as L1 , L2 , L3 , and L4 , respectively, are given as follows:
• Type I: observing potential exposure period and symptom onset date (δd = 1 and δs = 1):
Z d
L 1 = d −1 f ( a + r | x)da = d−1 {S(r | x) − S(r + d| x)} ,
0
• Type II: observing potential exposure period and hospitalization date (δd = 1 and δs = 0):
Z d Z d
L 2 = d −1 {1 − S( a + r | x)} da = 1 − d−1 S( a + r | x)da,
0 0Mathematics 2020, 8, 1631 4 of 8
• Type III: observing exact exposure date and symptom onset date (δd = 0 and δs = 1):
L3 = f (r | x ),
• Type IV: observing exact exposure date and hospitalization date only (δd = 0 and δs = 0):
L4 = 1 − S (r | x ),
where a is the variable of integration representing the unknown period from the infection to the
exposure end.
Considering n independent observations, the overall log-likelihood is then proportional to:
n
log L = ∑ δsi δdi log L1i + (1 − δsi )δdi log L2i + δsi (1 − δdi ) log L3i + (1 − δsi )(1 − δdi ) log L4i
i =1
n h Z d
i
∝ ∑ δsi δdi log {S(ri | xi ) − S(ri + di | xi )} + (1 − δsi )δdi log 1 − di−1 S( a + ri | xi )da
i =1 0
i
+ δsi (1 − δdi ) log f (ri | xi ) + (1 − δsi )(1 − δdi ) log {1 − S(ri | xi )} . (3)
The model parameters are estimated by maximizing the log-likelihood (3). In our implementation,
we maximized the log-likelihood with the logarithmic transformation for the positive parameters
(i.e., λ, φ, and ρ). The delta method was used to obtain the asymptotic normal distribution for any
parameter transformation, such as the median incubation time. All analyses were performed with R
Version 3.6.1 [12]. The R code is provided in the Supplementary Material.
Type I: observing potential exposure period and symptom onset date (235 patients)
Incubation period
Type II: observing potential exposure period and hospitalization date (60 patients)
Type III: observing exact exposure date and symptom onset date (16 patients)
Type IV: observing exact exposure date and hospitalization date only (1 patient)
Exposure period/date Infection Symptom onset Hospitalization
Observed Unobserved
Figure 2. The four types of observations available for the data analysis. The total number of patients is 312.Mathematics 2020, 8, 1631 5 of 8
4. Application
We applied the proposed method to the COVID-19 datasets, described in Section 2. Within the
total of 312 patients, the median age was 42 (interquartile range 33–55) years, and 126 (40.4%)
patients were women. The summary statistics and the histogram for patient’s age are shown in
Supplementary Table S1 and Figure S2. The positive association between age and the duration of
incubation was observed from the model with age as a continuous variable (Supplementary Table S2).
Age was dichotomized at its median prior to the analysis. Table 1 shows the estimation results for
regression models with gender and age. An interaction between age and gender was not statistically
significant in the model. Patients older than 42 years of age have, on average, longer incubation
periods, compared to 42-year-old or younger patients ( p = 0.039), whereas gender has no effect on the
incubation period ( p = 0.423). We decided not to include gender in the final model (reduced model of
Table 1), based on the likelihood ratio test with p = 0.384. For the outbreak period from December 2019
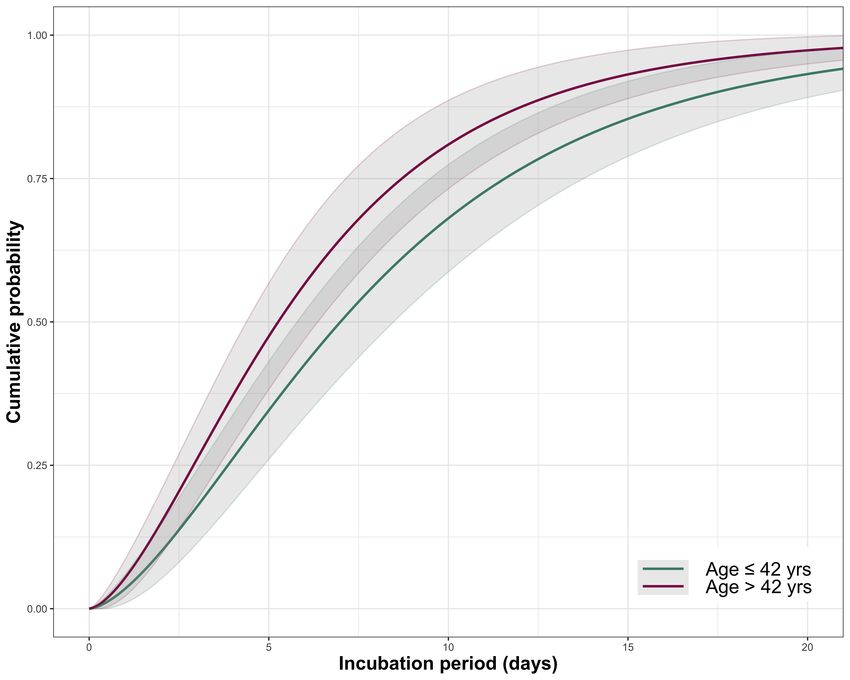
to March 2020, the median incubation times are estimated to be 5.3 (95% CI: 4.3–6.3) days and 7 (95% CI:
5.6–8.3) days among younger (≤42 years) and older patients (>42 years), respectively. During this
outbreak period, the mean incubation period is estimated to be 6.6 (95% CI: 5.4–7.8) days for the
younger patients and 8.8 (95% CI: 7.2–10.3) days for the older patients. The estimated distribution
functions in both age groups together with the 95% confidence intervals are presented in Figure 3.
Table 2 shows the estimated differences (in days) between the quantiles of the incubation distribution
in both age groups. The incubation period difference between the two age groups was not obvious
in lower quantiles, but it became conspicuous after the 25th quantile, leading to about seven day
differences between the two age groups at the 97.5th quantile.
Table 1. Results of the analysis of COVID-19 under the generalized odds-rate class of regression models.
Model * log (λ) log (φ) log (ρ) β male β age≤42
Estimate 2.300 0.305 −3.766 0.141 0.371
Full model SE 0.155 0.119 6.569 0.176 0.180
p-valueMathematics 2020, 8, 1631 6 of 8
Figure 3. The estimated cumulative distribution of the incubation period by two age groups.
5. Discussion
The finding that persons older than 42 years have, on average, longer incubation periods
than those who are younger may have important implications for enacting age-specific quarantine
policies. This result agrees with previous studies on severe acute respiratory syndrome that showed
a relationship between age and the incubation period [13]. Using the uniform 14 day quarantine
policy recommended by the World Health Organization and the U.S. Centers for Disease Control
and Prevention [14,15], our estimators imply that 8.4% (95% CI: 3.6–13.1%) of COVID-19 patients
younger than 42 and 17.1% (95% CI: 9.9–24.2%) of older patients may pose a risk of infection to
others before onset of their symptoms. Using a 21 day quarantine, these percentages reduce to
2.2% (95% CI: 0–7.0%) and 5.8% (95% CI: 1.3–13.0%), respectively. To ensure that at least 90% of cases’
symptoms are being manifested during quarantine periods, the required durations are estimated to be
13.1 (95% CI: 10.5–15.7) days for patients 42 years of age or younger and 17.4 (95% CI: 14.0–20.8) days
for patients older than 42 years. As such, a unified quarantine policy could be inefficient during a viral
outbreak. These estimates were derived from the conservative assumption that the quarantine periods
started immediately after infection.
To examine how robust the estimates were to the assumption of 30 days of maximum exposure
for cases with a missing start date of exposure interval, we performed some sensitivity analyses
considering a maximum exposure duration of 20 days or shifting the lower bound back and
forth within 15 days. The variation of these assumptions had little effect on the analysis results
(Supplementary Table S3). Although the proposed method assumes that the infection would happen
uniformly during the potential exposure period, it can be easily modified with other forms of risk for
various purposes.
The application to the COVID-19 datasets has some notable limitations. Our inferences relied
on publicly reported confirmed cases that might over represent more severely symptomatic patients.
Moreover, the definition of COVID-19 symptoms and hospitalization criteria could differ by country,
especially during the initial outbreak. We combined the datasets from two different sources, and the
potential variation in source criteria for tracing infected cases may lead to different exposure records.
However, we obtained similar findings when fitting the model to each dataset separately. The sameMathematics 2020, 8, 1631 7 of 8
trend was observed for the incubation period by the age groups (Supplementary Tables S4 and S5),
though one indicated no statistically significant difference. We dichotomized age to show the difference
in the incubation period time that might exist between the two groups. However, in no case was it our
goal to identify an optimal cut-off age, since we are aware of the risks involved in the dichotomization
of the explanatory variables [16,17].
The longer incubation periods experienced by older patients might have been due to a
delayed immune response system, given the mechanism of immune systems against COVID-19 [18].
However, the results may not be directly applicable to affect the public health policy globally,
because the distribution of the incubation period could differ by other factors such as case reporting
system and co-infection levels in different regions and countries. There is also a possibility that the
virus evolves to be more or less lethal and transmissible over time [19]. As one referee commented,
co-morbidities and medical history would be informative to further investigate their association with
the incubation period of COVID-19. They could be directly incorporated in our model as covariates.
Unfortunately, our data sources do not include such information; thus, we cannot investigate those
effects on the incubation period.
Supplementary Materials: The following are available online at http://www.mdpi.com/2227-7390/8/9/1631/s1.
Author Contributions: Conceptualization, D.P., G.G.M., J.N., and Y.S.; methodology, D.P., J.N., and Y.S.;
formal analysis, D.P., K.L., J.N., and J.C.M.; writing, original draft preparation, D.P., G.G.M., J.N., and Y.S.
All authors read and agreed to the published version of the manuscript.
Funding: This research was funded by the Ministerio de Ciencia e Innovación (Spain) (PID2019-104830RB-I00),
the Ministerio de Economía y Competitividad (Spain) (MTM2015-64465-C2-1-R (MINECO/FEDER)), and the
Departament d’Economia i Coneixement de la Generalitat de Catalunya (Spain) (2017 SGR 622 (GRBIO)).
Conflicts of Interest: The authors declare no conflict of interest.
References
1. Wilson, M.E.; Chen, L.H. Travellers Give Wings to Novel Coronavirus (2019-NCoV). J. Travel Med.
2020, 27, taaa015. [CrossRef]
2. Backer, J.A.; Klinkenberg, D.; Wallinga, J. Incubation Period of 2019 Novel Coronavirus (2019-NCoV)
Infections among Travellers from Wuhan, China, 20–28 January 2020. Eurosurveillance 2020, 25, 1–6.
[CrossRef] [PubMed]
3. Linton, N.M.; Kobayashi, T.; Yang, Y.; Hayashi, K.; Akhmetzhanov, A.R.; Jung, S.-M.; Yuan, B.;
Kinoshita, R.; Nishiura, H. Incubation Period and Other Epidemiological Characteristics of 2019 Novel
Coronavirus Infections with Right Truncation: A Statistical Analysis of Publicly Available Case Data.
J. Clin. Med. 2020, 9, 538. [CrossRef]
4. Lauer, S.A.; Grantz, K.H.; Bi, Q.; Jones, F.K.; Zheng, Q.; Meredith, H.R.; Azman, A.S.; Reich, N.G.; Lessler, J.
The Incubation Period of Coronavirus Disease 2019 (COVID-19) From Publicly Reported Confirmed Cases:
Estimation and Application. Ann. Intern. Med. 2020, 172, 577–582. [CrossRef]
5. Guan, W.; Ni, Z.; Hu, Y.; Liang, W.; Ou, C.; He, J.; Liu, L.; Shan, H.; Lei, C.; Hui, D.S.C.; et al.
Clinical Characteristics of Coronavirus Disease 2019 in China. N. Engl. J. Med. 2020, 382, 1708–1720.
[CrossRef]
6. Kong, T.K. Longer incubation period of coronavirus disease 2019 (COVID-19) in older adults. Aging Med. 2020,
3, 102–109. [CrossRef] [PubMed]
7. Jiang, A.B.; Lieu, R.; Quenby, S. Significantly Longer Covid-19 Incubation Times for the Elderly, from a Case
Study of 136 Patients throughout China. medRxiv 2020. [CrossRef]
8. Yang, L.; Dai, J.; Zhao, J.; Wang, Y.; Deng, P.; Wang, J. Estimation of Incubation Period and Serial Interval of
COVID-19: Analysis of 178 Cases and 131 Transmission Chains in Hubei Province, China. Epidemiol. Infect.
2020, 148, e117. [CrossRef] [PubMed]
9. DXY: COVID-19 Epidemic Situation in Real Time. Available online: https://docs.google.com/spreadsheets
/d/e/2PACX-1vQU0SIALScXx8VXDX7yKNKWWPKE1YjFlWc6VTEVSN45CklWWf-uWmprQIyLtoPDA
18tX9cFDr-aQ9S6/pubhtml (accessed on 20 March 2020).Mathematics 2020, 8, 1631 8 of 8
10. Xu, B.; Gutierrez, B.; Mekaru, S.; Sewalk, K.; Goodwin, L.; Loskill, A.; Cohn, E.L.; Hswen, Y.; Hill, S.C.;
Cobo, M.M.; et al. Epidemiological Data from the COVID-19 Outbreak, Real-Time Case Information. Sci Data
2020, 7, 106. [CrossRef] [PubMed]
11. Dabrowska, D.M.; Doksum, K.A. Estimation and Testing in a Two-Sample Generalized Odds-Rate Model.
J. Am. Stat. Assoc. 1988, 83, 744–749. [CrossRef]
12. R Core Team. R: A Language and Environment for Statistical Computing; R Foundation for Statistical Computing:
Vienna, Austria, 2019. Available online: https://www.R-project.org/ (accessed on 30 April 2020).
13. Cowling, B.J.; Muller, M.P.; Wong, I.O.L.; Ho, L.-M.; Louie, M.; McGeer, A.; Leung, G.M. Alternative Methods
of Estimating an Incubation Distribution: Examples from Severe Acute Respiratory Syndrome. Epidemiology
2007, 18, 253–259. [CrossRef] [PubMed]
14. World Health Organization (WHO). Considerations for Quarantine of Individuals in the Context of
Containment for Coronavirus Disease (COVID-19). Available online: https://www.who.int/publications-d
etail/considerations-forquarantine-of-individuals-in-the-context-of-containment-forcoronavirus-disease
-(covid-19) (accessed on 12 April 2020)
15. The White House. Press Briefing by Members of the President’s Coronavirus Task Force. Available online:
https://www.whitehouse.gov/briefings-statements/press-briefing-members-presidents-coronavirus-tas
k-force (accessed on 1 February 2020).
16. Moons, K.G.; Altman, D.G.; Reitsma, J.B.; Ioannidis, J.P.; Macaskill, P.; Steyerberg, E.W.; Collins, G.S.
Transparent Reporting of a multivariable prediction model for Individual Prognosis or Diagnosis (TRIPOD):
Explanation and elaboration. Ann. Intern. Med. 2015, 162, W1–W73. [CrossRef] [PubMed]
17. Royston, P.; Altman, D.G.; Sauerbrei, W. Dichotomizing continuous predictors in multiple regression: A bad
idea. Stat. Med. 2006, 25, 127–141. [CrossRef] [PubMed]
18. Chowdhury, M.A.; Hossain, N.; Kashem, M.A.; Shahid, M.A.; Alam, A. Immune response in COVID-19:
A review. J. Infect. Public Health 2020, in press. [CrossRef] [PubMed]
19. Van Dorp, L.; Acman, M.; Richard, D.; Shaw, L.P.; Ford, C.E.; Ormond, L.; Owen, C.J.; Pang, J.;
Tan, C.C.S.; Boshier, F.A.T.; et al. Emergence of Genomic Diversity and Recurrent Mutations in SARS-CoV-2.
Infect. Genet. Evol. 2020, 83, 104351. [CrossRef] [PubMed]
c 2020 by the authors. Licensee MDPI, Basel, Switzerland. This article is an open access
article distributed under the terms and conditions of the Creative Commons Attribution
(CC BY) license (http://creativecommons.org/licenses/by/4.0/).You can also read