Technical Advisory Cell Summary of Advice - 9th April 2021 - GOV.WALES
←
→
Page content transcription
If your browser does not render page correctly, please read the page content below

Technical Advisory Cell
Summary of Advice
9th April 2021

 © Crown copyright 2021
TAG ADVICE ONLY NOT WELSH GOVERNMENT POLICY
Technical Advisory Cell: Summary of Advice
09 April 2021
Top-line summary
The most recent estimate of the Rt for Wales from SAGE on 7 April is between
0.6 and 0.9 (90% confidence interval) and has been below, but close to 1 for
twelve weeks. As at 2 April, Rt estimated by Public Health Wales (PHW) which
is less lagging but uses case data only, is 0.6 (95% confidence interval: 0.6 to
0.7).
Case numbers continue to decrease, with more than half of Wales’ local
authorities now in the lowest case threshold (less than 15 cases per 100k) and
at a national level Wales is at 17.6 cases per 100k, the second lowest case
threshold, for the first time since the beginning of September when cases first
began to rise following the summer. Following the peak of the first wave on 10
April this level was first seen on June 3 2020, marking the beginning of proposals
to allow the public to safely use a range of outdoor spaces.
As reported by PHW, as at 11 April over 1.5M first doses of COVID-19 vaccine
and over 500,000 second doses have been given in Wales.
As reported by PHW in the most recent week, case incidence has decreased or
remained stable in all age groups with the exception of those aged 90+, which
saw a small increase and currently has the highest rates at 49 cases per 100k
compared to the next highest group 30-39 at 30 cases per 100k.
For the week of 28 to 3 April 2021, the COVID-19 infection survey estimates that
around 1 in 800 (95% credible interval: 1 in 1,630 to 1 in 470) people in the
community population had COVID-19. Rates have decreased in Wales in the
most recent week.
Confirmed cases of COVID-19 in hospital and ICU beds continue to decrease
and are at levels last seen in September 2020. COVID-19 deaths reported by
PHW rapid mortality surveillance up to 31 March are stable, with a 10 deaths
reported for the preceding 7 day period.
As at 7 April, VOC-20DEC-01 (B.1.1.7, first identified in the UK) remains the
dominant variant in Wales. There have been 26 genomically confirmed and
probable cases of VOC-20DEC-02 (B.1.351, the variant linked to South Africa)
and six cases of the variant VUI-21FEB-03 (B.1.525, linked to Nigeria). One case
of the variant VUI-21JAN-01 (P.1, first identified in Brazil via Japan) has been
identified in Wales.
Page 2 of 20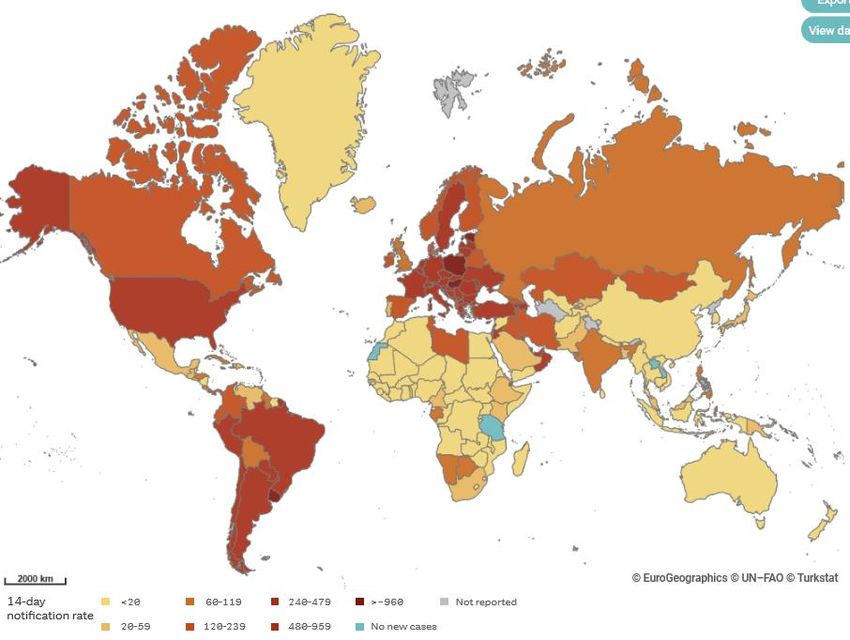
TAG ADVICE ONLY NOT WELSH GOVERNMENT POLICY
TAC/ SAGE papers published this week:
Technical Advisory Group: Advice for 31 March Restriction Review
Technical Advisory Group: the potential risks and benefits of removing
restrictions in a phased approach to mitigate the impact of harms from Covid-19
in Wales
Technical Advisory Group: statement on priority considerations relating to
personal protective behaviours to inform decisions on easing of restrictions in
Spring 2021
Technical Advisory Group: COVID-19 evidence associated with transmission
and potential risks associated with religious activities and places of worship
SAGE 85 minutes: Coronavirus (COVID-19) response, 31 March 2021
SAGE: UKOSS/ISARIC/CO-CIN: Females in Hospital with SARS-CoV-2
infection, the association with pregnancy and pregnancy outcomes, 25 March
2021
SAGE: ONS: Differential impacts of the Coronavirus pandemic on men and
women, 24 March 2021
SPI-M-O: Medium-term projections, 24 March 2021
SAGE: Dynamic CO-CIN report to SAGE and NERVTAG (recent cases), 25
March 2021
SPI-M-O: Consensus statement on COVID-19, 24 March 2021
SAGE COVID-19 Ethnicity subgroup: Interpreting differential health outcomes
among minority ethnic groups in wave 1 and 2, 24 March 2021
SAGE 84 minutes: Coronavirus (COVID-19) response, 25 March 2021
SPI-M-O: Medium-term projections, 17 March 2021
SPI-M-O: Consensus statement on COVID-19, 17 March 2021
SAGE: COG-UK: Impact of travel restrictions on importations to England from
May to September 2020, 16 March 2021
SPI-M-O: Statement on daily contact testing, 3 March 2021
Page 3 of 20
TAG ADVICE ONLY NOT WELSH GOVERNMENT POLICY
Reproduction number and Growth Rate
SAGE estimate
The most recent estimate of the Rt for Wales from SAGE on 7 April is
between 0.6 and 0.9 (90% confidence interval).
The most recent daily growth rate for Wales from SAGE estimates that the
infection rate in Wales is shrinking by between -6% and -1% per day (90%
confidence interval).
Particular care should be taken when interpreting estimates for Wales as they
are based on low numbers of cases and / or dominated by clustered outbreaks
and so should not be treated as robust enough to inform policy decisions alone.
The Reproduction number (Rt) is the average number of secondary infections
produced by a single infected individual. Rt is an average value over time,
geographies, and communities. This should be considered when interpreting the
Rt estimate for the UK given the differences in policies across the four nations.
The estimate of Rt is shown as a range (90 or 95% confidence intervals) without
a central estimate and is a lagging indicator.
Growth rate reflects how quickly the numbers of infections are changing day by
day. It is an approximation of the percentage change in the number of infections
each day. Growth rate is also a lagging indicator and shown as a range (90 or
95% confidence intervals) without a central estimate. Figures are shown as either
doubling if R is above 1, or halving if Rt is below 1.
Care should be taken when interpreting Rt and growth rate estimates for the UK,
due to their inherently lagged nature, their correlation with testing incidence and
that national estimates can mask regional variation in the number of infections
and rates of transmission.
For more information on the models that are used to create the SPI-M/ SAGE
consensus on R, please see the UK Government website.
Public Health Wales (PHW) Rt estimate
PHW also estimate Rt for Wales using data on the number of positive cases only
for the last 7 day rolling period. Like the SAGE estimate these figures should be
interpreted with caution as the number of positive cases detected can be a
reflection of the amount of testing. It is assumed there is no change in testing
patterns for the duration of these estimates.
Halving times have also been calculated using 14 days of rolling data. The most
recent 3 days of data were excluded to account for testing and reporting lag.
Predictions were then extended. The R package “Incidence” was used to
calculate doubling times. https://www.repidemicsconsortium.org/incidence
As at 7 April, PHW estimates Rt in Wales to be 0.6 (95% CI: 0.6 to 0.7). The
growth rate time is estimated to be halving every 12 days (95% CI: 7 to 28).
Page 4 of 20
TAG ADVICE ONLY NOT WELSH GOVERNMENT POLICY
Case numbers
The figure below shows weekly COVID-19 cases per 100k population (7 day
rolling sum). The most recent data up to 6 April shows a decrease in cases to
17.6 cases per 100k population, a 42% decrease from the previous 7 day
period.
Source: Data from PHW
Age profile
The Figure below shows the number of weekly cases per 100,000 population, by
age group and local authority up to 5 April. Incidence has decreased or remained
stable in most age groups, although there has been a small increase in those
aged 90+, which also has the highest number of cases.
Source: Data from PHW
Deaths
The figure below shows the 7 day rolling sum of COVID-19 deaths reported by
PHW rapid mortality surveillance up to 6 April, with 10 deaths for the preceding
7 day period.
Page 5 of 20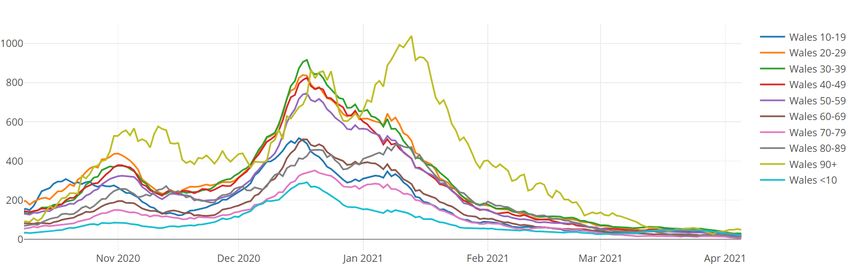
TAG ADVICE ONLY NOT WELSH GOVERNMENT POLICY
It is important to note that PHW death data is limited to reports of deaths of
hospitalised patients in Welsh hospitals or care homes where COVID-19 has
been confirmed with a positive laboratory test and the clinician suspects COVID-
19 was a causative factor. It does not include patients who may have died from
COVID-19 but who were not confirmed by laboratory testing, those who died in
other settings, or Welsh residents who died outside of Wales as a result the true
number of deaths will be higher.
Source: Data from PHW
ONS: Deaths registered weekly in England and Wales
The Office for National Statistics (ONS) reports on both suspected and confirmed
COVID-19 deaths using data available on completion of the death registration
process and is more complete, albeit subject to a greater time lag. Figures are
based on the date the death was registered, not when it occurred. There is
usually a delay of at least five days between occurrence and registration.
In Wales, the total number of deaths registered increased from 621 in the
previous week to 651 in the week ending 26 March; this was the first increase
in total deaths since Week 7, however, total deaths remained below the five-
year average for a fourth consecutive week (3.8% below).
In Wales, the number of weekly registered deaths involving COVID-19 continued
to decrease from 49 to 32, accounting for 4.9% of all deaths compared with 7.9%
the previous week.
Source: ONS, Deaths registered weekly in England and Wales, provisional:
week ending 26 March 2021
Wales Local Authority Update
Recent surveillance data for Wales for the 7 day period ending 6 April suggests
that COVID-19 case incidence across almost all of Wales is decreasing and
more than half are in the lowest case threshold (see below table).
Page 6 of 20
TAG ADVICE ONLY NOT WELSH GOVERNMENT POLICY
Case incidence per 100,000 population for the whole of Wales during this
period was 17.6, a 43% decrease from the previous period. Cases for all-
Wales are now in the 15 to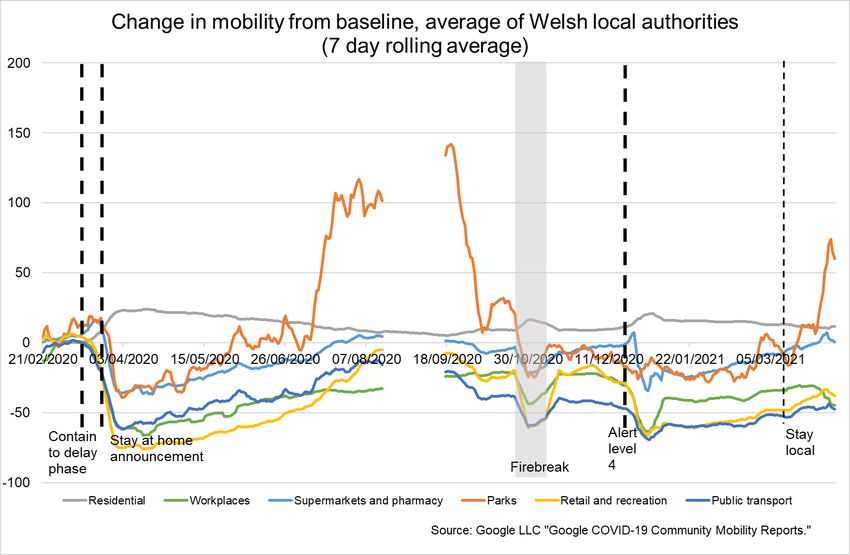
TAG ADVICE ONLY NOT WELSH GOVERNMENT POLICY
International update
Europe
Source: European Centre for Disease Control
In most European countries which experienced recent rapid increases, the
imposition of tighter or extended NPI controls has had the desired effect and
case rates have stabilised or are starting to fall. In most cases, the recent
increases have been driven by the United Kingdom VOC. Western Europe is
maintaining its recovery from the earlier peaks with Portugal, Spain, UK and
Ireland all showing very low rates comparatively. Overall, the vaccination
programmes in Europe are beginning to accelerate and some countries are
getting to point where some level of protection will be beginning to have an
effect, especially among the target groups (elderly, vulnerable) but this is not to
say that these countries are anywhere near being able to relax conventional
NPI controls to any appreciable extent.
Page 8 of 20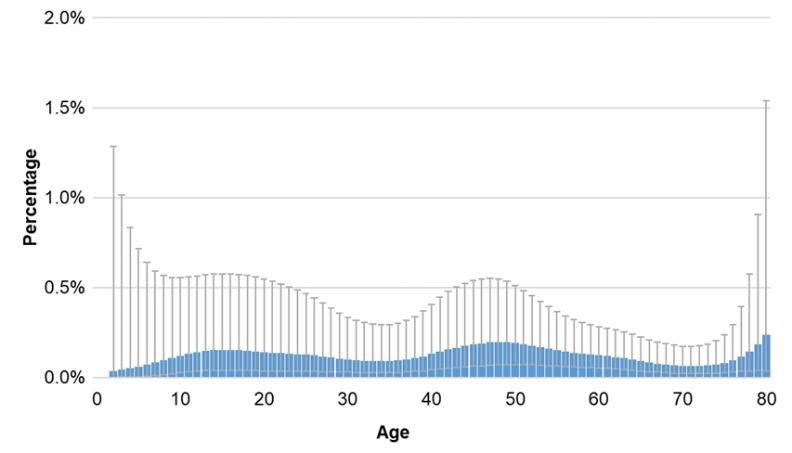
TAG ADVICE ONLY NOT WELSH GOVERNMENT POLICY
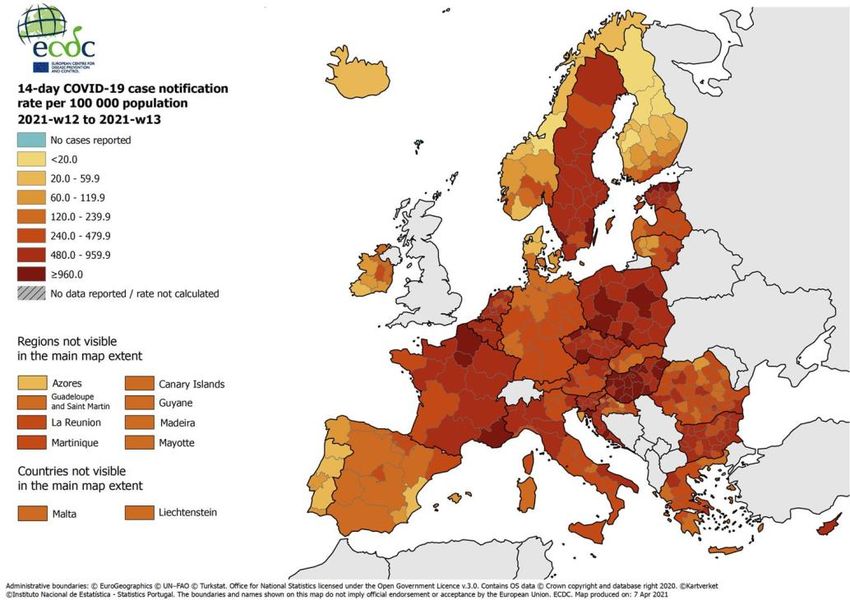
Worldwide
Source: European Centre for Disease Control
Case rates in the Americas are high although with signs of stabilisation in Brazil
but conversely, Chile is showing strong signs of deterioration and Argentina has
experienced a very rapid rise with cases doubling to their highest ever level in
just the last three weeks.
Elsewhere, over the last four weeks, India and Bangladesh have experienced
probably the fastest rising rates of infection experienced by any country so far;
in India, daily new cases have risen by more than 6 fold, from 24,000 per day to
over 150,000 per day in the last four weeks. Bangladesh has seen similar rates
of increase but the totals are smaller due to a smaller population. These are
concerning developments as the daily death rate is only now starting to
respond in a similar manner, although so far India has not experienced the
same proportion of deaths to cases ratio experienced by many other countries
but it is too early to say whether this is an artefact due to recording of data or
the natural delay in deaths, or some other factor. These increases are thought
to be due to a mixture of reduced NPI controls adherence and the new variants
– the UK variant and India’s own new variant but the available data does not
support a definitive conclusion.
Page 9 of 20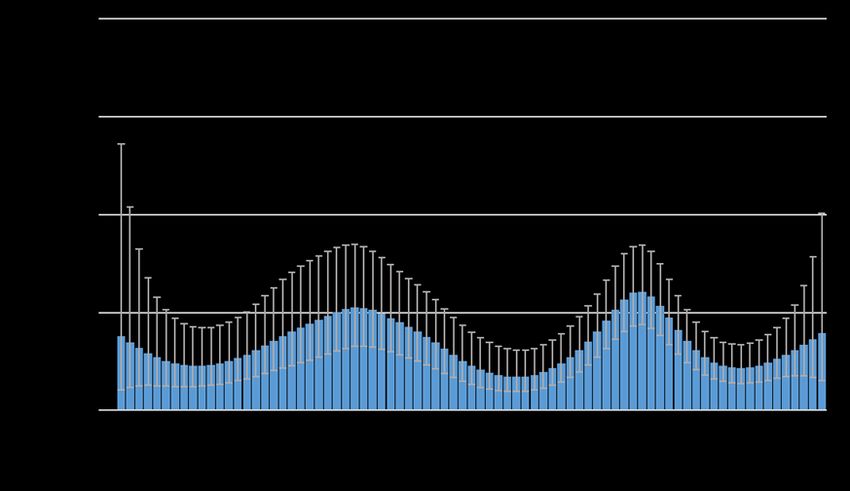
TAG ADVICE ONLY NOT WELSH GOVERNMENT POLICY
Vaccination trends
Source: Our World in Data
Vaccine rollout is ramping up in most countries where available. Israel’s rate of
vaccination is slowing as they currently are rolling out second doses to the
younger cohorts. The difference the UK vaccination strategy has made can be
seen by the share of people who have received at least one dose.
Covid-19 Infection Survey results (Office for National Statistics)
The latest estimates for Wales from the Coronavirus (COVID-19) Infection
Survey (CIS) have been published on the Welsh Government statistics and
research web pages and the Office for National Statistics website. The results
Page 10 of 20TAG ADVICE ONLY NOT WELSH GOVERNMENT POLICY
include estimates for the number and proportion of people in Wales that had
COVID-19 in the latest week, 28 March to 3 April 2021.
Because the number of positive cases detected is low compared with the total
survey sample there is uncertainty with the estimates. The figures are provided
with 95% credible or confidence intervals to indicate the range within which we
may be confident the true figure lies.
Estimates are provided for the ‘community population’, i.e. private households
only; residents in care homes, communal establishments and hospitals are not
included.
Please note that there is a greater lag in data from the infection survey than from
other sources such as Public Health Wales.
It is important to stress the uncertainty around these figures. Since the survey
picks up relatively few positive tests overall, the results can be sensitive to small
changes in the number of these positive tests.
Latest estimates and recent trends for Wales:
For the week 28 March to 3 April 2021, an average of 0.12% of the community
population had COVID-19 (95% credible interval: 0.06% to 0.21%).
This equates to approximately 1 person in every 800 (95% credible interval: 1
in 1,630 to 1 in 470), or 3,800 people during this time (95% credible interval:
1,900 to 6,500).
The trend in the percentage of people testing positive in Wales has decreased
in the most recent two weeks.
In the most recent week, the percentage of cases compatible with the UK
variant has decreased. The trend is uncertain for people testing positive for
strains not compatible with the variant and cases where the virus is too low
for the variant to be identifiable.
Latest estimates for the UK countries
At the midpoint of the most recent week (28 March to 3 April 2021) the highest
estimated percentages of the community population with COVID-19 among the
nations of the UK was in Northern Ireland (0.33%) and England (0.30%) whilst
Wales appeared to have the lowest.
In the most recent week, rates have decreased in Wales and Scotland, whilst
the trend was level in Northern Ireland. There was sign of an early increase in
England in the most recent week.
Page 11 of 20TAG ADVICE ONLY NOT WELSH GOVERNMENT POLICY
Positivity rates (%) across UK countries since 21 February 2021
Source: Coronavirus (COVID-19) Infection Survey, Office for National Statistics
Age analysis:
Rates of positive cases vary by age, but appear to have decreased in all age
groups in recent weeks. The biggest decreases were seen in participants aged
20 to 40 and aged 65 to 70.
In the data used to produce these estimates, the number of people sampled in
the different ages who tested positive for COVID-19 was lower relative to Wales
overall. This means there is a higher degree of uncertainty in estimates for
individual age groups over this period.
Caution should be taken in over-interpreting any small movements in the latest
trend, particularly where credible intervals are large.
The percentage testing positive by The percentage testing positive by
age on 24 February 2021 age on 31 March 2021
Source: Coronavirus (COVID-19) Infection Survey, Office for National Statistics
Page 12 of 20TAG ADVICE ONLY NOT WELSH GOVERNMENT POLICY
Modelled incidence estimates in Wales
The incidence of new infections (the number of new infections in a set period of
time) helps us understand the rate at which infections are growing within the
population and supports the main measure of positivity (how many people test
positive at any time, related to prevalence) to provide a fuller understanding of
the coronavirus (COVID-19) pandemic.
In Wales, during the week ending 27 March 2021, we estimate that there were
1.10 new PCR-positive coronavirus (COVID19) cases per 10,000 people per day
(95% credible interval: 0.16 to 2.24). This equates to 330 new positive cases in
Wales per day (95% credible interval: 50 to 680).
Incidence of new positive cases appears to have been level in recent weeks,
although credible intervals are wide due to the smaller sample size, and care
should be taken in interpreting results. When prevalence is very low it may not
be possible to produce a reliable estimate.
Source: Coronavirus (COVID-19) Infection Survey, ONS
Vaccination in Wales
Whilst numbers will be higher due to ongoing data entry, as at 11 April 2021
1,572,752 first doses of COVID-19 vaccine have been given in Wales and
525,177 second doses have been given.
Source: PHW Covid-19 Rapid Surveillance Dashboard
Page 13 of 20TAG ADVICE ONLY NOT WELSH GOVERNMENT POLICY
Adherence and understanding of current measures
The data from IPSIS MORI is the same as last week.
The most recent IPSOS MORI data for the period 26 – 30 March for Wales shows
reductions in some categories compared to the last survey wave which was 4
weeks prior (26 February - 1 March). Most notably a reduction in those making
essential trips only – this follows the change in guidance from stay at home in
the last survey to being able to travel within Wales/staying local. It should be
noted that this is self-reported adherence and will be affected by individuals
understanding of the rules and the circumstances that apply to them. Some
restrictions were lifted on 27 March, during the data collection period, as a result
of the 12 March review cycle (e.g. stay local requirement and first phased
reopening of the tourist sector).
The figure below represents data collected online by IPSOS MORI as part of a
multi-country survey on the Global Advisor platform. Each of the waves has
included c.500 respondents in Wales. The sample is broadly representative of
the adult population aged 16-74. Data is weighted to reflect the age and gender
profile of the Welsh population aged 16-74. All samples have a margin of error
around them. For a sample of around 500, this is +/- 4.8 percentage points.
Mobility
The most recent mobility data covers the Easter weekend, and shows reductions
in mobility compared to the previous week (with increases in those staying at
home/residential). However, mobility has steadily increased since the change in
guidance to stay local on 13 March.
Page 14 of 20TAG ADVICE ONLY NOT WELSH GOVERNMENT POLICY
Mobility of Facebook users in Wales shows movement was 14% below the
baseline for the week to the 10 April. This is lower than the week before (9%).
The percentage of users staying put (near to home) was 29%, up from the week
before (27%). The baseline is the average value, for the corresponding day of
the week, during the 4-week period 2 February – 29 February 2020.
Apple data for the week to the 10 April shows that requests for driving directions
in Wales were lower than the previous week at 6% above the baseline (down
from 10% above the baseline). Requests for walking directions and requests for
public transport directions also decreased compared to the previous week
relative to the baseline. The baseline is the 13th of January 2020.
The Google mobility data to the week of the 7 April for residential (i.e people
spending time at home) were higher than the week before at 12% above the
baseline (up from 11%). Workplaces fell relative to the baseline by 11 percentage
points (at 45% below the baseline). Note that the week to the 7 April includes two
bank holidays during the Easter period. Retail & recreation mobility was down
from the previous week (38% below the baseline, down from 36%) and
supermarkets & pharmacy also fell (at 1% above the baseline, down from 2%
above). Public transport mobility was unchanged whilst parks increased over the
week relative to the baseline.
The figure below shows the change in mobility in Wales using Google mobility
data. The figures are based on the average of the local authorities that have data.
The baseline is the median value, for the corresponding day of the week, during
the 5-week period Jan 3–Feb 6, 2020. The data for several categories is not
available for August 16th – September 10th due to the data not meeting quality
thresholds.
Page 15 of 20TAG ADVICE ONLY NOT WELSH GOVERNMENT POLICY
Anonymised and aggregated mobile phone data from O2 for the week to the 2
April shows an increase in trips compared to the week before. Trips starting in
Wales rose by 3 percentage points to 70% of the baseline. The baseline for the
O2 data is the same day of the week in the first week of March.
COVID-19 weekly surveillance and epidemiological summary from PHW
(as at 7 April)
The proportion of calls to NHS 111 and NHS Direct related to possible COVID-
19 symptoms has slightly increased compared to the previous week.
Overall GP consultations for any Acute Respiratory Infection (ARI) and
suspected COVID consultations have decreased in the most recent week.
The overall number of ambulance calls and calls possibly related to COVID- have
increased in the most recent week.
The all-Wales number of lab confirmed COVID-19 episodes has decreased in
the most recent week. Sample positivity for testing episodes was 2.2% in week
13.
Confirmed case incidence has decreased or remained stable in all regions of
Wales. Testing episode positivity continues to decrease nationally.
During week 13, incidence decreased or remained stable in all age groups.
Incidence per 100,000 population was highest in those aged 26-44 years and
those aged 85y+.
Page 16 of 20TAG ADVICE ONLY NOT WELSH GOVERNMENT POLICY
At a national level, confirmed case admissions to hospitals and confirmed cases
who are inpatients in hospital decreased compared to the previous week. In the
most recent week, admissions to critical care wards also decreased compared
to the previous week.
Recent surveillance data suggest that COVID-19 infections in Wales are
decreasing in most regions of Wales. Cases remain geographically widespread,
however the majority of local authority (LA) areas are seeing decreasing overall
trends in confirmed case incidence in the most recent week.
Although the distribution of cases at MSOA level in the most recent week still
suggests geographically wide-spread activity, the number of MSOAs with
confirmed cases and the number of cases per MSOA continue to decrease.
There was a small increase in the number of incidents in the most recent week.
From 22nd February, children aged three to seven began to return to school in a
phased manner. According to Welsh Government guidance, from 15th March, all
remaining primary school children were able to return to learning onsite, along
with learners in qualifications years, and more learners in colleges and training.
Children of critical workers remain able to receive face to face learning on school
sites. Confirmed case incidence remained stable in those agedTAG ADVICE ONLY NOT WELSH GOVERNMENT POLICY
For the most recent 7 day period the average weekly hospital occupancy was
98, a 21% reduction from the previous period.
The Figure below shows the invasive ventilated bed occupancy of confirmed
COVID-19 positive patients (7 day rolling average, as at 31 March).
For the most recent 7 day period the average ICU occupancy was 15, a 6%
reduction from the previous period.
The number of people recovering from COVID-19 also continues to decrease
overall and is at 375 as at 8 April a 14% reduction from the previous week.
The Figure below shows the number of people admitted to hospital who are either
suspected or confirmed as having Covid-19 (COV+). The purple line represents
the total number over a rolling 7 day average, whilst the fainter grey lines show
the actual figures at that time.
The 7 day daily average hospital admissions as at 9 April was 18, a 9%
reduction from the previous period.
Page 18 of 20TAG ADVICE ONLY NOT WELSH GOVERNMENT POLICY
The Figure below shows the number of hospital discharges of people who are
either suspected (SUS) or confirmed as having Covid-19 (COV+). The purple line
represents the total number over a rolling 7 day average, whilst the fainter grey
lines show the actual figures at that time.
The 7 day daily average hospital discharges as at 1 April was 12.6, a 35%
reduction from the previous 7 day period.
The Figure below shows patients admitted to Level 3 ICU and are either
suspected (SUS) or confirmed as having Covid-19 (COV+). The purple line
represents the total number over a rolling 7 day average, whilst the fainter grey
lines show the actual figures at that time.
The 7 day daily average as at 1 April was 0.7, remaining steady with the previous
7 day period.
Source: Data from StatsWales
Page 19 of 20TAG ADVICE ONLY NOT WELSH GOVERNMENT POLICY
Professional Head of Intelligence Assessment (PHIA) probability
yardstick
Where appropriate, TAC advice will express Likelihood or confidence in the
advice provided using the PHIA probability yardstick to ensure consistency
across the different elements of advice.
Page 20 of 20You can also read