Quarterly Auction Market Review - June Quarter 2020 - Released July 2020 - DG Institute
←
→
Page content transcription
If your browser does not render page correctly, please read the page content below

Quarterly Auction
Market Review
June Quarter 2020 – Released July 2020
                                         Location: Port Lincoln, South Australia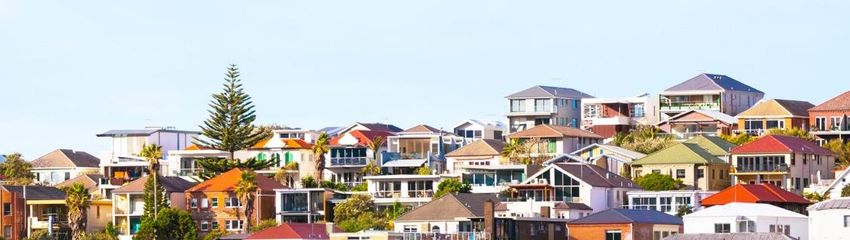
Quarterly Summary
June quarter saw both auction volumes and clearance rates drop across the capital cities
Auction volumes were down over the June quarter which is not surprising given the uncertainties around COVID-19 and tightened
restrictions banning on-site auctions which came into effect at midnight on March 25. The latest quarterly results were largely
impacted by these social distancing measures which saw a high proportion of pre-scheduled auctions withdrawn from the market
over the first half of the quarter.

The June 2020 quarter saw 13,783 auctions held, down 27 per cent when compared to the March quarter (18,902), and 24 per cent
lower than this quarter last year (18,104). Of the 11,956 auction results collected over the latest quarter, 31 per cent reported a
withdrawn result, which was significantly higher than the 6.1 per cent withdrawn over the March quarter. The first six weeks of the
quarter saw withdrawal rates as high as 56 per cent as vendors looked to alternative methods of sale or chose to postpone until
conditions improved. By mid-May withdrawal rates started to normalise.

The month of May saw weekly auction numbers remain below 1,000 across the combined capital cities, reaching as low as 417 over
the week ending 17 May, however June has seen auction volumes increase as restrictions were eased across the combined capitals
with 1,485 auctions held over the week ending 28 June.

The combined capital city auction clearance rate fell substantially over the three months to June, down from 62.5 per cent over the
March quarter, to 47.9 per cent, the lowest level since the December 2018 quarter (43.6 per cent).

The month of April saw weekly clearance rates sit below 50 per cent across the combined capitals, with the high volume of
withdrawn auctions dragging down the clearance rate. The highest weekly clearance rate recorded in April was the week ending
26th April (41.1 per cent). Since then, the clearance rate has begun to improve, with the week ending 28th June recording a weighted
average clearance rate of 60.6 per cent.

Auction Market Review Highlights
Capital city auction clearance rate & volumes

Sydney           51.5%                           Adelaide         44.7%                         Canberra        58.7%
                 (6,372 auctions)                                  (450 auctions)                               (576 auctions)

Melbourne        45.9%                           Perth             22.4%                        Combined        47.9%
                 (5,369 auctions)                                  (192 auctions)               Capitals        (13,783 auctions)

Brisbane         34.2%                           Tasmania          11.1%
                 (799 auctions)                                    (25 auctions)

Highest number of auctions for the quarter across capital city suburbs
Based on total auctions held across the suburb over the reporting period

Melbourne            Glen Waverley                                                       109
Sydney               Randwick                                                            90
Brisbane             West End                                                            25
Adelaide             Magill                                                              14
Canberra             Kambah                                                              20
Perth                Willetton                                                           7
Highest clearance rate for the quarter by capital city suburbs
Clearance rates are calculated when there had been at least 20 auction results reported over the period

Sydney:              Cremorne 76.7% (captured results: 30, scheduled auctions: 34, number sold: 23)
Melbourne:           Caulfield South 76.2% (captured results: 21, scheduled auctions: 32, number sold: 16)
Brisbane:            West End 22.7% (captured results: 22, scheduled auctions: 25, number sold: 5)
Capital city & major regional markets

    Quarterly summary, capital cities

                                        Clearance rate       Total auctions      Clearance rate   Total auctions   Clearance rate     Total auctions
Capital city
                                         (Jun Qtr '20)        (Jun Qtr '20)       (Mar Qtr '20)    (Mar Qtr '20)    (Jun Qtr '19)      (Jun Qtr '19)

Sydney                                      51.5%                6,372                 66.2%          7,135              59.1%            6,776

Melbourne                                   45.9%                5,369                 63.8%          8,882              59.5%            7,838

Brisbane                                    34.2%                 799                  41.7%          1,066              32.3%            1,380

Adelaide                                    44.7%                 450                  52.3%           827               47.0%            1,082
Perth                                       22.4%                 192                  35.1%           287               27.4%               409

Tasmania                                    11.1%                 25                   51.3%           66                60.0%               41

Canberra                                    58.7%                 576                  65.1%           639               50.8%               578

Combined capitals                           47.9%               13,783                 62.5%         18,902              55.5%           18,104

    Weekly clearance rate and volume of auctions, combined capital cities

                  90.0%                                                                                                                  4,500
                  80.0%                                                                                                                  4,000
                  70.0%                                                                                                                  3,500

                                                                                                                                                   Number of auctions
                  60.0%                                                                                                                  3,000
 Clearance rate

                  50.0%                                                                                                                  2,500
                  40.0%                                                                                                                  2,000
                  30.0%                                                                                                                  1,500
                  20.0%                                                                                                                  1,000
                  10.0%                                                                                                                  500
                   0.0%                                                                                                                  0
                      Jun-15   Dec-15   Jun-16      Dec-16      Jun-17        Dec-17     Jun-18   Dec-18      Jun-19     Dec-19     Jun-20

    Quarterly summary, regional

                                        Clearance rate       Total auctions      Clearance rate   Total auctions   Clearance rate     Total auctions
Region
                                         (Jun Qtr '20)        (Jun Qtr '20)       (Mar Qtr '20)    (Mar Qtr '20)    (Jun Qtr '19)      (Jun Qtr '19)

Hunter                                      44.9%                 340                  55.9%           370               42.9%               416

Wollongong                                  35.3%                 213                  47.0%           268               34.4%               332

Gold Coast                                  24.6%                 467                  37.4%           584               26.6%               571

Sunshine Coast                              27.1%                 263                  40.3%           321               33.3%               409

Geelong                                     45.5%                 183                  67.1%           256               56.4%               251

3 | Quarterly Auction Market Review
© 2020 CoreLogic No unauthorized use or disclosure. All rights reserved.
CORELOGIC and the CoreLogic logo are New Zealand and Australian trademarks of CoreLogic, Inc. and/or its subsidiaries.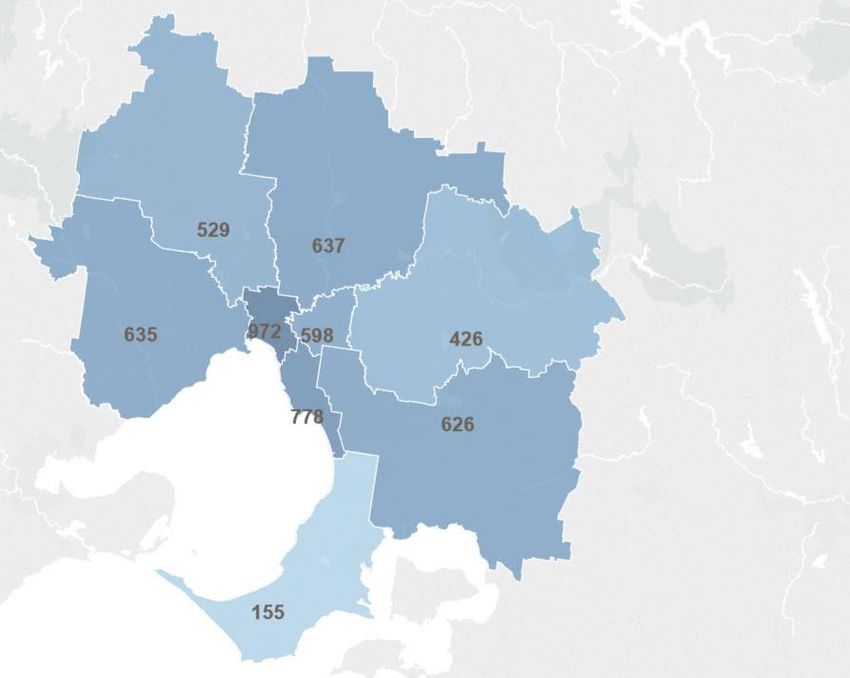
Capital city key statistics

                                                                      Northern Territory
                                                                      Jun 20: 38.8% (60 auctions)
                                                                      Jun 19: 20.0% (81 auctions)

                                                                                                                                       Brisbane
                                                                                                                              Jun 20: 34.2% (799 auctions)
                                                                                                                              Jun 19: 32.3% (1,380 auctions)

             Perth                                                                                                              Sydney
                                                                                                                               Jun 20: 51.5% (6,372 auctions)
             Jun 20: 22.4% (192 auctions)                                                                                      Jun 19: 59.1% (6,776 auctions)
             Jun 19: 27.4% (409 auctions)                              Adelaide
                                                 Jun 20: 44.7% (450 auctions)                                                Canberra
                                               Jun 19: 47.0% (1,082 auctions)                                                Jun 20: 58.7% (576 auctions)
                                                                                       Melbourne                             Jun 19: 50.8% (578 auctions)
                                                                   Jun 20: 45.9% (5,369 auctions)
                                                                   Jun 19: 59.5% (7,838 auctions)

                                                                                                                          Tasmania
                                                                                                                          Jun 20: 11.1% (25 auctions)
                                                                                                                          Jun 19: 60.0% (41 auctions)

Highest number of auctions for the quarter across capital city suburbs
Based on total auctions held across the suburb over the reporting period

Melbourne                Glen Waverley                                                                 109
Sydney                   Randwick                                                                      90
Brisbane                 West End                                                                      25
Adelaide                 Magill                                                                        14
Canberra                 Kambah                                                                        20
Perth                    Willetton                                                                     7
Highest clearance rate for the quarter by capital city suburbs
Clearance rates are calculated when there had been at least 20 auction results reported over the period

Sydney:                 Cremorne 76.7% (captured results: 30, scheduled auctions: 34, number sold: 23)
Melbourne:              Caulfield South 76.2% (captured results: 21, scheduled auctions: 32, number sold: 16)
Brisbane:               West End 22.7% (captured results: 22, scheduled auctions: 25, number sold: 5)

 4 | Quarterly Auction Market Review
 © 2020 CoreLogic No unauthorized use or disclosure. All rights reserved.
 CORELOGIC and the CoreLogic logo are New Zealand and Australian trademarks of CoreLogic, Inc. and/or its subsidiaries.
Capital city sub-regions (Sydney)
Sydney
Clearance rate Total auctions Clearance rate Total auctions Clearance rate Total auctions
Sub-region
(Jun Qtr '20) (Jun Qtr '20) (Mar Qtr '20) (Mar Qtr '20) (Jun Qtr '19) (Jun Qtr '19)
Central Coast 36.7% 154 46.2% 180 36.0% 303
Baulkham Hills and
47.3% 213 64.0% 262 55.2% 203
Hawkesbury
Blacktown 43.9% 131 53.8% 162 43.5% 146
City and Inner South 53.8% 798 67.2% 709 66.8% 760
Eastern Suburbs 53.2% 809 68.3% 880 61.6% 865
Inner South West 54.1% 698 66.6% 782 56.8% 661
Inner West 56.2% 587 68.5% 641 66.2% 582
North Sydney and Hornsby 55.5% 1,027 71.0% 1,097 64.4% 1,054
Northern Beaches 50.2% 469 72.0% 672 63.0% 615
Outer South West 48.3% 32 54.2% 57 42.4% 67
Outer West and Blue
27.8% 42 41.9% 51 40.0% 95
Mountains
Parramatta 49.2% 435 61.8% 514 51.0% 396
Ryde 48.8% 415 66.0% 382 66.9% 364
South West 42.3% 265 56.2% 314 55.6% 310
Sutherland 46.4% 271 70.1% 400 49.4% 306
Baulkham Hills Central Coast
& Hawkesbury
Northern Beaches
Blacktown
North Sydney & Hornsby
Ryde
Outer West & Blue Parramatta Inner West
Mountains Eastern Suburbs
South
West Inner City & Inner South
South West
Sutherland
Outer South West
Total Auctions
32 1,027
Sydney sub-region summary
Sydney’s auction clearance rate over the June quarter was recorded at 51.5 per cent, the lowest quarterly result
recorded since the December 2018 quarter (43.1%).
Looking at Sydney’s sub-regions, while all have seen clearance rates fall over the quarter, 6 of the 15 sub-regions
have seen clearance rates hold above the 50.0 per cent mark. The highest clearance rate was recorded across the
Inner West (56.2 per cent), followed by North Sydney and Hornsby (55.5 per cent) and Inner South West (54.1 per
cent).The busiest sub-regions for auctions over the quarter were North Sydney and Hornsby (1,027), followed by
Eastern Suburbs (809) and City and Inner South (798)
5 | Quarterly Auction Market Review
© 2020 CoreLogic No unauthorized use or disclosure. All rights reserved.
CORELOGIC and the CoreLogic logo are New Zealand and Australian trademarks of CoreLogic, Inc. and/or its subsidiaries.Capital city sub-regions (Melbourne)
Melbourne
Clearance rate Total auctions Clearance rate Total auctions Clearance rate Total auctions
Sub-region
(Jun Qtr '20) (Jun Qtr '20) (Mar Qtr '20) (Mar Qtr '20) (Jun Qtr '19) (Jun Qtr '19)
Inner 47.9% 972 66.1% 1,681 61.4% 1,537
Inner East 49.7% 598 61.6% 1,155 65.7% 869
Inner South 52.2% 778 66.3% 1,347 62.7% 1,239
North East 48.5% 637 66.1% 956 57.5% 927
North West 45.7% 529 63.5% 785 59.4% 727
Outer East 48.2% 426 67.3% 766 62.6% 498
South East 44.1% 626 62.1% 867 56.5% 810
West 34.4% 635 61.0% 950 53.0% 974
Mornington Peninsula 32.8% 155 50.0% 340 49.8% 236
North West
North East
West Inner
Outer East
Inner East
Inner South
South East
Mornington
Peninsula Total Auctions
155 972
Melbourne sub-region summary
Melbourne’s sub-regions performance over the June quarter was weaker than over the previous three month period,
with all regions showing a fall in clearance rates over the quarter. The strongest performing sub-region in terms of
clearance rates was the Inner South, which was also the only region to record a clearance rate above 50 per cent
(52.2 per cent). Melbourne’s Inner region was host to the greatest number of auctions, with 972 auctions held over
the three month period, followed by the Inner South where 778 auctions were scheduled over the reporting period.
Overall Melbourne’s clearance rate was recorded at 45.9 per cent over the June quarter, down from 63.8 per cent
over the previous quarter and 59.5 over the June 2019 quarter. In terms of auction volumes, there were 5,369 homes
scheduled for auction across the city over the 3 months to June, down from 8,882 over the March quarter and 7,838
over the June 2019 quarter.
6 | Quarterly Auction Market Review
© 2020 CoreLogic No unauthorized use or disclosure. All rights reserved.
CORELOGIC and the CoreLogic logo are New Zealand and Australian trademarks of CoreLogic, Inc. and/or its subsidiaries.Suburb results (city by city)
Sydney Sydney
Clearance rate Total auctions Clearance rate Total auctions
Suburb Suburb
(Jun Qtr 20) (Jun Qtr 20) (Jun Qtr 20) (Jun Qtr 20)
Alexandria 66.7% 30 Manly 41.5% 54
Annandale 57.6% 40 Maroubra 48.6% 40
Ashfield 48.5% 34 Marrickville 62.9% 69
Balmain 65.4% 31 Marsfield 33.3% 42
Baulkham Hills 64.3% 33 Mascot 39.3% 30
Bellevue Hill 50.0% 64 Matraville 60.0% 23
Bexley 52.6% 43 Mosman 62.5% 87
Blacktown 50.0% 32 Neutral Bay 56.3% 54
Bondi 68.6% 41 Newport 52.4% 23
Bondi Beach 58.5% 48 Newtown 61.8% 59
Bondi Junction 33.3% 36 North Bondi 66.7% 28
Botany 26.1% 24 North Ryde 65.5% 34
Camperdown 57.7% 33 North Sydney 61.9% 23
Caringbah South 46.2% 26 Paddington 59.5% 53
Carlingford 47.4% 46 Padstow 50.0% 23
Castle Hill 51.0% 59 Parramatta 33.3% 29
Chatswood 49.1% 68 Potts Point 60.9% 24
Concord 60.0% 33 Pymble 50.0% 31
Coogee 61.1% 39 Pyrmont 44.8% 37
Cremorne 76.7% 34 Randwick 53.8% 90
Cronulla 28.1% 32 Redfern 34.8% 26
Croydon 58.3% 26 Revesby 72.7% 22
Darlinghurst 44.4% 40 Rose Bay 50.0% 31
Dee Why 40.7% 30 Rosebery 33.3% 28
Double Bay 46.4% 36 Ryde 43.5% 61
Drummoyne 63.0% 33 Sans Souci 63.6% 25
Earlwood 72.4% 34 St Ives 45.2% 51
Eastwood 54.5% 41 Strathfield 47.9% 51
Elizabeth Bay 66.7% 25 Surry Hills 55.4% 66
Epping 62.5% 67 Sydney 50.0% 25
Erskineville 63.6% 39 Turramurra 46.9% 35
Frenchs Forest 57.1% 25 Vaucluse 31.8% 30
Greenacre 55.9% 38 Wahroonga 44.1% 47
Kellyville 48.4% 33 Wentworthville 52.4% 22
Kensington 46.2% 28 Westmead 50.0% 22
Kingsford 50.0% 30 Wollstonecraft 69.2% 32
Lane Cove 59.4% 38 Woollahra 51.9% 29
Lane Cove North 66.7% 54 Yagoona 45.5% 24
Leichhardt 75.0% 45
7 | Quarterly Auction Market Review
© 2020 CoreLogic No unauthorized use or disclosure. All rights reserved.
CORELOGIC and the CoreLogic logo are New Zealand and Australian trademarks of CoreLogic, Inc. and/or its subsidiaries.Suburb results (city by city)
Brisbane Melbourne
Clearance rate Total auctions Clearance rate Total auctions
Suburb Suburb
(Jun Qtr 20) (Jun Qtr 20) (Jun Qtr 20) (Jun Qtr 20)
West End 22.7% 25 Elwood 44.7% 39
Epping 38.6% 48
Melbourne Essendon 47.2% 58
Fawkner 34.6% 31
Clearance rate Total auctions Ferntree Gully 41.4% 34
Suburb
(Jun Qtr 20) (Jun Qtr 20) Footscray 30.0% 36
Airport West 47.6% 22 Frankston 36.1% 39
Albert Park 30.0% 22 Glen Iris 44.4% 30
Altona 22.7% 24 Glen Waverley 44.6% 109
Altona North 30.0% 26 Glenroy 48.3% 32
Ascot Vale 61.3% 35 Greenvale 47.8% 25
Balwyn North 68.0% 31 Hampton East 58.3% 28
Bentleigh 34.6% 31 Hawthorn 46.9% 39
Bentleigh East 47.9% 58 Highett 56.5% 30
Blackburn 43.5% 33 Hoppers Crossing 36.0% 30
Boronia 46.7% 34 Keilor East 35.0% 25
Box Hill North 57.7% 30 Kensington 56.5% 26
Braybrook 20.0% 21 Kew 64.0% 28
Brighton 41.9% 36 Keysborough 37.5% 28
Brighton East 38.1% 24 Lalor 37.8% 41
Brunswick 46.3% 45 Maidstone 30.0% 20
Brunswick West 47.6% 28 Malvern East 51.6% 41
Bundoora 57.6% 35 Maribyrnong 29.2% 25
Burwood 43.3% 33 Melbourne 41.7% 28
Burwood East 65.0% 22 Mernda 43.5% 28
Camberwell 48.4% 36 Mickleham 28.0% 27
Carnegie 57.1% 46 Mill Park 51.4% 36
Caulfield North 59.4% 40 Mitcham 57.1% 25
Caulfield South 76.2% 32 Moonee Ponds 59.1% 36
Chadstone 45.8% 30 Mount Waverley 56.7% 79
Cheltenham 54.3% 43 Mulgrave 53.7% 44
Clayton 48.6% 42 Newport 47.8% 30
Clayton South 34.6% 36 Noble Park 33.3% 27
Coburg 51.9% 58 Northcote 43.2% 57
Craigieburn 49.3% 80 Nunawading 40.0% 28
Croydon 44.0% 27 Parkdale 59.3% 29
Doncaster 39.1% 29 Pascoe Vale 65.9% 46
Doncaster East 31.6% 52 Point Cook 11.1% 31
Eltham 72.7% 25 Port Melbourne 33.3% 27
8 | Quarterly Auction Market Review
© 2020 CoreLogic No unauthorized use or disclosure. All rights reserved.
CORELOGIC and the CoreLogic logo are New Zealand and Australian trademarks of CoreLogic, Inc. and/or its subsidiaries.Suburb results (city by city)
Melbourne
Clearance rate Total auctions
Suburb
(Jun Qtr 20) (Jun Qtr 20)
Prahran 59.4% 36
Preston 43.8% 50
Reservoir 40.9% 104
Richmond 44.8% 36
Ringwood 39.1% 26
South Melbourne 33.3% 22
South Morang 55.9% 34
South Yarra 55.6% 33
St Albans 35.0% 23
St Kilda 34.7% 55
St Kilda East 56.5% 32
Strathmore 54.5% 24
Sunshine West 23.8% 22
Thomastown 60.9% 25
Toorak 70.0% 22
Wantirna South 54.5% 24
Werribee 34.5% 37
West Footscray 36.4% 24
Williamstown 44.8% 38
Wollert 34.4% 35
Yarraville 39.1% 23
9 | Quarterly Auction Market Review
© 2020 CoreLogic No unauthorized use or disclosure. All rights reserved.
CORELOGIC and the CoreLogic logo are New Zealand and Australian trademarks of CoreLogic, Inc. and/or its subsidiaries.Methodology note
Each week CoreLogic collects the most comprehensive set of auction results available in Australia. Thank you to
our vast network of real estate professionals who assist us with aggregating these results. On average, CoreLogic
collects approximately 90% of auction results each week with final results released each Thursday.
A cleared auction refers to those properties that were either successfully auctioned on the day, sold before the
auction or sold after the auction. Properties which are sold after the auction must be reported to CoreLogic by
three days after the week has ended to be included in the clearance rate. Auctions that pass in or are withdrawn
are counted as unsuccessful auctions.
Clearance rates are calculated across properties that have been taken to auction over the past week. The auction
statistics presented in this report are calculated on a weekly basis and have been rolled up into quarterly
reporting as per the below timeframes.
June 2020 quarter
Based on results from 30 March to 28 June 2020
March 2020 quarter
Based on results from 6 January to 29 March 2020
June 2019 quarter
Based on results from 1 April 2019 to 30 June 2019
Auction clearance rates at a suburb level will only be displayed when at least 20 results were reported to
CoreLogic over the reporting period.
Submit your auction results here
10 | Quarterly Auction Market Review
© 2020 CoreLogic No unauthorized use or disclosure. All rights reserved.
CORELOGIC and the CoreLogic logo are New Zealand and Australian trademarks of CoreLogic, Inc. and/or its subsidiaries.About CoreLogic
CoreLogic Australia is a wholly owned subsidiary of Granular Data and
CoreLogic (NYSE: CLGX), which is the largest property
data and analytics company in the world. CoreLogic
Analytics Driving Growth
provides property information, analytics and services in your Business
across Australia, New Zealand and Asia, and recently
expanded its service offering through the purchase of CoreLogic produces an advanced
project activity and building cost information provider suite of housing market analytics
Cordell. With Australia’s most comprehensive property that provides key insights for
databases, the company’s combined data offering is understanding housing market
derived from public, contributory and proprietary sources conditions at a granular
and includes over 500 million decision points spanning geographic level. Granular
over three decades of collection, providing detailed data is often used for portfolio
analysis and benchmarking, risk
coverage of property and other encumbrances such
assessments and understanding
as tenancy, location, hazard risk and related
development feasibility and
performance information.
market sizing. It gives industry
professionals valuable modules
With over 20,000 customers and 150,000 end users, which provide essential analytics
CoreLogic is the leading provider of property data, and insights for decision making
analytics and related services to consumers, investors, and strategy formation within
real estate, mortgage, finance, banking, building the residential property asset
services, insurance, developers, wealth management class. We can tailor reports to
and government. CoreLogic delivers value to clients suit your business requirements.
through unique data, analytics, workflow technology,
advisory and geo spatial services. Clients rely on Call us on
CoreLogic to help identify and manage growth 1300 734 318
opportunities, improve performance and mitigate risk. or email us at
CoreLogic employs over 650 people across Australia and ask@corelogic.com.au
in New Zealand. For more information call 1300 734 318 or visit us at
or visit www.corelogic.com.au www.corelogic.com.auDisclaimers
© 2020 Copyright RP Data Pty Ltd trading as CoreLogic Victorian Data
Asia Pacific (CoreLogic), Local, State, and Commonwealth The State of Victoria owns the copyright in the Property
Governments. All rights reserved. No reproduction, Sales Data which constitutes the basis of this report and
distribution or transmission of the copyrighted materials reproduction of that data in any way without the consent
in this publication is permitted whether in whole or of the State of Victoria will constitute a breach of the
in part. Copyright Act 1968 (Cth). The State of Victoria does not
warrant the accuracy or completeness of the information
The information provided in this publication is current as
contained in this report and any person using or relying
at the publication date only. This publication is supplied
upon such information does so on the basis that the
on the basis that while CoreLogic believes all the
State of Victoria accepts no responsibility or liability
information in it is deemed reliable at the publication
whatsoever for any errors, faults, defects or omissions
date, it does not warrant its accuracy or completeness
in the information supplied.
and to the full extent allowed by law excludes liability in
contract, tort or otherwise, for any loss or damage
sustained by yourself, or by any other person or body Western Australian Data
corporate arising from or in connection with the supply Based on information provided by and with the
or use of the whole or any part of the information in this permission of the Western Australian Land Information
publication through any cause whatsoever and limits any Authority (2020) trading as Landgate.
liability it may have to the amount paid to CoreLogic for
the supply of such information. Australian Capital Territory Data
The Territory Data is the property of the Australian
This publication provides general information only – it is Capital Territory. No part of it may in any form or by any
not intended as advice and should not be relied upon as means (electronic, mechanical, microcopying,
such. The material has not been prepared by taking into photocopying, recording or otherwise) be reproduced,
account your investment objectives, financial situation or stored in a retrieval system or transmitted without prior
personal needs. You should make your own inquiries and written permission. Enquiries should be directed to:
if necessary take independent financial advice tailored to Director, Customer Services ACT Planning and Land
your specific circumstances before making any Authority GPO Box 1908 Canberra ACT 2601.
investment decisions.
Tasmanian Data
Queensland Data This product incorporates data that is copyright owned
Based on or contains data provided by the State of by the Crown in Right of Tasmania. The data has been
Queensland (Department of Natural Resources and used in the product with the permission of the Crown in
Mines) 2020. In consideration of the State permitting Right of Tasmania. The Crown in Right of Tasmania and
use of this data you acknowledge and agree that the its employees and agents:
State gives no warranty in relation to the data
(including accuracy, reliability, completeness, currency a) give no warranty regarding the data's accuracy,
or suitability) and accepts no liability (including without completeness, currency or suitability for any particular
limitation, liability in negligence) for any loss, damage or purpose; and
costs (including consequential damage) relating to any
use of the data. Data must not be used for direct b) do not accept liability howsoever arising, including but
marketing or be used in breach of the privacy laws not limited to negligence for any loss resulting from the
use of or reliance upon the data.
South Australian Data
This information is based on data supplied by the South Base data from the LIST © State of Tasmania
Australian Government and is published by permission. http://www.thelist.tas.gov.au
The South Australian Government does not accept any
responsibility for the accuracy or completeness of the
published information or suitability for any purpose of
the published information or the underlying data.
New South Wales Data
Contains property sales information provided under
licence from the Land and Property Information (“LPI”).
CoreLogic is authorised as a Property Sales Information
provider by the LPI.
12 | Quarterly Auction Market Review
© 2020 CoreLogic No unauthorized use or disclosure. All rights reserved.
CORELOGIC and the CoreLogic logo are New Zealand and Australian trademarks of CoreLogic, Inc. and/or its subsidiaries.Toll Free: 1300 734 318
This publication reproduces materials and content owned or licensed by RP Data
Pty Ltd trading as CoreLogic Asia Pacific (CoreLogic) and ma include data, statistics,
estimates, indices, photographs, maps, tools, calculators (including their outputs),
commentary, reports and other information (CoreLogic Data).
corelogic.com.au
2020 CoreLogic, Inc. All Rights Reserved. This material may not be
reproduced in any form without express written permission.You can also read