Mossel Bay Municipality - Western Cape Government
←
→
Page content transcription
If your browser does not render page correctly, please read the page content below
Mossel Bay Municipality
                  2020
MOSSEL BAY: AT A GLANCE

       Demographics………………………………………………………………………..                4

       Education ………………………………………………………………………..……                6

       Health…………………………………………………………………………………..                  8

       Poverty………………………………………………………………………………….                  10

       Basic Service Delivery………………………………………………………………..         12

       Safety and Security…………………………………………………………………..           14

       Economy and Labour Market Performance……………………………….....   16

       Public Infrastructure Spend………………………………………………………..... 18

SOURCES                                                         20

2020 Socio-economic Profile: Mossel Bay Municipality                 2
Mossel Bay: At a Glance
                                                                      Population Estimates, 2018; Actual households, 2019

                95 255                                                          25 031
                                              2019                                                                 2018

              Matric Pass Rate            84.7%                     Gini Coefficient                            0.62
              Learner retention Rate     73.7%
              Learner-Teacher Ratio        30.9                    Human Development Index                       0.77

                                                                                                                   2019

                            5            67.6%                      0.0                         16.8%

                                                                             Actual number of reported cases in 2019/20

                            797              565                   855                     50               111

                                                            Percentage of households with access to basic services, 2019

          95.5%             92.6%                 93.5%                         90.6%                84.8%

                  2019/20                            2019

                                 Unemployment Rate                       COVID-19
                    17           (narrow definition)
                                                                         Slow economic growth

                    21           15.3%                                   High Unemployment

                                                                                              Contribution to GDP, 2018

 Finance, insurance, real estate &         Wholesale & retail trade, catering                   Manufacturing
        business services                       and accommodation

          28.3%                                      17.5%                                    14.7%
2020 Socio-economic Profile: Mossel Bay Municipality                                                                      3
MOSSEL BAY

                                                              DEMOGRAPHICS
   53%                                    47%
                                                                                        Population per km²
                                                                                                   0 – 10
                                                                                               11 – 20
                                                                                               21 – 30
                                                                                               31 – 40
                                                                                               41 - 50
                                                                                                    50+

                      Number of males
                      per 100 females
                                   2020      2021        2022          2023      2024

                                                                                                                   95 255
         Kannaland              87.5      87.5         87.4        87.3         87.2
         Hessequa               88.4      88.7         88.7        88.7         88.8
         Mossel Bay             90.4      90.7         90.7        90.7         90.7                          Current Population
          George                93.1      93.7         94.0        94.2         94.5
        Oudtshoorn              88.0      88.5         88.6        88.8         88.9
           Bitou                95.2      95.9         96.2        96.5         96.8

                                                                                            97 831
          Knysna                93.0      93.5         93.7        93.9         94.0

  Garden Route District         91.5      92.0         92.2        92.4         92.6                                 2024
                                                                                         Estimated Population

                      Household size                                             Population growth

              2020        3.2
              2021        3.2
              2022        3.1                                   0.8%          0.6%      0.6%           0.6%
              2023        3.1
              2024        3.1

                                                                  2021         2022         2023            2024
       Age cohorts                                                            Population growth 2020 – 2024
                                                                              Garden Route District +0.8%
                                                                              Bitou +3.1%
        Children:      Working Age:          Aged         Dependency
       0-14 Years       15-65 Years        65+ Years         Ratio
                                                                              George +1.2%

2020     21 075             61 625          12 555              54.6          Knysna +0.9%

2023     20 815             62 970          13 647              54.4          Mossel Bay +0.7%
                                                                              Hessequa -0.3%
2026     20 725             64 136          14 621              55.1
        -0.3%              +0.7%           +2.6%                              Oudtshoorn -0.9%
                                                                              Kannaland -1.9%
       2020 Socio-economic Profile: Mossel Bay Municipality                                                                    4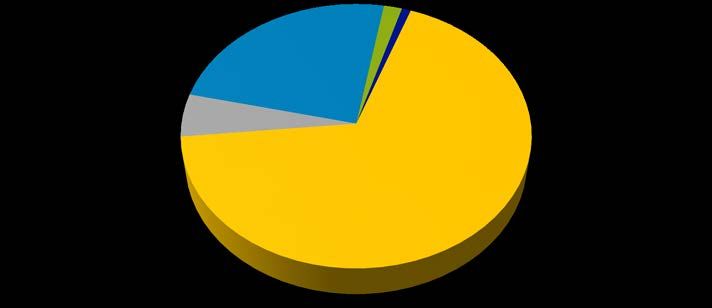
Demographics

   Population
   The population of Mossel Bay is 95 255 people in 2020, making it the second most populated municipal
   area in the Garden Route District (GRD). This total is expected to grow to 97 831 by 2024, equating to an
   average annual growth rate of 0.7 per cent.

   Sex Ratio
   The overall sex ratio (SR) depicts the number of males per 100 females in the population. The data
   indicates that there are slightly more females than males in the Mossel Bay municipal area with a ratio of
   53,0 per cent (females) to 47,0 per cent (males). The SR for Mossel Bay remains constant year on year
   towards 2024 which could be attributed to a wide range of factors.

   Age Cohorts
   Between 2020 and 2026, the largest population growth was recorded in the 65+ aged cohort which grew
   at an annual average rate of 2.6 per cent. This predicted growth rate increases the dependency ratio
   towards 2025.

   Household sizes
   Household size refers to the number of people per household. The actual size of households is on a
   downward trend from 3.2 people per household in 2020 to 3.1 in 2024. Contributing factors to a
   stagnation in household size growth could include, but are not limited to, lower fertility rates, occurrences
   of divorce, ageing population, etc.

   Population density
   Amidst rapid urbanisation across the Western Cape, population density figures will aid public sector
   decision makers to mitigate environmental, individual health and service delivery risks. In 2020, the
   population density of the Garden Route District (GRD) was 27 persons per square kilometre. In order of
   highest to lowest, the various local municipal areas in the GRD compare as follows:

   • Bitou           68 people/km2

   • Knysna          68 people/km2

   • Mossel Bay      47 people/km2

   • George          42 people/km2

   • Oudtshoorn      26 people/km2

   • Hessequa        9 people/km2

   • Kannaland       5 people/km2

2020 Socio-economic Profile: Mossel Bay Municipality                                                         5
Educational
                      facilities
                                                                         EDUCATION
     24
   Number of
                                                                                   Learner enrolment
    schools
                                                   120 000

                          17
                                                   100 000
                                                    80 000
                                                    60 000
                                                    40 000
                          Number of
                                                    20 000
                           no-fee
                                                         0
                           schools                             Garden
                                                                         Bitou   George     Hessequa    Kannaland     Knysna   Mossel Bay       Oudtshoorn
                                                                Route
                                                        2017   104 500   8 041   35 441       8 706       4 679       12 326     16 650           18 657
                                                        2018   106 289   8 376   36 174       8 682       4 749       12 513     16 986           18 809
                                                        2019   107 367   8 508   36 688       8 618       4 718       12 668     17 399           18 768

                                                                                   Learner-Teacher

     16          Number of schools
                 with libraries
                                                                                   Ratio

                                                               Garden Route                            29.2 | 30.1 | 30.1
                                                                     Bitou                             30.4 | 32.2 | 32.3
                                                                   George                              28.9 | 29.9 | 29.6
                  Education                                       Hessequa                             27.7 | 28.6 | 28.9
                  outcomes                                       Kannaland                             28.3 | 31.4 | 31.6
                                                                    Knysna                             31.2 | 30.0 | 30.3
                 80.1     82.2    87.3                           Mossel Bay                            28.4 | 30.2 | 30,9
  Oudtshoorn
                                                                 Oudtshoorn                            29.6 | 30.0 | 29.7
                  83.5     83.1    84.7
  Mossel Bay

                 72.4%    77.1%   83.8%
      Knysna

                 89.2%    85.6%   85.9%
                                                                                   Learner retention
  Kannaland
                                                                                                            67.6%
                 87.4%    84.7%   91.5%
   Hessequa                                                                               65.3%                                62.9%
                                                                 Garden Route                                56.8%
                                                                                          55.5%                                     52.4%
                 83.7%    79.9%   82.0%                                                                       73.0%
     George                                                      Bitou
                                                                                          68.8%
                                                                 George                                                            66.8%
                                                                                                              69.0%
                 78.0%    82.2%   89.6%                                                   64.4%                                   62.0%
         Bitou                                                   Hessequa
                                                                                          59.8%               67.2%               57.1%
                                                                 Kannaland
                 82.0%    81.3%   85.1%                                                   64.7%
Garden Route                                                     Knysna                                      59.2%                 51.2%
                  5%                                             Mossel Bay
                   2017    2018   2019                                                     63.5%                  66.2%              73.7%
                                                                 Oudtshoorn
   85%                                                                                     66.4%                                     59.4%
                                                                                                                  67.5%

      2020 Socio-economic Profile: Mossel Bay Municipality                                                                                  6
Education

   Learner enrolment, the learner-teacher ratio and learner retention rate
   Learner enrolment in Mossel Bay grew by 1.4 per cent annually from 2017 to 2019, the second highest
   after Bitou in the Garden Route district when compared to the other municipal areas. This could be
   attributed to a number of factors including demographics and socio-economic context. The Mossel Bay
   learner-teacher ratio was 30,9 in 2019. Learner retention improved in Mossel Bay from 63.5 per cent in
   2017, 66.2 per cent in 2018 and 73.7 per cent in 2019.

   Number of schools
   In 2019, Mossel Bay had a total of 24 public ordinary schools. The low number of schools in relation to high
   learner enrolment relative to the other areas in the district further accentuate the need for additional
   schools in the Mossel Bay area.

   Number of no-fee schools

   The proportion of no-fee schools in Mossel Bay are at 70,8 per cent in 2019, indicating that, given the
   tough economic climate, schools have been reporting an increase in parents being unable to pay their
   school fees. In an effort to alleviate some of the funding challenges the Western Cape Department of
   Education (WCED) offered certain fee-paying schools to become no-fee schools.

   Schools with libraries and media centres
   Schools with libraries and media centres has gradually increased from 15 in 2017 to 16 in 2019,
   contributing to the improvement in the overall quality of education over these years.

   Education Outcomes (Matric Pass Rates)
   Education remains one of the key avenues through which the state is involved in the economy. In
   preparing individuals for future engagement in the labour market, policy choices and decisions in the
   sphere of education play a critical role in determining the extent to which future economic and poverty
   reduction plans can be realised. Mossel Bay’s matric outcomes has exceeded 80 per cent from 2017 to
   2019 with 84.7 per cent.

2020 Socio-economic Profile: Mossel Bay Municipality                                                        7

HEALTH
                             Tuberculosis
800
780
                                                                                                      Healthcare facilities
760                                                       775
740
                                    749
720                                                                                 Regional hospitals     1                                                 0
700
              703
680                                                                                   District hospitals                      6                          1
660
             2017               2018                      2019            PHC facilities (Fixed clinics,
                                                                             CHCs and CDCs)
                                                                                                                               40                        5

                                                                            Community Day Centres                         7                         2

                         Maternal health                                    PHC Clinics (Satelite and
                                                                                                                          37                        11
                                                                                    mobile)

                                                                                   PHC Clinics (Fixed)                         33                        3
                             Delivery rate         Termination
             Maternal                                                                        Garden Route                           Mossel Bay
                              to women                 of
             Mortality
                                under              pregnancy
              Rate
                               20 years               rate

                                                                                                      Emergency medical
             2018

                    2019

                             2018

                                          2019

                                                   2018

                                                                 2019

Mossel
              0.0    0.0      14.9         16.8      0.5           0.6                                services
Bay
Garden
Route        57.6   33.4     15.9          15.6      0.6          0.6          Health Indicator                 Mossel Bay               Garden Route
District                                                                      No of operational
                                                                            ambulances per 10 000                     3                       2
                                                                                   people

                             Child health
                                                                                                         HIV/AIDS)
           Low birth rate            16.4                 12.2

                                                                                              Registered patients                 Number of new ART
Neonatal mortality rate
  (per 1 000 live births)             9.2                  6.0                                  receiving ART                         patients
                                                                             Area
                                                                                               2018            2019               2018            2019
Acute malnutrition rate
 (under 5 per 100 0000                       1.9                  0.3
                                                                         Mossel Bay              4 147          4 979                 527            621

   Immunisasation rate
            (under 1)               67.7              67.6               Garden Route          23 317          25 738                3 009         2 576

                            Garden Route           Mossel Bay
85% 85%

   2020 Socio-economic Profile: Mossel Bay Municipality                                                                                             8
Health

   Healthcare Facilities
   According to the 2019 Inequality Trend report by Statistics South Africa, 75.1 per cent of households in
   South Africa usually use public healthcare facilities when a household member gets ill compared to 24.9
   per cent who use some private healthcare facilities in 2017. This is associated with the low proportion of
   households with access to Medical Aid which is low at 16.9 per cent for South Africa and 25 per cent for
   the Western Cape in 2017. In terms of healthcare facilities, Mossel Bay had 5 primary healthcare clinics
   (PHC) in 2019, which comprises of 3 fixed clinics as well as 2 Community Day Centres. In addition, there is
   one district hospital in the municipal area.

   Emergency Medical Services
   Provision of more operational ambulances can provide greater coverage of emergency medical
   services. Mossel Bay has 3 ambulances per 10 000 inhabitants in 2019 which is slightly more than the GRD
   average of 2 ambulances per 10 000 people. It is worth noting that this number only refers to Provincial
   ambulances and excludes all private service providers.

   HIV/AIDS/TB
   Mossel Bay’s total registered patients receiving ARTs increased by 832 patients between 2018 and 2019. A
   total of 25 738 registered patients received antiretroviral treatment in the GRD in 2019. Mossel Bay, at
   4 979 patients, represent 19.3 per cent of the patients receiving ART in the GRD . The number of new
   antiretroviral patients increased to 621 in 2019.

   Mossel Bay experienced a gradual increase in tuberculosis (TB) cases from 703 in 2017, 749 in 2018 and
   775 in 2019.

   Child Health
   Immunisation rates in the Mossel Bay area is 67.6 per cent in 2019 down from 70 per cent in 2018. The
   number of malnourished children under five years (per 100 000) in Mossel Bay in 2019 was 0.3, a slight
   regression from 0.1 in 2018. Neonatal mortality rate (NMR) (per 1 000 live births) in the Mossel Bay area
   increased from 4.8 in 2018 to 6.0 in 2019. The low birth weight indicator was recorded at 12.2, a slight
   improvement from 14.5 recorded in 2018.

   Maternal Health
   The maternal mortality rate in the Mossel Bay area is zero deaths per 100 000 live births in 2019 and 33.4 in
   the Garden Route District

   The delivery rate to women under 20 years in Mossel Bay and the GRD was recorded at 16.8 and 15.6 per
   cent respectively.

   The termination of pregnancy rate increased from 0.5 per cent in 2018 to 0.6 per cent in 2019 in the
   Mossel Bay area. The termination of pregnancy rates in Mossel Bay and the Garden Route district are on
   par at 0.6 in 2019.

2020 Socio-economic Profile: Mossel Bay Municipality                                                         9

POVERTY
GDP per capita
60 000
50 000
40 000
30 000
20 000
10 000
0
Western Garden
Kannaland Hessequa Mossel Bay George Oudtshoorn Bitou Knysna
Cape Route
2012 50 000 42 000 26 000 37 000 47 000 46 000 37 000 38 000 44 000
2015 51 000 44 000 27 000 39 000 50 000 49 000 39 000 40 000 46 000
2018 50 000 45 000 29 000 41 000 51 000 50 000 40 000 40 000 47 000
Income inequality
0.68 0.65
0.66 0.64 Western Cape
0.64 0.63 0.62 Garden Route
0.61
0.62 0.60 Kannaland
0.60
0.60 0.58 0.59
0.57 0.58 Hessequa
0.57 0.56
0.58 0.56 0.56
0.55 0.55 Mossel Bay
0.56 0.54 0.54
George
0.54 0.52
0.52 0.51
0.51
0.51 Oudtshoorn
0.52
0.50 Bitou
2012 2015 2018 Knysna
Human development
0.84
0.81
0.82 0.81 Garden Route
0.80 0.80
0.79
0.80 0.79 Kannaland
0.78 0.77 0.77 Hessequa
0.76 0.76
0.76 0.76 0.76
0.76 0.75 0.75
0.75
Mossel Bay
0.74
0.74 0.73
George
0.72
0.72
0.72 0.71 Oudtshoorn
0.71 0.71
0.70 Bitou
0.68
Knysna
0.68 5%
0.66
2012 85 2015 2018
%
2020 Socio-economic Profile: Mossel Bay Municipality 10Poverty
GDPR Per Capita
An increase in real GDPR per capita, i.e. GDPR per person, is experienced only if the real economic
growth rate exceeds the population growth rate. Even though real GDP per capita reflects changes in
the overall well-being of the population, not everyone within an economy will earn the same amount of
money as estimated by the real GDPR per capita indicator.
At R51 000 in 2018, Mossel Bay’s real GDPR per capita is above that of the GRD’s figure of R45 000 as well
as that of the Western Cape(R50 000).
Income Inequality
The National Development Plan (NDP) has set a target of reducing income inequality in South Africa from
a Gini coefficient of 0.7 in 2010 to 0.6 by 2030. Income inequality in Mossel Bay has declined slightly from
0.55 in 2012 to 0.54 in 2015 and thereafter rose to 0.62 in 2018.
Furthermore, income inequality levels were marginally higher in Mossel Bay, Knysna, and Bitou for 2018
with a Gini coefficient higher than 0.60 when compared to neighbouring municipalities across the GRD
and the Western Cape. These rather worrying disparities in income are certain to worsen across the
ensuing MTREF given the expected in-migration of job seekers in relation to the IDZ initiative.
Human Development
The United Nations uses the Human Development Index (HDI) to assess the relative level of socio-
economic development in countries. Indicators that measure human development are education,
housing, access to basic services and health.
There has been a general increase in the HDI in Mossel Bay from 0.72 in 2012 to 0.76 in 2015 and 0.77 in
2018. The HDI levels of Mossel Bay (0.77) and the GRD (0.77) in 2018 were higher than the HDI level of the
Western Cape (0.76). Naturally, per capita income as per definition is expected to mimic the trend of HDI
and this is clearly displayed in the graphic above. In short, what this graphic illustrates is that for the most
part an increase in GDP per capita across a particular region is generally accompanied by an
improvement in HDI levels with a short lag.
The HDI is a composite indicator reflecting education levels, health, and income. It is a measure of
peoples' ability to live a long and healthy life, to communicate, participate in the community and to
have sufficient means to be able to afford a decent living. The HDI is represented by a number between
0 and 1, where 1 indicates a high level of human development and 0 represents no human
development.
2020 Socio-economic Profile: Mossel Bay Municipality 11BASIC SERVICE DELIVERY
Total number of households
29 517 172 792
Mossel Bay Municipality Garden Route District
Formal main dwelling 82.9
84 8 25 031 143 241 %
% Mossel Bay Municipality Garden Route District
72.8% Mossel Bay 0.6% Mossel Bay 10.8% Mossel Bay
75.2% Garden Route 0.7% Garden Route 6.2% Garden Route
Flat/simplex/duplex/
House/brick structure triplex or room/flat
on separate stand/yard Traditional dwelling
on shared property 1.2% Mossel Bay
1.2% Garden Route
1.2% Mossel Bay 5.5% Mossel Bay 7.9% Mossel Bay Other/Unspecified
1.5% Garden Route 6.2% Garden Route 9.1% Garden Route
House/flat/room in Informal dwelling in Informal dwelling
backyard backyard not in backyard
Mossel Bay Flush/Chemical toilet At least weekly
Piped water inside Electricity as primary Flush/chemical toilet Refuse removed at least
dwelling/within 200m source of lighting once a week
Mossel Bay 95.5% Mossel Bay 93.5% Mossel Bay 90.6% Mossel Bay 92.6%
Garden Route 95.2% Garden Route 90.7% Garden Route 85.2% Garden Route 86.5%
Free basic Free basic Free basic Free basic
water electricity sanitation refuse removal
43 672
34 310
33 947
32 165
31 291
29 341
28 784
28 420
28 615
11 312
11 267
10 935
11 749
11 677
5 331
6 497
2018 2017 2016 2015 2015 2016 2017 2018 2015 2016 2017 2018 2015 2016 2017 2018
2020 Socio-economic Profile: Mossel Bay Municipality 12Basic Service Delivery The Constitution stipulates that every citizen has the right to access to adequate housing and that the state must take reasonable legislative and other measures within its available resources to achieve the progressive realisation of this right. Access to housing also includes access to services such as potable water, basic sanitation, safe energy sources and refuse removal services, to ensure that households enjoy a decent standard of living. This section considers to what extent this has been achieved by reflecting on the latest available information from Quantec Research for 2019. The latest official statistics was collected by Statistics South Africa for the 2016 Community Survey; the 2021 Census will provide the updated official statistics. The information on free basic services is obtained from Statistics South Africa’s Non-Financial Census of Municipalities survey findings. Housing and Household Services With a total of 29 517 households in the Mossel Bay municipal area, only 84.8 per cent had access to formal housing, the fourth lowest when compared with other municipalities in the Garden Route District area; the District average was 82.9 per cent. The converse of this is that the area also had the fifth highest proportion of informal households in the Garden Route District, a total of 13.4 per cent compared with the District average of 15.3 per cent. As such, access to formal housing is a particular challenge in the Mossel Bay municipal area. However, even though there was a relatively low proportion of formal housing, service access levels were significantly higher, with access to piped water inside/within 200m of the dwelling at 95.5 per cent, access to a flush or chemical toilet at 90.6 per cent, access to electricity (for lighting) at 93.5 per cent and the removal of refuse at least weekly by local authority at 92.6 per cent of households. These access levels were above the District averages for all services. Free Basic Services Municipalities also provide a package of free basic services to households who are financially vulnerable and struggle to pay for services. The number of households receiving free basic services in the Mossel Bay municipal area has remained constant between 2015 and 2018. The stressed economic conditions are anticipated to exert pressure on household income levels, which is in turn likely to see the number of indigent households and the demand for free basic services increase. 2020 Socio-economic Profile: Mossel Bay Municipality 13
Mossel Bay
                                                MURDER                         2017/18        2018/19    2019/20

                            Actual              Mossel Bay                         45             45         50
                            Number              Garden Route District             183            215        205
                            Per                 Mossel Bay                         48             47         52
                            100 000             Garden Route District              30             35         33

                  SEXUAL OFFENCES                      2017/18     2018/19       2019/20

                            Mossel Bay                        87         121           111
    Actual Number
                            Garden Route District        1 046      1 059              975
                            Mossel Bay                        92         128           116
    Per 100 000
                            Garden Route District            171         172           157

                                      DRUG-RELATED OFFENCES                    2017/18        2018/19    2019/20

                                                 Mossel Bay                     1 425           1 038       855
                            Actual Number
                                                 Garden Route District         10 814           7 330     5 814
                            Per                  Mossel Bay                     1 517           1 097       898
                            100 000              Garden Route District          1 771           1 190       936

           DRIVING UNDER THE INFLUENCE                 2017/18     2018/19       2019/20

                           Mossel Bay                        437         456           565
    Actual Number
                           Garden Route District         1 741      1 747         1 940
                           Mossel Bay                        465         482           593
    Per 100 000
                           Garden Route District             285         284           312

      ROAD USER         Mossel Bay                           12          35             21
      FATALITIES        Garden Route District              137          128            131

                                    RESIDENTIAL BURGLARIES                 2017/18           2018/19    2019/20

                                                Mossel Bay                      934             927       797
                          Actual Number
                                                Garden Route District          5 211          5 171      4 856
                                                Mossel Bay                      995             980       836
                          Per 100 000
                                                Garden Route District           853             839       782

2020 Socio-economic Profile: Mossel Bay Municipality                                                              14
Safety and Security Murder Murder is defined as the unlawful and intentional killing of another person. Within the Mossel Bay area, the number of murders increased from 45 in 2018/19 to 50 in 2019/20. The murder rate (per 100 000 people) increased from 47 in 2019/18 to 52 in 2019/20. The murder rate for the GRD decreased from 35 in 2018/19 to 33 in 2019/20. The murder rate in Mossel Bay is amongst the highest in the Garden Route District. Sexual Offences Sexual offences include rape (updated to the new definition of rape to provide for the inclusion of male rape), sex work, pornography, public indecency and human trafficking. In 2019/20, there were 111 sexual offences in the Mossel Bay area compared to 975 reported cases in the GRD. The incidence of sexual offences (per 100 000 population) is the second lowest in Mossel Bay (116) compared to other local municipalities in GRD. Drug-related Offences Drug-related crimes refer to the situation where the perpetrator is found to be in possession of, under the influence of, or selling illegal drugs. Drug-related crime within the Mossel Bay area decreased from 1 038 cases in 2018/19 to 855 cases in 2019/20. The GRD’s drug-related offences decreased sharply from 7 330 in 2018/19 to 5 814 in 2019/20. When considering the rate per 100 000 people, with 898 crimes per 100 000 people in 2019/20, the Mossel Bay area is below that of the District (936). Driving under the influence (DUI) A situation where the driver of a vehicle is found to be over the legal blood alcohol limit. The number of cases of driving under the influence of alcohol or drugs in the Mossel Bay area shows an increase of 109, from 456 in 2018/19 to 565 in 2019/20. This translates into a rate of 593 per 100 000 people which is much higher than the District’s 312 per 100 000 people. Fatal crashes in the municipal area decreased notably from 29 in 2018/19 17 in 2019/20. The number of road-user fatalities in turn also decreased from 35 to 21 across this period. Residential Burglaries The unlawful entry of a residential structure with the intent to commit a crime, usually a theft. The 2019/20 crime statistics released by SAPS and Stats SA indicate that the number of residential burglaries fell by 6.7 per cent in South Africa. Within the Western Cape Province, burglaries at residential areas decrease by 8.5 per cent between 2018/2019 and 2019/2020. However, the residential burglary crime rate cases within the Mossel Bay area declined from 980 in 2018/19 to 836 in 2019/20. When considering the rate per 100 000 populations, with 836 cases per 100 000 in 2019/20, Mossel Bay’s rate is above the GRD rate of 782 per 100 000 in the same reporting year. 2020 Socio-economic Profile: Mossel Bay Municipality 15
Economy and Labour Market Performance

                                                                  GDPR                                              Employment
                                                                                         Real                          Average
                   SECTOR                                                                                                                        Net
                                            R million            Trend                  GDPR       Number of            annual
                                                                                                                                               change
                                           value 2018         2014 - 2018               growth     jobs 2018            change
                                                                                                                                                2019e
                                                                                        2019e                         2014 - 2018
  PS    Primary Sector                            437.7               -0.3                 -5.2            3 784                     0             -65
        Agriculture, forestry & fishing            337.8                  -0.8             -5.9            3 682                    -1             -61
        Mining & quarrying                         100.0                  1.7              -2.5             102                      1                 -4
  SS    Secondary sector                      1 675.2                 -2.4                 -4.8            5 514                   -67            -385
        Manufacturing                         1 133.0                     -2.2             -4.1            3 295                   -23             -98
        Electricity, gas & water                   161.3                  -3.0             -4.9             101                      0                 -5
        Construction                               380.8                  -3.1             -7.5            2 118                   -43            -282
        Tertiary sector                       5 603.5                     2.3               1.9           27 757                   529                 96
  TS
        Wholesale & retail trade,
                                              1 350.2                     1.2               0.0            9 330                   191             117
        catering &accommodation
        Transport, storage &
                                                   778.5                  2.1               0.1            1 736                    20                 67
        communication
        Finance, insurance, real
                                              2 183.6                     3.5               3.6            7 651                   260                 31
        estate & business services
        General government                         760.8                  0.6               1.1            3 753                    21                 45
        Community, social &
                                                   530.5                  1.5               1.0            5 287                    37            -164
        personal services
        Mossel Bay                            7 716.3                     1.1               0.2           37 055                   462            -354

                                              Skill Level                                                             Number of jobs
                Skill Levels                                               Average growth (%)
                                           Contribution 2019
            Formal employment                                                 2015 - 2019                      2018                       2019
                                                  (%)
        Skilled                                            33.6                            3.7                      8 624                      8 837
        Semi-skilled                                       41.5                            1.0                     10 900                   10 909
        Low-skilled                                        24.9                            0.2                      6 582                      6 559
        TOTAL                                         100.0                                1.7                 26 106                       26 305

              Informal
                                2009      2010       2011         2012           2013      2014   2015       2016       2017         2018        2019
            Employment
       Number of informal
                               12 107     10 924     10 829       10 790     11 302 11 491        11 810    10 823     11 236       10 949      10 396
       jobs
       % of Total
                                   35.7    33.6       32.9         32.0          32.5      32.6    32.4      29.9       30.5         29.5         28.3
       Employment

          Unemployment
                                2009      2010       2011         2012           2013      2014    2015      2016       2017         2018        2019
              rates
        Bitou                      17.8    19.7       19.9         19.9          19.7      19.9    19.9       21.5          22.3     22.2         17.8
        George                     13.2    14.3       14.1         13.8          13.2      13.2    12.7       13.5          13.8     13.4         14.3
        Hessequa                    6.1     6.9        6.9          6.7           6.4       6.5     6.0        6.6           6.7         6.6       7.2
        Kannaland                   7.2     8.2        8.4          8.3           7.9       8.1     7.4        8.1           8.5         8.4       9.1
        Knysna                     16.0    17.3       17.2         17.0          16.6      16.6    16.4       17.5          18.0     17.7         19.0
        Mossel Bay                 12.8    13.9       13.9         13.7          13.3      13.4    13.1       14.1          14.5     14.3         15.3
        Oudtshoorn                 17.7    18.7       18.6         18.2          17.6      17.5    16.8       17.7          18.1     17.6         17.7
        Garden Route               13.5    14.7       14.6         14.4          13.9      13.9    13.5       14.5          14.8     14.6         15.6
        Western Cape               14.2    15.5       15.7         15.8          15.7      16.0    16.1       17.3          18.1     18.0         19.4

2020 Socio-economic Profile: Mossel Bay Municipality                                                                                                   16
Economy and Labour Market Performance Sectoral Overview In 2018, the economy of Mossel Bay was valued at R7.716 billion (current prices) and employed 37 055 people. Historical trends between 2014 and 2018 indicate that the municipal area realised an average annual growth rate of 1.1 per cent which can mostly be attributed to the tertiary sector that registered a positive annual growth rate of 2.3 per cent. In terms of sectoral contribution, the finance, insurance, real estate and business services (R2.184 billion), wholesale and retail trade, catering and accommodation (R1.350 billion) and manufacturing (R1.133 billion) sectors were the main drivers that contributed to the positive growth in the tertiary sector. These sectors are also estimated to have performed well in 2019, particularly the finance, insurance and real estate services sector, which is estimated to have grown by 3.5 per cent. Employment creation in the finance, insurance, real estate and business services sector did not mirror the high growth rate, with only 31 new jobs created. The wholesale and retail trade, catering and accommodation sector, however, remained an important source of job creation in the municipal area, with an estimated 117 new jobs created in 2019. In 2019, the manufacturing sector mirrored its negative growth with an estimated 98 job losses in 2019. Despite its important role in the local economy, particularly as one of the main sources of employment, the agriculture, forestry and fishing sector experienced below-average performance between 2014 and 2018, and is estimated to have contracted by 0.8 per cent in 2019. This contraction led to the loss of 61 jobs. The agriculture, forestry and fishing sector is still recovering from the provincial drought. Formal and Informal Employment It is estimated that total employment Mossel Bay in 2019 amount to 36 701 workers of which 26 305 (71.6 per cent) are in the formal sector while 10 396 (28.3 per cent) are informally employed. Most of the labour force consisted of semi-skilled (41,5 per cent) and low-skilled (24.9 per cent) workers. Although the skilled category contributed 33.6 per cent to total formal employment, it notably outpaced the other two categories in terms of average annual growth – between 2015 and 2019, the skilled cohort grew on average by 3.7 per cent (albeit off a small base) while the low-skilled and semi-skilled categories grew at 0.2 and 1 per cent respectively. The growth in the skilled category reflects the market demand for more skilled labour, especially when considering the nature of ongoing developments in and around PetroSA. Evidently, the demand for skilled labour is on the rise which implies the need to capacitate and empower low-skilled and semi-skilled workers. Formal employment overall grew by 1,7 per cent between 2015 – 2019. Unemployment Mossel Bay (15.3 per cent) has the fourth highest unemployment rate in the entire GRD. Both the GRD (15.6 per cent) and the Western Cape province(19.4 per cent) unemployment rates are higher than that of Mossel Bay. Mossel Bay’s high unemployment rate is particularly concerning given that this estimate is based on the narrow definition of unemployment i.e. the percentage of people that are able to work, but unable to find employment. In turn, the broad definition generally refers to people that are able to work, but not actively seeking employment. 2020 Socio-economic Profile: Mossel Bay Municipality 17
PUBLIC INFRASTRUCTURE SPEND

                                                Provincial infrastructure spend
                                         1.8%           0.9%
                       24.1%

                                                                                 Education
                5.2%
                                                                                 Health
                                                                                 Human Settlements
                                                                                 Public Works
                                                   67.9%                         Social Development
                                                                                 Transport

                         Municipal infrastructure spend (R’000)

                     Trading Services                          Other
                                        49%                     10%

                                                           Economic Infrastructure
                                                                              20%

                        Social Infrastructure
                                         21%

                              Other                                    R23 930
               Waste Management                R4 078
         Waste Water Management                                                   R34 307
                              Water                                                           R45 919
                          Electricity                                        R30 166
                             Health      R0
                           Housing                                          R28 824
                       Public Safety             R5 929
              Sports and Recreation                        R13 795
               Social Development         R1 635
           Environmental Protection       R896
                     Road transport                                                          R43 978
         Planning and Development             R2 619

2020 Socio-economic Profile: Mossel Bay Municipality                                                    18
Public Infrastructure Spend (2020/21) Spending on Social Infrastructure Spending on social infrastructure aids in social development and has the spill-over effect of enabling economic growth. The WCG will spend 70.6 per cent of its infrastructure budget on social infrastructure. As displayed in the pie chart the WCG will be allocating 1.8 per cent of the budget (R5 million) towards Education in the municipal area. Spending on education is crucial as it can serve to improve education outcomes and skills levels within a community, and more importantly alleviate poverty through increased long-term income for individuals. A healthy and resilient community increases productivity and reduces pressures on government resources. As such the Department of Health has allocated 0.9 per cent (R2.501 million) of infrastructure spending towards Health. The majority (67.9 per cent; R185.698 million) of the WCG infrastructure spending will however be allocated towards Human Settlements. With the Municipalities additional allocation of R28.824 million towards housing, these will go a long way towards reducing the housing backlogs. The Municipality has also allocated 2.5 per cent (R5.929 million) of capital spending on public safety, 5.8 per cent (R13.795 million) on sports and recreation and 0.7 per cent (R1.635 million) on social development serving to improve the quality of life of individuals within the municipal area. Spending on Economic Infrastructure Economic infrastructure is defined as infrastructure that promotes economic activity. Considering the sluggish economic growth throughout the country, spending on economic infrastructure is crucial to stimulating economic activity. The WCG allocated R80.281 million (29.4 per cent) towards economic infrastructure, more specifically towards transport (R66 million) and public works (R14.281 million). The Municipality contributes a further R43.978 million (i.e. 18.6 per cent of total municipal infrastructure spending) towards road transport. As part of their economic infrastructure allocation, the Municipality will also contribute R896 000 towards environmental protection and R2.619 million towards planning and development. Spending on Trading Services Basic services are crucial to improving the living conditions of citizens within the municipal area and enabling economic activity for businesses via access to water, electricity, sanitation and refuse removal. The majority of the Municipality’s infrastructure budget i.e. 48.5 per cent or R114.470 million is allocated towards the provision of basic services. The bulk of the spending on trading services has been allocated towards water management (R45.919 million). This was followed by wastewater management (R34.307 million), electricity (R30.166 million) and waste management (R4.078 million). 2020 Socio-economic Profile: Mossel Bay Municipality 19
1.    Demographics

       • Population: Department of Social Development, 2020
       • Sex ratio: Department of Social Development, 2020
       • Age cohorts: Department of Social Development, 2020
       • Number of households: Department of Social Development, 2020
       • Household size: Department of Social Development, 2020
       • Population density: Department of Social Development, 2020

 2.    Education

       • Learner enrolment: Western Cape Education Department, 2020; Annual Survey of Public and
         Independent Schools (ASS), 2019
       • Learner-teacher ratio: Western Cape Education Department, 2020; Annual Survey of Public and
         Independent Schools (ASS), 2019
       • Learner retention: Western Cape Education Department, 2020; Annual Survey of Public and
         Independent Schools (ASS), 2019
       • Educational facilities: Western Cape Education Department, 2020; Annual Survey of Public and
         Independent Schools (ASS), 2019
       • No-fee schools: Western Cape Education Department, 2020; Annual Survey of Public and
         Independent Schools (ASS), 2019
       • Schools with libraries: Western Cape Education Department, 2020; Annual Survey of Public and
         Independent Schools (ASS), 2019
       • Educational outcomes: Western Cape Education Department, 2020; Annual Survey of Public
         and Independent Schools (ASS), 2019

 3.    Health

       • Healthcare facilities: Department of Health, 2020
       • Emergency medical services: Department of Health, 2020
       • HIV/AIDS: Department of Health, 2019Tuberculosis: Department of Health, 2020
       • Child health: Department of Health, 2020
       • Maternal health: Department of Health, 2020

 4.    Poverty

       • GDPR per capita: Statistics South Africa, 2020
       • Income Inequality (Gini-coefficient): Quantec Research, 2020
       • Human Development (Human Development Index): Quantec Research, 2020

2020 Socio-economic Profile: Mossel Bay Municipality                                                20
5. Basic services
• Households: Quantec Research, 2020
• Access to housing: Quantec Research, 2020
• Access to water: Quantec Research, 2020
• Access to electricity: Quantec Research, 2020
• Access to sanitation: Quantec Research, 2020
• Access to refuse removal: Quantec Research, 2020
• Free Basic Services: Statistics South Africa, Non-Financial Census of Municipalities 2019
6. Safety and security
• Murder: South African Police Service (SAPS), 2020, own calculations
• Sexual offences: South African Police Service (SAPS), 2020, own calculations
• Drug-related crimes: South African Police Service (SAPS), 2020, own calculations
• Driving under the influence: South African Police Service (SAPS), 2020, own calculations
• Residential burglaries: South African Police Service (SAPS), 2020, own calculations
• Road user fatalities: Department of Transport and Public Works, 2020
7. Economy
• Sector Performance: Quantec Research, 2020
• Employment growth per sector: Quantec Research, 2020
• Trends in labour force skills: Quantec Research, 2020
• Unemployment rates: Quantec Research, 2020
8. Public infrastructure spend
• Provincial Infrastructure Spend: Estimates of Provincial Revenue and Expenditure (EPRE), 2020;
Overview of Adjusted Provincial and Municipal Infrastructure Spend (OAPMII), 2020
• Municipal Infrastructure Spend: Final approved 2020/21 municipal budgets, Budget Schedule A5
2020 Socio-economic Profile: Mossel Bay Municipality 21You can also read