State of the Nanaimo Economy - The City of Nanaimo
←
→
Page content transcription
If your browser does not render page correctly, please read the page content below
2020
      State of the
Nanaimo Economy
Table of Contents

Executive Summary                    1   Rental Market                           27

Demographics		                           Senior's Housing                        29

Population                           5   Labour Force

Migration                            7   Labour Force                            31

Age Breakdown                        9   Unemployment Rate                       33

Diversity                           11   Labour Force Participation Rate         35

Business                                 Employment by Industry Sector           37

Business Licenses                   13   Labour Force by Occupation              39

Size of Business                    15   Labour Force by Education               41

The BC Provincial Nominee Program   17   VIU Enrollment                          43

Development                              Income

Building Permits                    19   Median, Average and Per Capita Income   45

Major Projects                      21   Income Distribution                     47

Housing and Real Estate                  Tourism

Housing                             23   Tourism                                 49

Housing Prices                      25
Executive Summary
    The State of the Nanaimo Economy annual publication provides           2019 was an all-time record-breaking year for building permit
    data, analysis and insights on Nanaimo’s current economic and          activity at $445.3 million, nearly double our historical best of
    business conditions. The City of Nanaimo continues to be a             $253 million in 2007. Considerable growth occurred across all
    hotspot for new businesses and residents. Nanaimo’s growth rate        building permit categories. It is important to see growth in non-
    is outpacing the Regional District of Nanaimo (RDN), Vancouver         residential building permits, as business investment contributes
    Island, BC and Canada. At almost 100,000 residents, the City’s         to long-term economic growth and leads to increased productivity.
    population has grown by 35% since 2001.                                Non-residential building permit values nearly quadrupled in
                                                                           2019 compared to 2018. Notably, in 2019 and 2018 there were
    On average, each year over 3,000 new residents move into the           34 projects with a minimum value of $2 million or more. The
    Regional District of Nanaimo. In recent years, origins of the vast     past year has seen an impressive array of mixed use projects
    majority of newcomers have shifted from other provinces to             including multi-family dwellings, medical offices, apartments,
    within BC. Looking forward, population will continue to grow, but      condominiums, affordable housing and hotel developments.
    at a slower pace. Gains will be made in most age categories but
    the largest growth will occur in the 65+ category.                     Excellent transportation, education and telecommunication
                                                                           infrastructure are some of Nanaimo’s key competitive advantages,
    As the overall population grows, Nanaimo is seeing greater             drawing ever more businesses and entrepreneurs to invest in our
    diversity in its population. The three largest minorities in Nanaimo   region. Significant Infrastructure investments by the Nanaimo
    are Chinese (2.6%), South Asian (2.2%), and Filipino (1.1%). Visible   Airport, the Nanaimo Port Authority, Vancouver Island University
    minorities represent 9.9% of the City’s population, whereas BC         and Telus continued in 2019. The Nanaimo Airport completed
    compares at 31.1%. Diversity of population is an important factor      a $14.2 million terminal expansion, while the Nanaimo Port
    in building successful cities.                                         Authority started a $100 million expansion and upgrade project at
                                                                           their Duke Point facility. VIU had $7.6 million worth of upgrades
    6,233 businesses were licensed in the City of Nanaimo in 2019.         underway in 2019 and Telus is in the midst of completing a $65
    The Construction sector held the largest number of business            million fibre-to-the-premise project.
    licenses, followed by Professional/Scientific/Technical, and the
    Retail sector. Over the past decade, business licenses have grown
    by 9%. Businesses have been expanding human resource capacity.
    Overall, Nanaimo’s businesses with employees grew by 16.7% in
    the past decade.

1                                                                                                                                              2
Demographics

               2019 was a record year for housing starts in Nanaimo, with over half     Median, average and per capita income in Nanaimo is projected
               being purpose-built rental units. There is a significant trend towards   to grow by 4%, 3.5% and 3.8% per annum over the next five years.
               denser forms of housing (apartments, condos) compared to single          Despite growing at a faster rate, Nanaimo still lags behind BC’s
               or semi-detached housing. This is in part due to rising real estate      average in all three categories.
               values, higher interest rates and stricter mortgage qualifications.
                                                                                        Every year BC Business Magazine ranks the “best cities for work
               While the new housing market in Vancouver and Victoria showed            in BC” comparing 46 communities across the province on 10
               signs of cooling down in 2019, this was not yet the case in              economic indicators. The City of Nanaimo ranked 8th best City to
               Nanaimo. While the average price for a new single-family detached        work in the province of British Columbia for 2020. This is a jump
               home dropped by 14% in Vancouver and 7% in Victoria, it increased        from 15th place ranking in 2019.
               by 11% in Nanaimo (CMHC Oct 2019). Despite this, the same brand
               new single-family home in Nanaimo costs roughly one-third the            Economic growth in BC is projected to trend modestly near two
               price of Vancouver and three-quarters the price of Victoria.             percent through to 2022 according to Economic outlooks by
                                                                                        various banks. Global trade uncertainty and a weaker forestry
               In 2019, average rent increased by 8% in Nanaimo, 3% in Victoria         sector are the risk factors moving forward. Housing construction
               and 6% in Vancouver. Despite the increase in available rental units,     is expected to be slower over the next few years. Major project
               total supply was insufficient to meet demand, driving vacancy            construction such as pipelines, LNG Canada, the Pattullo Bridge
               rate down to 2.0% from 2.5%.                                             replacement, and the new Vancouver SkyTrain developments are
                                                                                        expected to drive significant increase in interprovincial migration.
               The service industry sector accounted for 83.1% of Nanaimo’s             Consumer demand is expected to rise due to tight labour market
               employment base in 2019, and the goods-producing sector                  conditions and rising populations.
               accounted for 16.9%. The greatest number of jobs are provided
               by the retail, healthcare and social assistance sector. Nanaimo’s
               labour force and participation rate continues to grow. At 4.6%,
               Nanaimo’s unemployment rate is in the healthy range (4.5 to 5.0%).

               Although education levels have been increasing overtime,
               Nanaimo lags behind BC in post-secondary credentials. Student
               enrollment at VIU continued to grow in 2018 with international
               student enrollment increasing by 20%, and overall student
               enrollment increasing by 4%.

  3                                                                                                                                                            4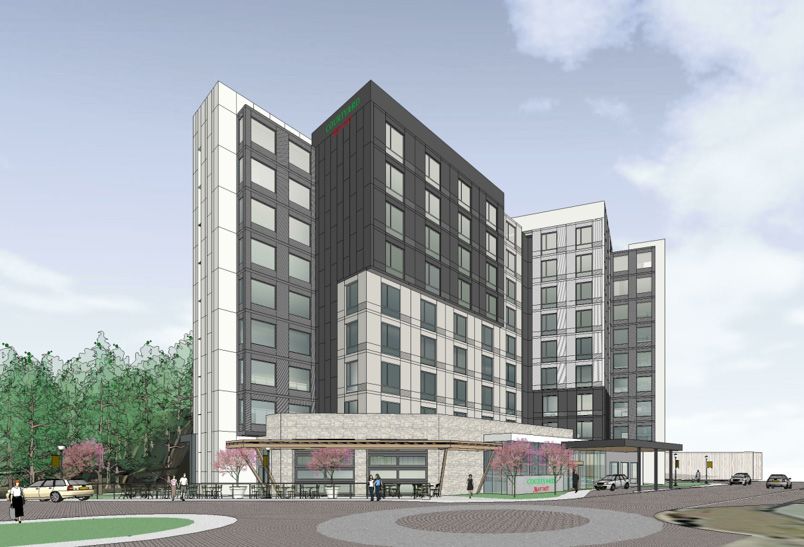
Demographics

                                                          City of Nanaimo Population

                                                                                                        106,254
                                                                                                                         Population
                  Actual
                                                                                       98,957
                Projected                                                                                                The City of Nanaimo’s population for 2019 is estimated at 98,957.
                                                                      90,504                                             The population growth rate between 2018 and 2019 was 1.4%. The
                                                                                                                         average annual growth rate over the past five years in Nanaimo is
                                                 83,810                                                                  2.02%. By 2024, the City’s population is expected to increase by 7,297
                                                                                                                         persons, to 106,254. Nanaimo’s average growth rate over the next
                                78,690
                                                                                                            7%           five years was estimated at 1.5% annually.
               72,980
                                                                                        9%             7%                The RDN’s population for 2019 is 168,947 and the average
                                                                                                                         growth rate over the next five years is estimated at 1.1% annually.
                                                                                       9%                                Comparatively, over the next five years, the Vancouver Island Coast
                                                                         8%
                                                                                                                         region will grow at 1% annually and BC’s at 1.3% annually.
                                                     7%
                                                                    8%
                                    8%          7%                                                                       Population growth rate will be slower over the next five years
                                                                                                                         compared to the past five years. However the City of Nanaimo’s
                               8%                                                                                        growth rate is expected to continue to outpace the regional district,
                                                                                                                         the island and the province.

                                                                                                                         source : bc stats , census canada

                        2001             2006                2011              2016             2019              2024

  5                                                                                                                                                                                               6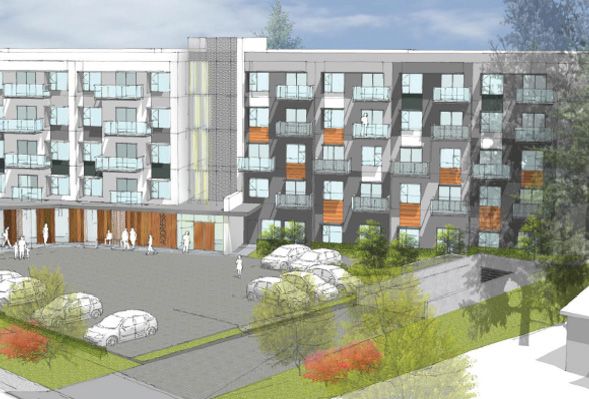
Demographics

               Origin of New Residents (Regional District of Nanaimo)
                                                                        Migration

                                                                        Population growth is driven by two factors: natural increase and
                                                                        migration. Nanaimo’s population growth has resulted from migration.
                                                                        People move to new areas for a variety of reasons including
                                                                        employment opportunities and quality of life factors. There are three
                                                                        types of migrants: intra-provincial (within BC), inter-provincial (other
                                                                        provinces) and international immigrants (outside of Canada). In the
                                                                        past five years, on average over 3,000 net new migrants have located
                                                                        in the Nanaimo Regional District.

                                                                        Migration from within BC to the Regional District has been on the
                                                                        rise in the last five years. Interprovincial migration was highest in
                                                                        2016 but has been declining since for BC and the Nanaimo region.
                                                                        While International migration to BC has been on a steady rise since
                                                                        2014-15, Nanaimo’s numbers have seen more fluctuation and less
                                                                        predictability over the past five years.

                                                                        While BC’s total migration has seen a steady increase, Nanaimo saw
                                                                        a dip in total migration numbers from 2017 to 2018. Nonetheless, on
                                                                        average over the past 5 years Nanaimo has been capturing 5.8% of the
                                                                        net migrants to BC. Overall, Nanaimo is posting a higher population
                                                                        growth rate than the regional district, Vancouver Island and BC.

                                                                        source : bc stats

  7                                                                                                                                                8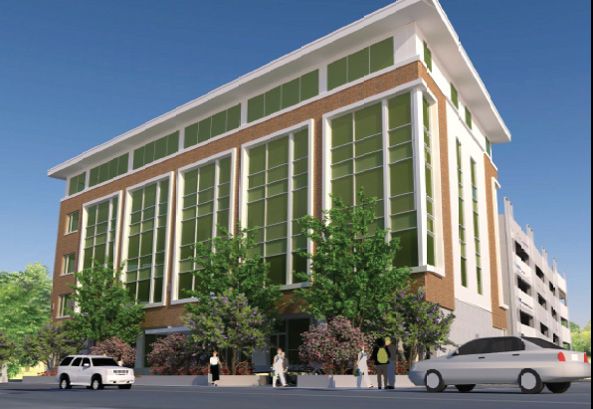
Demographics
City of Nanaimo Age Breakdown
Age Breakdown
11% 10%
In 2019, 63% of Nanaimo’s population was working age (15-64).
27% 26%
Working age population is expected to increase by 4.4% over the next
13% five years (64,757).
14%
Children (aged 0-14 years) represent 14% of Nanaimo’s total
2024
2019 population. This segment of population will increase by 4.1% by 2024.
The 65+ category represented 23% of total population in 2019 and is
expected to grow another 17.1% by 2024.
23% 25% By 2024, the working age category is expected to represent 61%, the
26% children category 13%, and the 65+ category 26% of total population.
25%
Looking forward, population will grow at a slower pace. Gains will be
made in most age categories but the largest growth will occur in the
65+ category.
Children Young Adults Early Working Years Later Working Years Retirement
(0-14) (15-24) (25-44) (44-64) (65+)
2019 2019 2019 2019 2019
13,680 10,342 24,243 27,421 23,271
2024 2024 2024 2024 2024
4.1% 1.4% 14.4% 3.2% 17.1% source : bc stats
9 10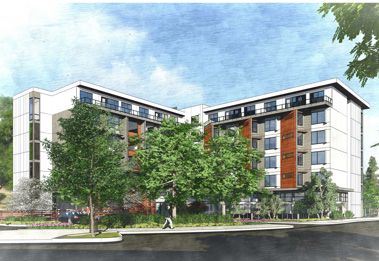
City of Nanaimo Ethnic Origins City of Nanaimo Visible Minorities
Demographics
(2016)
2019 2024 % Change
Diversity
Chinese 2,762 3,131 13%
Latin American 550 599 9% The largest segment of residents in Nanaimo are of European origins,
representing 79% of the total population. At 27%, the second highest
Other North American group is Other North American Origin (excluding Aboriginal), and the
Origins Filipino 928 997 7% third largest is Asian origins at 10%. Aboriginal origins represent 8.4%
European Origins
of the population. The largest population gains in the last census were
Black 760 778 2% in the Asian and European origin categories.
Visible minorities represent 9.9% of Nanaimo’s total population. As
Japanese 473 482 2% the overall population grows, Nanaimo is seeing greater diversity in
its population. The three largest minorities in Nanaimo are Chinese
Southeast Asian 836 844 1% (2.6%), South Asian (2.2%), and Filipino (1.1%). The total visible minority
Asian Origins Aboriginal Origins population in Nanaimo is expected to increase by 5% by 2024. The
largest growth is expected to come from Chinese migrants (369
West Asian 198 200 1%
persons), followed by Filipino (69 persons) and Latin American
(49 persons).
Arab 281 282 0%
BC’s visible minority population is at 31.1%. The three largest
0% minorities in BC are Chinese (11.7%), South Asian (7.8%), and Filipino
South Asian 2,207 2,200
(3.6%). Vancouver has the most diverse population in BC with visible
minorities representing 48.9% of the total population — with Chinese
African Origins Latin, Central & South -2%
Korean 401 392 at 19.6%, South Asian 12% and Filipino at 5.1%.
American Origins
Visible Minority -6%
(not inc. elsewhere)
78 73
Multiple 254 229 -10%
source : 2016 census , environic analytics
Total 9,728 10,207 5%
Oceania Origins
P ROJEC TE D
11 12Business
Business Licenses by Industry Sector (City of Nanaimo 2019)
Business Licenses
Professional, Scientific, Technical 780 Finance and Insurance 126
Retail Trade 760 Wholesale Trade 120 In 2019, the City of Nanaimo had 6,233 licensed businesses. The
largest number of business licenses were issued to the Construction
sector, followed by Professional Scientific and Technical Services and
Other Services (except Public Admin.) 653 Education and Training 82 the Retail sector.
The number of total businesses licensed increased by 9% over the
Health Care and Social Assistance 646 Information and Cultural 41 last decade. 2019 business licenses increased by 87, representing
1% growth over 2018. (Note: business licenses represent all types
of private businesses, sole proprietorships, partnerships and
Admin. + Support, Waste Mgmt. + Remed. 503 Mgmt. of Companies/Enterprises 3 incorporated businesses).
Real Estate, Rental and Leasing 449 Construction 1,171
Accommodation and Food Services 346 Manufacturing 162
Arts, Entertainment and Recreation 212 Agriculture, Forestry, Fishing and Hunting 11
Transportation and Warehousing 166 Utilities 2
Goods Producing Sector Service Producing Sector
source : city of nanaimo
13 14Business
Businesses by Employee Size (City of Nanaimo)
Size of Business
2008 2013 2018 10 Year Growth Rate (2008-18)
Overall Nanaimo’s businesses with employees (one or more) grew
1-4 1,508 1,643 1,729 14.7% by 16.7% in the past decade. The rate of growth was 4.3% in the
past five years (2013-2018) compared to 11.9% in the five years
prior (2008-2013). Tighter labour market conditions and increasing
5-9 693 703 720 4.0% real estate costs over the last five years have likely contributed to
the lower human resource expansion rates. Significant growth in
entrepreneurship and sole proprietorship has likely contributed as well.
10-19 382 472 516 35.1%
20-49 223 294 276 23.8%
50-99 55 89 84 52.7%
100-199 21 28 32 52.4%
200-499 11 8 16 45.5%
500+ 4 5 7 65%
Total: 2,896 3,242 3,380 Average: 16.7% source : bc stats
15 16Business
Applications to the Provincial Nominee Program (City of Nanaimo) The BC Provincial Nominee Program (BC PNP)
The BC PNP facilitates the immigration of skilled foreign workers,
international students, and entrepreneurs. Prospective applicants
are nominated for permanent residency through either the Skills
Immigration stream or through the Entrepreneur Immigration stream.
Applicants under the Skills Immigration stream are selected based
on the skills, education and/or experience required for high-demand
occupations in the province. There were 439 applicants for Nanaimo
under this stream in the last ten years, of which 77% received
nominations for permanent residency.
Nominees under the Entrepreneur Immigration stream are required
to meet a determined financial investment amount ($200,000
investment), and demonstrate the ability to create job opportunities
There were 162 applicants for Nanaimo in the last ten years of which
19% received nominations and work permits. Over the past decade
$12 million were invested and 53 new jobs were created in Nanaimo
through the BC PNP Program.
Skills Immigration Application
Entrepreneur Immigration
Application
source : bc ministry of jobs , trade and technology
17 18$445.3 mil.
1
Development
13.9
City of Nanaimo Building Permit Value 2014-2019
Building Permits
10
80.4
Residential
Commercial
2019, was an all-time record breaking year for building permit activity.
Industrial At $445.3 million in 2019 building permit values increased by 106%
over 2018. Prior to 2019, the highest year recorded for building
Public
340 permit activity was 2007at $253 million.
Miscellaneous
Overall, residential permits accounted for 76% of the total value
of building permits, commercial for 18%, and industrial and public
combined for 5.3%.
$228.9 mil. In 2019 growth occurred in each category of building permits issued.
$212.6 mil. $216 mil. Residential permits grew by 83%, commercial by 207%, industrial by
1.1 $204.6 mil. $203.3 mil. 733% and public by 827% over 2018 values. Non-residential building
17.5
0.8
1
1.5
permit values nearly quadrupled in 2019 in comparison to 2018.
0.8 10.5 1.2
7 4.5 0.8 26.2
10.5
60.4 2.9 5.3
39.2 36 6.5
24.5 186.1
157 160 161
142.8
source : city of nanaimo
2014 2015 2016 2017 2018 2019
19 20Development
Major Projects
In 2019 and 2018 there were 34 projects with a minimum value of $2
million or more. 2019 saw an array of mixed use projects including
multi family dwellings, medical offices, apartments, condominiums,
affordable housing and three hotel developments.
While the majority of these projects are spread throughout the north
end, downtown and south end of Nanaimo; all three hotels are in the
downtown core. These hotels will add much needed additional quality
2020 Estevan Road 1515 Dufferin Crescent accommodation in the downtown core and enable the Vancouver
NEW CHURCH, 74 RESIDENTIAL RENTAL UNITS 5-STOREY MEDICAL CENTER AND PARKADE
Island Conference Centre to bid on larger conferences.
source : city of nanaimo
100 Gordon Street 10 Buttertubs Drive
9-STOREY, 172-UNIT HOTEL 159-UNIT AFFORDABLE SENIOR HOUSING
21 22Housing and Real Estate
City of Nanaimo Housing Starts by Type (2015-2019)
Housing
Housing starts, like building permits, are a leading indicator of
economic activity. By October 2019 there were 1,141 housing starts
compared with 693 in 2018. This is 65% growth over the one year
term. There is a significant trend towards denser forms of housing i.e.
apartments, condos compared to single or semi-detached housing
due to rising real estate values, higher interest rates and stricter
mortgage qualifications.
Single-detached homes make up the majority of housing in the area.
As the city grows the mix of housing has been changing, with a decline
in single-family and increase in multi-family housing types.
Single
Apt./Other
Semi-Detached
Row
source : cmhc
23 24Housing and Real Estate
Average Home Price (Single Family, Detached House - New)
Housing Prices
Vancouver Victoria Nanaimo
The housing market in Vancouver and Victoria cooled in 2019. The
average price for a brand new single family detached home dropped
by 14% in Vancouver and 7% in Victoria and increased by 11% in
Nanaimo (CMHC Oct 2019).
2018 2018 2018
$2,534,609 $1,212,945 $755,261 Despite the drop in prices in Vancouver and Victoria the same brand
new single family detached home in Nanaimo costs roughly one-third
the price of Vancouver and three-quarters the price of Victoria.
2019 2019 2019 The average selling price of single family home in Nanaimo was
$563,725 in October 2019, up 2% from 2018.
$2,174,414 $1,131,310 $836,853
Percentage Change Percentage Change Percentage Change
14% 7% 11%
Vancouver Victoria Nanaimo
$2,174,414 $1,131,310 $836,853
source : cmhc
25 26Housing and Real Estate
Average Monthly Rent (City of Nanaimo) Rental Market
Bachelor One Bedroom Two Bedroom Three + Bedroom
67% of the residents in Nanaimo own their home while 33% live in
2018 $795 $886 $1,084 $1,265 rental accommodations (Environic Analytics 2019). Average rent for
two-bedroom apartment in Nanaimo was $1,170 in 2019 (CMHC).
The average rent in Nanaimo increased by 8% in 2019, compared to
2019 $889 $946 $1,170 $1,306 10% in 2018. Rent for a 2-bedroom apartment increased by 3% in
Victoria and 6% in Vancouver in 2019.
11% 7% 8% 3% The number of units available for rent in 2019 increased by 3.2% in
% Change
Nanaimo, by 1.3% in Vancouver and by 2.3% in Victoria. Despite the
additional supply, increased demand for rental units led to vacancy
rates dropping from 2.5% to 2.0% in Nanaimo. Between 2018 and
2019 vxacancy rate dropped in Victoria from 1.2% to 1% and increased
in Vancouver from 1.0% to 1.1%.
Comparison of Average Monthly Rent (2 Bedroom Apartment)
Vancouver Victoria Nanaimo
2018 $1,649 $1,406 $1,084
2019 $1,748 $1,448 $1,170
% Change 6% 3% 8%
source : cmhc
27 28Housing and Real Estate
Seniors Housing
The overall vacancy rate for standard space in senior’s residences in
the Nanaimo region was 2.2% in 2019, compared to 3.0% in 2018.
Demand for seniors’ housing was mainly supported by a growing
senior’s population.
328 new units were added to existing supply to bring the total to
3,038 units in 2019. Despite the additional rental supply, rising
demand led to average rent increases.胠
source : cmhc
29 30Labour Force
Labour Force Growth Rate Labour Force
24.24%
The labour force is composed of those 15 years of age and older
22.35% who are either employed or actively seeking work. Changes in the
labour force are the result of changes in population and economic
opportunities. A growing economy attracts workers from other areas
and induces people to enter the labour force. When the economy
slows, people leave in search of opportunities elsewhere or withdraw
from the labour force.
5%
On average Nanaimo’s labour force grew by 7.21% annually between
5.44% 3% 2%
2% 2014 and 2018, while the province grew at 1.54% and Vancouver
Island Coast region at 1.51%. Labour force growth rates in Nanaimo
1%
0% 2% 3% generally follow a similar pattern to that in the province as a whole,
1% however tend to have greater variance. This variability likely stems in
-0.31%
part from measurement error in the labour force survey due to small
-3%
sample size.
The five-year average growth rate is more accurate measure of labour
force activity in Nanaimo due to the variability in the labour force
-15.67% survey. In 2018, 64,400 people were in the labour force. In September
2019, 67,300 persons were in the labour force in Nanaimo.
2014 2015 2016 2017 2018
Nanaimo VIC British Columbia
source : stats canada
31 32Labour Force
Unemployment Rate
Unemployment, Participation, and Employment Rates (September 2019)
Nanaimo’s unemployment rate was 4.6% in September 2019,
66.0% 66.4%
64.0% 62.8% 62.6% slightly lower than Vancouver Island Coast (4.8%) but higher than BC
61.0% 60.1% (4.1%). Historically Nanaimo’s unemployment rate has been below
57.6%
BC's and the Canadian average. However, in the past three years
Nanaimo’s unemployment rate was higher than VIC and BC. An ideal
unemployment rate for a healthy economy is between 4.5 to 5%.
4.6% 4.8% 5.8%
4.1%
Nanaimo VIC BC Canada
Unemployment Rate Participation Rate Employment Rate
source : stats canada
33 34Labour Force
Labour Force Participation Rate
Nanaimo’s labour force participation rate has been increasing in recent
years with a slight dip in the first nine months of 2019. The labour
force participation rate measures the share of the population 15 years
and over that are in the labour force.
Regions with younger populations tend to have higher labour force
participation rates while those with an older population have lower
rates. Participation rates also tend to fall during recessions and rise
during expansions.
Nanaimo’s labour force participation rate tends to be lower than
BC, and Canada but relatively similar to the Vancouver Island Coast
Region. This is a reflection of the older age structure of Nanaimo
and Vancouver Island Coast (VIC) population and is consistent with
historical patterns. The greater variability in Nanaimo’s participation
rate is likely due to the smaller sample size of the labour force survey.
source : stats canada
35 36Labour Force
Percentage of Labour Force by Industry Sector (City of Nanaimo 2019)
Retail Trade 14.82% Information and Cultural 2.85%
Employment by Industry Sector
Health Care and Social Assistance 14.79% Wholesale Trade 2.46% The service industry sector accounted for 83.1% of Nanaimo’s
employment base in 2019 and the goods producing sector 16.9%.
Accommodation and Food Services 8.56% Arts, Entertainment and Recreation 1.90% The greatest number of jobs are provided by the retail and healthcare
and social assistance sector followed by construction, accommodation
and food services and educational services.
Educational Services 6.92% Real Estate, Rental and Leasing 1.69%
Professional, Scientific, Technical 6.31% Mgmt. of Companies/Enterprises 0.51%
Admin. + Support, Waste Mgmt. + Remed. 5.19% Construction 8.82%
Public Administration 4.90% Manufacturing 4.27%
Other Services (except Public Admin.) 4.69% Agriculture, Forestry, Fishing and Hunting 2.34%
Transportation and Warehousing 4.68% Mining, Oil, and Gas 0.96%
Finance and Insurance 3.30% Utilities 0.51%
source : environic analytics
Goods Producing Sector Service Producing Sector
37 38Labour Force
Workplace
Labour Force: Occupation, Workplace, Transportation
Fixed Workplace 77%
Trades, Transport, Business, Finance, Sales and service occupations made up 27.6% of all jobs in Nanaimo
Sales and Service Equipment Operators Administration No Fixed Workplace 15% in 2019. The next three categories (Business, Finance, Administration,
Education, Law and Social, Community and Government Services and
Work at Home 8% Management Occupations) fall into professional services and together
they account for the largest number of occupations (34%) in Nanaimo.
The next three categories fall into professional services, together they
Work Outside of Canada 0.43% account for the largest number of occupations
(34%) in Nanaimo.
Education, Law and Management Health
Social, Community and Occupations 77% of the workforce have a fixed place of work, followed by 15% who
Government Service travel to different worksites. Approximately 8% of the workforce work
Mode of Transportation
at home, and nearly half a percent work outside of Canada. The vast
majority (77%) of the workforce drive to work.
Drive to Work 77%
Car Passenger 7%
Natural and Applied Arts, Culture, Manufacturing and
Science Recreation and Sport Utilities
Public Transit 4%
Walk 7%
Cycle 2%
Natural Resources, Not Applicable
Agriculture and
Other Method 2%
source : environic analytics
Related Production
39 40Labour Force
Educational Attainment (City of Nanaimo, Ages 25-64)
Labour Force by Education
When considering perhaps the most productive portion of the
No Certificate, Diploma or Degree labour force (those between the ages of 25-64) Nanaimo has a
higher proportion of high school graduates (28.5%) compared to BC
(26.5%), but lower proportion of population holding post-secondary
credentials. Nanaimo’s portion of population with a bachelor's level of
High School Diploma or Equivalent education or above is 23.3% compared with BC's average of 29.9%.
Apprenticeship/Trade Certificate/Diploma
College or Non-University Cert. or Diploma
University Cert./Diploma below Bachelor
Bachelor's Degree
University Cert./Diploma above Bachelor Level
source : 2016 census
41 42Labour Force
VIU Enrollment
Student enrollment at VIU continued to grow in 2018. International
student enrollment increased by 20% while overall student enrollment
increased by 4%.
Business counts in the educational services sector grew by 6% from
69 to 73 in 2018. Employment in the educational services sector in
the City of Nanaimo was at 3,355 during the 2016 Census, a growth
of 6% from 2011.
Going forward enrollments are expected to continue to grow at
modest rates. Ongoing trade tensions with China could lead to fewer
students from China choosing to study in BC potentially impacting VIU
international student numbers.
source : ministry of advanced education and training
43 44Income
City of Nanaimo Median, Average, and Per Capita Income
Median, Average and Per Capita Income
AVERAGE AVERAGE
PER CAPITA HOUSEHOLD PER CAPITA HOUSEHOLD
$103,945 $37,509 $88,057 In 2019, the median household income in the City of Nanaimo was
$44,587
$69,492. This is a 17.5% increase in the last five years. By 2024,
Nanaimo’s median household income is projected at $83,428, growth
of 20.1%. BC’s Median household income was $79,513 in 2019 and is
projected to grow by 15.8% over the next five years.
2024 2019
In 2019, the average household income in the City of Nanaimo
was $88,057, an increase of 20.7% in the past five years. Average
MEDIAN MEDIAN household income is projected to reach $103,945 by 2024. BC’s
HOUSEHOLD
HOUSEHOLD average income for 2019 was $105,535 and is projected to grow to
$83,428 $69,402
$122,281 by 2024.
Nanaimo’s per capita income in 2019 was $37,509, this is an increase
of 19.7% in the past five years. Projected per capita income for 2024 is
$44,587, an increase of 18.9%. BC’s per capita income was $42,267 in
PER CAPITA
AVERAGE 2019 and will reach $48,864 by 2024.
$31,337 HOUSEHOLD
$72,939 Nanaimo’s projected rate of growth in median, average and per capita
income is higher than BC, however Nanaimo is still below BC’s average
in all three categories.
2014
MEDIAN
HOUSEHOLD
$59,136
source : enivronic analytics
45 46Income
City of Nanaimo Income Distribution (2019)
Income Distribution
The largest number of households in Nanaimo (7,624 or 18.7%) report
< $19,999 household income between $20,000 and $39,999 per annum.
The second largest number of households (7,392 or 18.1%) report
$20,000 - $39,999 household income of $100,000 to $149,999 per annum.
32% of the households in Nanaimo earned $100,000 or more in 2019,
$40,000 - $59,999
while 28% earned between $60,000 to $99,999.
$60,000 - $79,999
$80,000 - $99,999
$100,000 - $149,999
$150,000 - $199,999
$200,000 - $299,999
$300,000+
source : environic analytics
47 48Tourism
Tourism
Overall, Nanaimo's tourism sector had a strong year. The average
occupancy rate in Nanaimo was 74.62% in 2019, down 1.26% from
2018. This impacted the revenue per availabvle room to drop by $1.62
to $104.40.
Vehicle volumes on BC Ferries two routes to the mainland (Duke Point
to Tsawwassen and Departure Bay to Horseshoe Bay) dropped by
0.04% and passenger volumes dropped by 0.40%.
The Nanaimo Airport volumes in 2019 were up by 12.9% over 2018.
The Vancouver Island Conference Centre (VICC) delegate days dropped
by 31.3% in 2019 compared to 2018. VICC delegate days are in
line with historical performance after taking into consideration an
unusually large conference in 2018.
source : chemistry consulting , nanaimo airport , bc ferries , vicc
49 50Prepared for City of Nanaimo Economic Development
Amrit Manhas, Economic Development Officer
411 Dunsmuir Street, Nanaimo, BC V9R 5J6
250-755-4465 | www.investnanaimo.com
Design and Layout: Common FoundryYou can also read