Spatial Insights on Urban Density: A Case Study of Calgary - CEUR Workshop Proceedings
←
→
Page content transcription
If your browser does not render page correctly, please read the page content below
Spatial Knowledge and Information Canada, 2019, 7(3), 2

Spatial Insights on Urban Density:
A Case Study of Calgary
JIAAO GUO                                        VICTORIA FAST
Department of Geography                          Department of Geography
University of Calgary                            University of Calgary
jiaao.guo1@ucalgary.ca                           victoria.fast@ucalgary.ca

                                                 worsening sprawl and disincentivizing
ABSTRACT                                         urban densification, lowering connectivity
                                                 between communities, and rising overall
Calgary, the 3rd most populous city in           property tax to all Calgarians (Smith, 2018).
Canada by census subdivision (CSD) but has       On a policy note, this goes against Calgary’s
a low population density: 1501 inhabitants per   Municipal Development Plan (MDP) that
km2, compared to Montreal’s density of           calls for more compact and efficient use of
4662/km2,     Toronto’s     4334/km2,     and    land by encouraging the redevelopment of
Vancouver’s 5493/km2. This study compares        higher residential densities in the
the distribution of population densities in      established communities (City of Calgary,
sub-municipal levels between Calgary and         2017).
three other Canadian cities to reveal urban
development patterns associated with
“density”. This is achieved through 3D
density mapping using ArcGIS Pro, and
Mantel permutation test of density
distributions. As a result, compared to the
other Canadian cities, Calgary has a great
capacity to densify its current urban
structures to cope with future population
and economic growth. Instead of expanding
outwards, we recommend a high density-
urban form is what Calgary needs to grow
healthily.

1. Introduction
Fourteen new communities have been
proposed in the city of Calgary in order to
cope with the estimated population growth
of 76,000 people in the next 5 years (City of
Calgary, 2018). All these new communities
are on the outer periphery of the city,
encouraging     decentralized    low-density     Figure 1. Locations of proposed new
                                                 communities by the city council of Calgary.
development (Figure 1). Proponents believe
that new outer-city communities help the         Unlike other large cities in Canada such as
settlement of population, bringing down the      Toronto, Montreal, and Vancouver with
average housing price, and creating tens of      natural barriers (Lake Ontario, St. Lawrence
thousands of temporary and permanent jobs        River, and the Pacific Ocean, respectively)
(Thomas, 2018); others are vehemently            that constrain their sprawl process, Calgary
opposed to the new communities, citing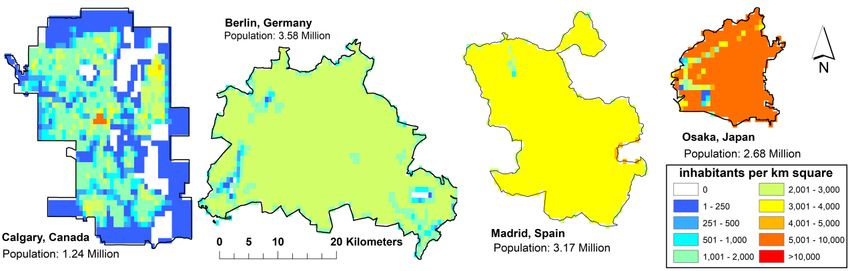
2   Insights on Urban Density

does not have physical barriers to limit            2018). Many European cities favour block-
outward growth. To contextualize this new           style urban form, while condominiums are
outward growth, it is important to                  the most popular accommodation type in
understand how Calgary’s footprint and              the megacities of Asia which enable
density compare to other cities. In this            significantly higher densities (Bunz et al.,
paper, we use GIS and spatial analysis to           2006). In a quick comparison, we use coarse
visualize and compare Calgary’s population          resolution (1×1 km) population grids
density in sub-municipal level and its              (NASA, 2018) to examine population
distribution to other cities in Canada              density of Calgary to Berlin (medium
(Montreal, Toronto, and Vancouver). We              density), Madrid (medium-high density),
then discuss these findings as they related to      and Osaka (high density). The three cities,
urban growth in Calgary.                            representing different density levels, exhibit
                                                    more evenly distributed pattern of
2. Background: Density                              population density compared to Calgary. In
Population density is the number of                 comparison, Calgary’s overall low density
inhabitants per unit area (km2). It has a           appears to have a disjointed assortment of
significant impact on an urban area: low-           density grids. Beyond density, the
population density is associated with the           distribution or the consistency of population
low      densities       of      infrastructures,   densities in sub-municipal level, can reveal
transportation system, and even services to         how well the mix-use form is implemented
be provided to the citizens (McFarlane,             as a city grows. To understand Calgary’s
2016). High-density is associated with the          population density further, we will compare
mixed-use urban form with significant               it with three other Canadian cities using
focuses on public transits, pedestrians, and        census records that have a finer spatial
cyclists (Burton, 1999). Compact and                resolution.
mixed-use urban forms have been suggested
by many studies to have positive influences         3. Method and Data
on the livability of the city; it prevents          We compare four census subdivisions
unrestrained urban sprawls and ensures the          (CSDs) in Canada: Toronto, Montreal, and
integral livability of the city (Burgess, 2002;
                                                    Calgary as the first to third largest CSDs in
Howley, 2009; Mouratidis, 2017). Optimal
                                                    Canada by population and Vancouver as
density for the urban form depends on local
                                                    Canada’s densest major city (Filipowicz,
context, and should overall contribute to the
                                                    2018). Their general statistics are listed in
health and sustainability of the city
                                                    Table 1. To reduce the effect of the
(Dempsey et al., 2012).
                                                    modifiable areal unit problem (MAUP)
When it comes to density, it is generally the
                                                    (Openshaw, 1984), dissemination block
case that Canadian cities have low urban
                                                    (DB), which represent the finest unit in the
population density compared with other
                                                    Canadian census record, are used. DB
cities in high-income countries (Filipowicz,
                                                    boundary files and attached census data for

Figure 2. The distribution of urban population densities between Calgary and other
international cities based on Gridded Population of the World (GPW) 2015. Grids have a
resolution of 1×1 km and the four cities are displayed on the same scale.
Insights on Urban Density 3
Canadian cities are extracted via Statistics new M values with the original M value. The
Canada (Statistics Canada, 2018a; Statistics p-value is calculated as follows:
Canada, 2018b). p-value = (1+n)/(1+N) (2)
Table 1: Area of selected CSDs and their where n is the number of randomized new
corresponding population densities. M values equal to or above (or equal to or
CSD Area Population Average below) the original, observed M value. A
(km2) (millions population Pearson’s correlation (ranges from -1 to 1)
in 2016) density can also be calculated based on unfolded
Calgary 826 1.24 1501/km2 matrices elements. We set 1,000 random
Montreal 366 1.7 4662/km2 permutations and a significance level (α) of
Toronto 630 2.73 4334/km2 0.05.
Vancouver 115 0.63 5493/km2 If similar population densities are evenly
spread out in their geographical locations,
the permutations of spatial matrices will not
We map 3-dimensional (3D) population give distinctly different M values. However,
densities with sub-municipal densities as if population densities distribute with some
“heights” using ArcGIS Pro. Next, we extract gradients from one place to another, the
DBs polygons into their centroid points to permutations of original distance matrices
statistically observe the distribution of will be likely to produce very different M
population density. We apply the simple statistics and result in low p-value.
Mantel test (Mantel, 1967) to assess the
“evenness” of density distributions of the
four cities. Simple Mantel test is a non-
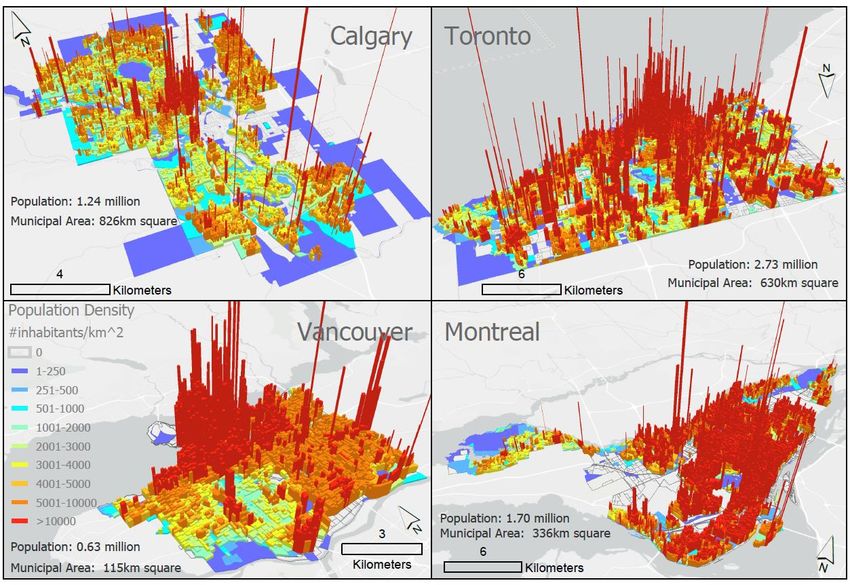
4. Result and Discussion
parametric test and routinely used to access The 3D population density of Calgary,
Montreal, Toronto, and Vancouver,
the significance of correlation between two
entire distance or dissimilarity matrices by illustrated in Figure 3, show that the
distribution of population in Calgary is very
random permutations (Guillot and Rousset,
2013). Accordingly, such permutation segmented and uneven compared to the
mechanism will result “pseudo” distances other three. Extremely low population
densities are found throughout the city and
between paired objects in matrices. Spatial
variations of population densities at DB especially near the municipal boundary of
Calgary. These pockets of no or low density
level can make significant differences in the
permutation process, and thus, reflect are not typical compared to the other cities.
“evenness” of density distribution. The R For Toronto, Montreal, and Vancouver,
there is a great portion of DBs with density
package “vegan” (Oksanen et al., 2013) is
used to conduct Mantel Test. It firstly over 5000 inhabitants/km2, and generally
constructs two matrices: dissimilarity in more consistent density throughout the city.
population densities, and spatial distances Results of Mantel test are shown in Table 2.
between centroids of density units. In our All the observed correlations are close to 0.
context, the null hypothesis (Ho) assumes This is caused by DBs that are
geographically far from each other but
population densities represented by
centroids of DBs are not linearly correlated having similar density value in the same
with their corresponding geographic CSD. Thus, we are more interested in the
distance. Then it calculates the sum-product simulated p-value as it reflects the
(M value) (Giraldo et al., 2018): “evenness” of population density’s
Table 2. Mantel test result at α = 0.05
∑ ∑ (1)
CSD r- p- Null
where cij is the ith element of column j in the
correlation value hypothesis
dissimilarity matrix C, and dij is the ith Calgary 0.0134 0.0134 reject
element in column j in the geographic
Montreal -0.0577 1.0 accept
distance matrix D. After the N times of
permutation of one matrix, it compares the Toronto -0.0283 1.0 accept
Vancouver -0.0056 0.8182 accept4 Insights on Urban Density distribution. At α=0.05, Calgary is the only inhabitants/km2 that is not commonly city with significantly strong spatial found in Calgary. To densify the city, gradients of population densities at DB Calgary has to not only redevelop and level. In other words, the local population densify established communities, but also densities in Calgary are extremely diverse encourage more mixed-use development and unbalanced. that balances the needs of residents, Admittedly, MAUP is still a factor causing commercial and industrial areas. uncertainties even at the DB level. For all A dense form of urban structure such as the 4 cities, there are DBs with population mix-use housing and block style density less than 250/km2. DB is adjusted communities is associated with (1) better when population counts are very low to connectivity and accessibility to different ensure confidentiality (Statistics Canada, services; (2) higher energy efficiency and 2015), while it does not necessarily have an utility transpiration (Güneralp et al., 2017); upper limit in counting. Further study is and (3) higher efficiency in operating public required to understand uncertainties their transit (Spencer et al., 2015). Instead of potential effects due to MAUP, as well as the constructing new communities on urban appropriate classification in different fringes, this can be achieved starting from density illustrations. redeveloping established communities in Uniquely, Calgary has a large number of Calgary, densifying their infrastructure DBs with no registered residents, and those layout, and diversifying their areas are mostly used for industrial or accommodation types. There is no statistical transportation (railways and airport) evidence that relatively high-density urban purposes. Montreal has a similar situation. forms will result in a decrease in quality of However, many of DBs with residents in life: Vancouver has a triple amount of Montreal have densities over 10,000 general population density compared with Figure 3. The 3D urban population densities by dissemination block (DB) for Calgary, Vancouver, Toronto and Montreal within their CSD boundaries in 2016.
Insights on Urban Density                                                                     5

Calgary, it is frequently ranked as one of the    The former Toronto’s chief planner,
cities with highest living quality (Filipowicz,   Jennifer Keesmaat suggests that Calgary has
2018).                                            the building blocks to be transformed,
In addition, a compact urban form                 adding that the East Village, one of the
potentially helps the municipality to             communities with the highest population
manage its revenue more effectively than          density in Calgary, is an ideal model (Smith,
the decentralized city. The real challenges       2019). The question remains, will Calgary
are to carry out “compact” urban structure:       keep growing out, or learn to grow up?
the city continues encouraging monocentric
urban structure with downtown-oriented
transit system makes it difficult to develop      Acknowledgements
mix-use area outside the city center (Arnott,
2015); while higher taxation in the city          We acknowledge Statistics Canada and
center may also drive business away               NASA’s     Socioeconomic      Data   and
resulting further decentralization (Song and      Applications Center (SEDAC) for providing
Zenou, 2009). With a densification process        the open data used in this study. We also
surrounding the city center, shared prices        thanks to University of Calgary for
for utilities, public transits, housing, and      providing ESRI software support.
average property tax can eventually be
brought down. Thus, this densification            References
process is beneficial to all Calgarians in the
long-term, and it should be implemented in
                                                  Arnott, R. (2015). Reflections on Calgary’s
a thoughtful way.
                                                         Spatial    Structure:    An     Urban
                                                         Economist’s Critique of Municipal
5. Conclusion                                            Planning in Calgary. The School of
                                                         Public Policy Publications, 8(35), 1-
Calgary has an anomalously segmented                     53.
population distribution, and its overall          Bunz, K. R., Henze, G. P., & Tiller, D. K.
density is too low to support a cost-efficient           (2006). Survey of sustainable
supply of services. Densification and                    building design practices in North
redevelopment of existing communities are                America, Europe, and Asia. Journal
recommended over the current model of                    of architectural engineering, 12(1),
expansion. Recognizing Calgary’s MDP and                 33-62.
transportation plan, we recommend the             Burton, E. (2000). The compact city: just or
future urban development in Calgary that:                just    compact?     A    preliminary
(1) stops expansions of new communities on               analysis. Urban        studies, 37(11),
the fringes of the city; and (2) supports the            1969-2006.
redevelopment of established areas by             Burgess, R. (2002). The compact city
encouraging construction of the mix of                   debate: A global perspective.
housing      types    and     transit-oriented           In Compact      cities (pp.    21-36).
development. In addition to these                        Routledge.
immediate       recommendations,        future    City of Calgary. (2017, August). Municipal
research needs to be done on defining                    Development       Plan.     Retrieved
“optimal” density, and how such density can              September      26,      2018,    from
be applied by other municipalities across                http://www.calgary.ca/PDA/pd/Doc
Canada. For Calgary, many of the new-                    uments/municipal-development-
planned communities will take decades to                 plan/mdp-municipal-development-
complete, and it is not too late for the city            plan.pdf
council to make amendment of Calgary’s            City of Calgary. (2018). Suburban
future urban form that will contribute to the            Residential Growth Report 2018-
overall health and connectivity of the city.             2022. Retrieved October 14, 2018,
6 Insights on Urban Density
from McFarlane, C. (2016). The geographies of
http://www.calgary.ca/PDA/pd/Pag urban density: Topology, politics
es/Planning-and-development- and the city. Progress in Human
resource-library/Publications.aspx Geography, 40(5), 629-648.
Dempsey, N., Brown, C., & Bramley, G. Mouratidis, K. (2017). Is compact city
(2012). The key to sustainable urban livable? The impact of compact
development in UK cities? The versus sprawled neighbourhoods on
influence of density on social neighbourhood satisfaction. Urban
sustainability. Progress in Studies, 0042098017729109.
Planning, 77(3), 89-141. Oksanen, J., Blanchet, F. G., Kindt, R.,
Filipowicz, J. (2018, January 9). Room to Legendre, P., Minchin, P. R., O’hara,
Grow: Comparing Urban Density in R. B., ... & Oksanen, M. J. (2013).
Canada and Abroad. Retrieved June Package ‘vegan’. Community ecology
25, 2018, from package, version, 2(9).
https://www.fraserinstitute.org/site Openshaw, S., & Institute of British
s/default/files/room-to-grow- Geographers. Study Group in
comparing-urban-density-in- Quantitative Methods. (1984). The
canada-and-abroad.pdf Modifiable areal unit
Giraldo, R., Caballero, W., & Camacho- problem (Concepts and techniques
Tamayo, J. (2018). Mantel test for in modern geography; no. 38).
spatial functional data. AStA Norwich, England: Geo.
Advances in Statistical Smith, M. (2018, August 3). Council
Analysis, 102(1), 21-39. approves 14 new neighbourhoods,
Guillot, G., & Rousset, F. (2013). but experts say plans will worsen
Dismantling the Mantel sprawl. Retrieved January 15, 2019,
tests. Methods in Ecology and from
Evolution, 4(4), 336-344. https://www.thestar.com/calgary/2
Güneralp, B., Zhou, Y., Ürge-Vorsatz, D., 018/08/03/experts-question-
Gupta, M., Yu, S., Patel, P. L., ... & calgary-city-council-decision-to-
Seto, K. C. (2017). Global scenarios approve-suburban-growth.html
of urban density and its impacts on Smith, M. (2019, January 9). What former
building energy use through Toronto chief planner Jennifer
2050. Proceedings of the National Keesmaat sees as the biggest
Academy of Sciences, 114(34), 8945- challenges facing Calgary. Retrieved
8950. January 12, 2019, from
Howley, P. (2009). Attitudes towards https://www.thestar.com/calgary/2
compact city living: Towards a 019/01/09/what-former-toronto-
greater understanding of residential chief-planner-jennifer-keesmaat-
behaviour. Land use policy, 26(3), sees-as-the-biggest-challenges-
792-798. facing-calgary.html
NASA. (2018). Gridded Population of the Song, Y., & Zenou, Y. (2009). How do
World (GPW), v4. Retrieved January differences in property taxes within
10, 2019, from cities affect urban sprawl?. Journal
http://beta.sedac.ciesin.columbia.ed of Regional Science, 49(5), 801-831.
u/data/set/gpw-v4-population- Spencer, A., Gill, J., & Schmahmann, L.
count/data-download (2015, December). Urban or
Mantel, N. (1967). The detection of disease suburban? Examining the density of
clustering and a generalized Australian cities in a global context.
regression approach. Cancer In Proceedings of the State of
research, 27(2 Part 1), 209-220. Australian Cities Conference, Gold
Coast, Australia (pp. 9-11).Insights on Urban Density 7
Statistics Canada. (2015, November 27). Highlight Tables, 2016 Census.
Dissemination block (DB). Retrieved Retrieved January 7, 2019, from
January 8, 2019, from https://www12.statcan.gc.ca/census
https://www12.statcan.gc.ca/census -recensement/2016/dp-pd/hlt-
-recensement/2011/ref/dict/geo014- fst/pd-
eng.cfm pl/Table.cfm?Lang=Eng&T=301&S=
Statistics Canada. (2018a, March 12). 2016 3&O=D
Census - Boundary files. Retrieved Thomas, M. (2018, August 11). Approval of
September 28, 2018, from 14 new communities a good thing.
https://www12.statcan.gc.ca/census Retrieved January 15, 2019, from
-recensement/2011/geo/bound- https://calgarysun.com/life/homes/
limit/bound-limit-2016-eng.cfm approval-of-14-new-communities-a-
Statistics Canada. (2018b, February 8). good-thing
Population and Dwelling CountYou can also read