An Investigation of Reliability on Remote Sensing and GIS Data as an Aid to Urban Development Plan: A Case Study on Bhopal - ITPI
←
→
Page content transcription
If your browser does not render page correctly, please read the page content below
Institute of Town Planners, India Journal 7 - 4, 90 - 100, October - December 2010

An Investigation of Reliability on Remote Sensing
and GIS Data as an Aid to Urban Development
Plan: A Case Study on Bhopal
Anshu Gupta, Dr. Jagdish Singh
Abstract
This study investigates the four criterias - namely scale of GIS map, remote sensing and
GIS integration, level of classification and accuracy of classification with respect to visual
assessment, for reliability of remote sensing and GIS in Urban Development Plan. The
study proposes a fusion of LISS IV and Cartosat - 1 for enhanced visual classification and
gives some suggestions for better land use map generation using remote sensing and GIS
data for Urban Development Plan, preparation.

1.      INTRODUCTION
Urban and rural developments are key to the growing economy of India. Proper
urban development is necessary to boost industry sector, to provide standard
urban livelihood, and to prevent urban extension, which generally envelops
nearby rural and sub-urban areas. Rural development, which concerns with land
and agriculture, is essential to boost agriculture based rural economy and to
provide basic amenities for rural livelihood because agriculture still employs
country’s major population. In order to prevent the capture of rural development
land from rapid urbanization, a well studied and sustainable urban development
is imminent. Urban development is carried out using urban development plan.
Proper urban development plan is the requirement of every growing city to
handle its growing demand of land, transportation facilities, to check urban
sprawl and for environmental management. This study has its focus on urban
development plan.

2.      URBAN DEVELOPMENT PLAN
Urban Development Plans (UDP), City Development Plans (CDP) and master plan
are all related to each other. The difference lies in plan formulating bodies and
focus. Urban Development Plan is generally revised every 10 years. This
requires a long term analysis and modelling such that the current development
should bear fruit in future. UrbanDevelopment Plan needs geographic information
of the area. The information consists of topography, land use, cadastral map,
soil type, transport networks, vegetation, water supply reach, flood hazard,
suitable for structures, residence, industry commerce, agriculture, ecological

Anshu Gupta, has done B. Arch.; MTech, and Specialisation in Remote Sensing & GIS, and is
Assistant Professor, Department of Architecture and Planning, Maulana Azad National Institute
of Technology, Bhopal.
Dr. Jagdish Singh, has done PhD. from Department of Architecture and Planning MANIT,
and is Associate Professor in Architecture and Planning MA National Institute of Technology
Bhopal.

     Anshu Gupta, Dr. Jagdish Singh                                                                      90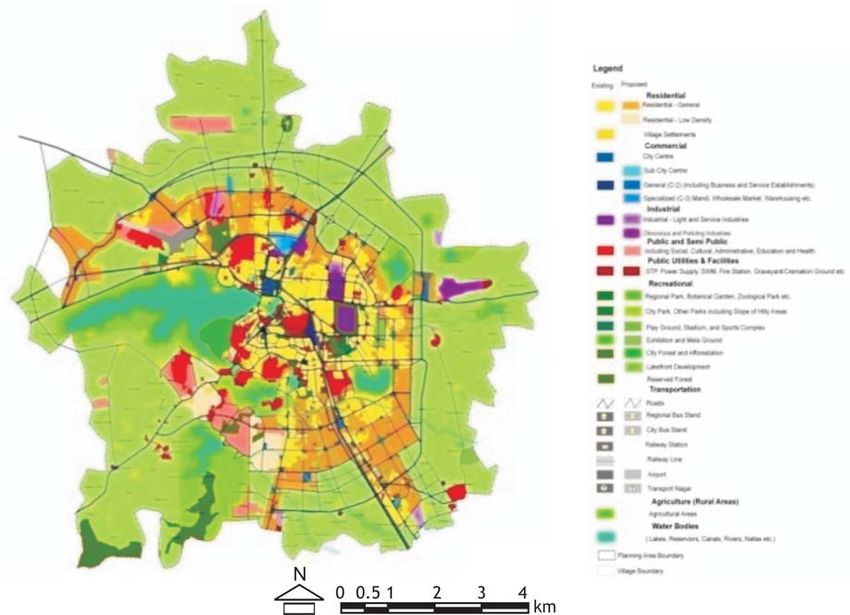
Institute of Town Planners, India Journal 7 - 4, 90 - 100, October - December 2010

             conservation and many more (NUIS, 2006; UDPFI, 1996) . These information
             consist of both spatial attributes and associated non-spatial attributes. It also
             constitutes a bulk of geographic information which should be properly stored,
             managed and analyzed for fruitful results. The best way to analyze them is
             with maps of various scales of information. Conventional methods utilize old
             topographic maps and have extensive survey requirements, which don’t
             incorporate changes in the growing city (Uttawar, 2001). In India too, traditional
             methods were employed requiring paper based Survey of India (SOI) maps and
             ground surveys, having drawback of viewing map at a fixed scale only. Today’s
             digital map have brought a relief such that map can be viewed at all scales
             above its preparation scale and resolution. More about scale and resolution will
             be discussed in subsequent chapters.

             2.1     Suitability of Remote Sensing and GIS in Urban Development Plans
             GIS offers map representation but it requires map preparation. Traditionally,
             maps are prepared using extensive land surveys. However, this method is
             expensive and time consuming due to dynamics of urban city. Further, developing
             country like India faces unplanned changes more than planned changes (Tiwari,
             2002). Remote sensing imagery offers a great relief by providing a detailed
             overview of the area. High spatial resolution remote sensing data has great
             potential for map creation after geo-referencing (Chidambaram, 2002). The
             details on the remotely sensed image helps in creation of land use map, urban
             sprawl map, transport network map, cadastral map, etc; hence, integration of
             remote sensing and GIS is critical in urban development plan (Mesey, 2008;
             Perera and Shantha, 1995).

             Remote Sensing image might seem helpful but before relying on it, its suitability
             analysis for urban development program (UDP) should be carried out. There
             are several crucial points which need to be studied for suitability analysis (Mesey,
             2008; Tiwari, 2002). The most important four points are as follows:

             •     Scale of GIS map generation;
             •     Remote sensing and GIS integration for example geometric correction, ortho
                   rectification, registration, etc;
             •     Level of Land use Land cover ( LULC ) Classification achievable with respect
                   to resolution of remote sensing data; and
             •     Accuracy of map generated from remote sensing.

             The reliability will be validated using the guidelines used for urban planning
             (NUIS, 2006; UDPFI, 1996).

             Maps for UDP of Bhopal for the year 2005 were created using Survey of India
             (SOI) topographic sheets and traditional survey. The proposed LU map of Bhopal

Anshu Gupta, Dr. Jagdish Singh                                                            91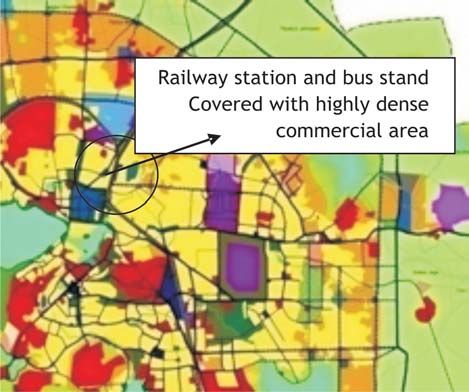
Institute of Town Planners, India Journal 7 - 4, 90 - 100, October - December 2010

UDP plan 2005 was verified using the LU map developed in the year 2005 by IRS
P6 LISS IV data, 2004. UDP of 2021 utilizes LU map prepared from remote
sensing data as mentioned above. UDP includes analysis of a lot of maps but
this study is focused on LU map mainly. Details will be discussed in the next
section. The Remote Sensing Satellite is now available with very high spatial
resolution such that even cars and individual buildings can be isolated. This has
increased its capability for visual classification for land use purposes. However,
even visual classification is restricted based on the spatial resolution. Level IV
LU classification map is used for Bhopal UDP 2021. The spatial resolution of
LISS IV image is 5.8m which is appropriate up to Level III classification and
1:10,000 scale of GIS map (Gupta & Jain, 2005). Thus, a better spatial resolution
map is required for correctly identifying Level IV classification.

2.2   Image Fusion
This study proposes a digital image processing technique which would modify
the image such that the LU map up to level IV classification (NUIS, 2006) with
better accuracy can be obtained. The specified technique is image fusion,
which enhances the spatial resolution of the image. The next paragraph gives a
brief introduction of trends and methods used to achieve image fusion.

With the advent of Remote Sensing, high spatial, spectral and temporal remote
sensing satellite images are nowadays acting as a good source of geospatial
information. One of the major thrust of digital image processing is on extraction
of various information from the high resolution imageries. Image fusion is one
of the techniques which aim to extract high spectral and spatial information
from two distinct images and coalesce them into single image. In order to
maintain signal to noise ratio in an image and the sensor design complexity, an
image with high spatial and high spectral properties cannot be produced (Zhang,
2004). Such types of images are used for better mapping, visual interpretation,
classification, change detection and many GIS based application. However, the
problem is to find out the appropriate method for image fusion which can be
used for LU map generation. In order to solve this problem, this work investigates
seven fusion techniques namely, Brovey transform, IHS (intensity hue saturation),
HPF (high pass filter), PCA transform (principle component analysis, UNB pan
sharpening, wavelet transform, multiplicative fusion, available in commercial
software. The assessment of effectiveness of the fusion techniques can be
compared. Quality assessment can be done by visual interpretation and the
quantity assessment can be done by measuring certain parameters like mean
bias, standard deviation, average gradient, correlation coefficient, Q4 quality
index information entropy and many more (Zhang, 2008). Image fusion can be
performed on two images of same sensor as well as of different sensors. The
initial parameters of two satellites while acquiring the images are different.

   Anshu Gupta, Dr. Jagdish Singh                                                                      92
Institute of Town Planners, India Journal 7 - 4, 90 - 100, October - December 2010

             This effect can be reduced little by using images of same sensor (Couloigner et.
             al., 1998) like the images acquired by IKONOS, SPOT and Quickbird. Further,
             level I LU classification (NUIS, 2006) is used to evaluate the effectiveness of
             the fused image.

             2.3     Study Objectives
             UDP has specific norms and guidelines to be followed and is explained in details
             in the study area section. Bhopal as study area has several specific topics to be
             discussed like administrative boundary, population dynamics, geography,
             topography, weather, wind direction and speed etc. The objectives behind this
             study are:

             •     To investigate the extent of reliability of GIS and remote sensing data for
                   LU map generation used in UDP with case study of Bhopal UDP, of year
                   2005 and 2021; and
             •     To propose a suitable fusion technique for enhancement of spatial resolution

             Quantitative and qualitative assessment of fused image: This work is based
             on analysis of urban master plan or UDP. The study area is selected as Bhopal
             due to urban development its history and familiarity of the place by author.
             The analysis includes base map preparation, reliability and validation. It also
             identifies the shortcomings of master plan of Bhopal, used as case study, and
             suggests a technology to improve the base map preparation specially land use
             and land cover maps.

             3.      THE RELIABILITY ON REMOTE SENSING AND GIS FOR MASTER PLAN
             The reliability of Remote Sensing (RS) and GIS can be validated by ensuring
             efficient RS and GIS integration, selecting appropriate spatial resolution of RS
             satellite data for map preparation, proper scale for GIS analysis, following the
             design standard in terms of required land use and land cover analysis, accuracy
             assessment of visually generated map. The scale of map to be used for a
             particular purpose in a project is determined as to what topographical features
             and what plan elements (details) are required to be shown with a certain
             degree of clarity on one or more sheets. Master Plan (CDP) maps are required
             to be prepared at larger scales, 1:20,000 or 1:10,000 (for Metros and large
             cities), and 1:5,000 for others (NUIS, 2006, UDPFI, 1996).

             4.      DESIGN STANDARDS
             Detailed design parameters for USIS have been evolved within NUIS framework.
             The spatial framework, to be adopted for the two different levels of USIS -
             Master Plan (1:10000) and Zonal Plan / Detailed Town Planning Schemes (1:2000)
             scales, is given in Table-1.

Anshu Gupta, Dr. Jagdish Singh                                                          93
Institute of Town Planners, India Journal 7 - 4, 90 - 100, October - December 2010
Table 1 Design Standards
Parameter (All Values at 3s) 1:10000 1:2000
A) Image Standards
Generic / Standard Resolution • 5M XS or better • 0.2m
IRS Image Resolution recommended • 5.8 multi spectral • 2.5 m (P+Mx)
• Aerial B/W
NSF State Local
Projection for Image output UTM UTM
Datum for image products WGS 84 WGS 84
Image Frames (geometrically corrected, 3’x3’ 36"x36"
important for seamlessness)
Image Position (Planimetric corrected, 5 0.5 (0.25mm
important for seamlessness) of scale)
Band-to-Band Registration for XS ~1.5 ~0.1
data (0.25 pixel) in m
Source: NUIS, 2006, DTCP, Government of India
Fig. 1 Land Use Government of Bhopal of year 2005
Source: Bhopal Development 2021 (Draft), Directorate of Town and Country Planning, M.P.
Anshu Gupta, Dr. Jagdish Singh 94Institute of Town Planners, India Journal 7 - 4, 90 - 100, October - December 2010
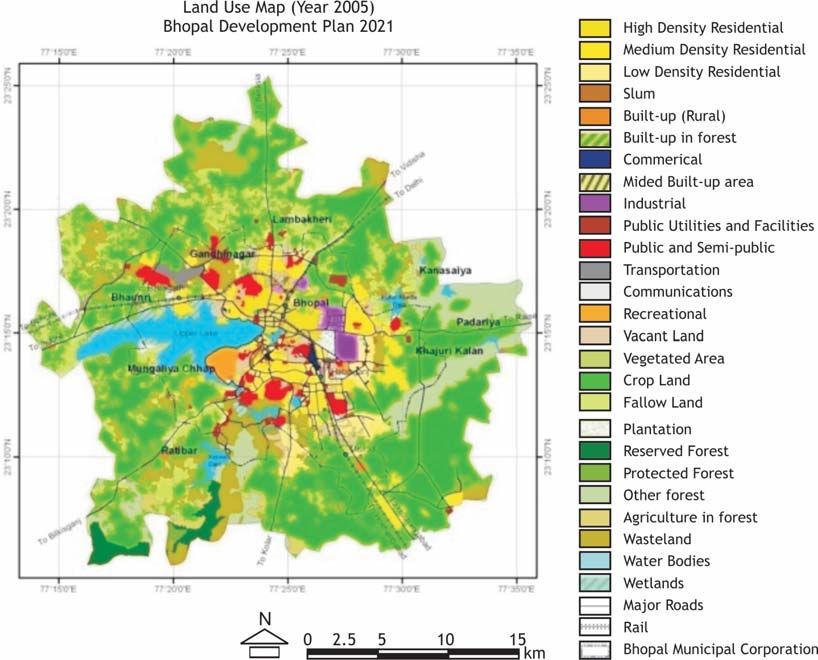
Fig. 2 Proposed Land Use Map of Bhopal-2021
Source: Bhopal Development 2021 (Draft), Directorate of Town & Country Planning, M.P.
The classification for proposed LU map for Bhopal master plan 2021 is of Level
IV which is shown in Fig. 1, while Fig. 2 shows the current LU map for the year
Level of classification of LU map is given in Table 2. The level of classification
for UDP is found out by the legend of the LU maps of year 2005 and 2021 as
shown in Fig 1 and 2. The classes and sub classes of the map depends on the
utility of that map.
5. INVESTIGATION OF SCALE OF MASTER PLAN / UDP (LU MAP)
The scale of map is found by measuring the distance on the map represented
as scale of the ground. As per the Indian norms (NUIS, 2006), the scale of the
master plan of metro and large cities should be 1:10,000. Bhopal being considered
under the large cities of India, the base map and LU map of UDP Bhopal is
created using IRS P6 LISS IV MS data which follows the norm. As per the legend
of master plan of year 2005 and 2021, the classification level IV is applied.
However, at this scale some details are omitted for example transportation
Anshu Gupta, Dr. Jagdish Singh 95Institute of Town Planners, India Journal 7 - 4, 90 - 100, October - December 2010
Table 2 Land Use Classification of LU Map 2021
Level I Level II Level III Level IV
Built up UrbanBuilt up Residential Residential-generalResidential low
densityVillage Settlement
Commercial City CentreGeneralMandi, whole sale market
etc
Industrial Light and service industryPolluted industry
Public and semi public STD, power supply, grave yard etc
Recreational Regional park, zoological parkCity
parkStadium, play ground, sport
complexLake frontMela ground
Transportation RoadsRegional bus standRailway
stationAirportTransport Nagar
Agriculture
Water body
area has been fixed with commercial area near bus stand and railway station as
shown below in Fig 3. It had been shown that Cartosat-1 itself is sufficient for
1:10,000 scale map (Radha et al., 2009). Hence, the major question is at
which all the maps are prepared. If scale is 1:10,000, then images have improper
resolution and if higher scale then NUIS and UDPFI guidelines are violated.
6. GIS AND REMOTE SENSING INTEGRATION
It constitutes of geometric correction and orthorectification of remote sensing
image and image geo-registration. The received data was already geometrically
corrected. Ortho rectification is not possible
because of the lack of stereo pair of remote Fig. 3 Class Transport Mixed
sensing data. Thus, it only refers to image geo- with Commercial Area
registration. Image registration can be relative
registration or absolute registration. In this
study, relative registration is used. The
panchromatic band of Cartosat-1 was already
geo-registered. So, it is treated as reference
image for LISS IV bands which are registered
with an accuracy of 0.2 pixel, which is below
the design standard of 0.5 pixel, NUIS, 2006.
Image geo registration is a critical step before
any map generation using remote sensing data.
A small error in registration might propagate
to large changes in overall area of land use.
Bhopal UDP does not mention about the
Anshu Gupta, Dr. Jagdish Singh 96Institute of Town Planners, India Journal 7 - 4, 90 - 100, October - December 2010
Table 3 Level of Classification of registration error in the UDP
Master Plan 2005 of Bhopal report. The proposed modification
Class Sub classes Level of of fusion follows the norms hence
classification can be utilized for LU map
(NUIS standards) generation.
Transportation - III
7. INVESTIGATION OF LEVEL
Commercial III
OF CLASSIFICATION AS
Recreational III PER NUIS NORMS
Forest Reserved forest II
In LU map of 2005, the legend of
Protective forest
LU map shows that up to level IV
Another forest
classification has been carried out
Water body I for class residential only. Rest of
Wet land I the classes and their classification
Agriculture Crop land II level has been given in Table 3.
Fallow land Yet few slum areas have been
Plantation identified but considering the scale
Waste land I of map, their proper boundary
Communication III delineation is crucial. Slums are
Vacant land III level V classification. Hence, it is
almost impossible to visualize the
Vegetated area III
boundary using LISS IV data set.
Public and III
The similar is the case with
semi public
residential which is further
Industrial III subdivided into high, medium and
Built up Built up rural II low density residential as level IV
Built up in forest classification. Apart from these
Mixed built up III classes, all the other classes are
Public Utility III at maximum up to level III
and facility classification which is possible to
Residential High density IV and level V identify using LISS IV data (Gupta
Medium density slums classification for & Jain, 2005).
Low density
Hence, the availability of high
spatial resolution remote sensing
data is always desirable because of its enhanced capability of boundary delineation
and object oriented classification (Blaschke, 2010). This arises a question that
why high resolution data set (for example, IKONOS data, available since 2000,
of spatial resolution 1m) or aerial photography have not been used for the
preparation of LU map of year 2005. Further, aerial photography which is
available for Bhopal of the year 2005 has not been utilized.
Anshu Gupta, Dr. Jagdish Singh 97Institute of Town Planners, India Journal 7 - 4, 90 - 100, October - December 2010
8. IMAGE FUSION TECHNIQUES
Three bands of multi spectral image were resampled to the radiometric
resolution of Cartosat-1. The two registered images, Pan and resampled MS,
underwent fusion by seven image fusion techniques using various image
processing software. Here, seven fusion algorithm are applied namely, Brovey
transform, intensity hue saturation (HIS), high pass filter (HPF), principle
component analysis (PCA), PCI Pan Sharpening, wavelet transform and
multiplicative fusion. Erdas Imagine 9.2 has been used for Brovey transform,
multiplicative, HIS, HPF, Wavelet Transform and PCA. PCI Geomatica 10.1 has
been used for PCI Pan sharpening. The fused image generated from the above
mentioned techniques were resampled using nearest neighbour technique.
9. ASSESSMENT OF FUSION TECHNIQUES
Assessment of fusion techniques is done by using three parameters namely,
mean bias, correlation coefficient and Q4 quality index. The fused image is
resampled to the spatial resolution of original multi spectral image using nearest
neighborhood as mentioned in Wald et. al.,(1997) for quality assessment. Analysis
and conclusions are drawn from the results of classification and the quality
indexes
10. CONCLUSIONS
This study has investigated four criteria for the suitability of Bhopal urban
development plan. The scale of the map was not explicitly mentioned. However,
this scale is not appropriate for detailed level V classification. Since accuracy of
registration is not mentioned in Bhopal UDP, it is assumed that they would have
followed the norms.
In order to generate a better Land Use map, a high spatial resolution remote
sensing data is required. Aerial photography can generate map of scale up to
1:5,000. However, scale of 1:10,000 is suitable for Bhopal UDP which can be
generated using only Cartosat 1 data (Radhadevi et. al, 2009). This study
proposed a fusion of Cartosat 1 and LISS IV MS which has enhanced spatial
resolution of 2.5m as well as good spectral resolution to provide the necessary
contrast for class boundary delineation.
The major problem of identifying the appropriate fusion technique of remote
sensing data for land use mapping purposes has been tried to solve. In order to
solve this problem, this work have incorporated seven fusion techniques and
quantitatively evaluated their performance with respect to each other. It followed
a logical framework of accuracy assessment at each lower step before moving
into next higher step. Seven fusion techniques are applied followed by their
Anshu Gupta, Dr. Jagdish Singh 98Institute of Town Planners, India Journal 7 - 4, 90 - 100, October - December 2010
quantitative assessment. Due to low spectral resolution of Cartosat-1 image,
bad classification results are obtained and due to low spatial resolution of MS
LISS IV image, some of the classes are not well classified. This prompted for
image fusion.
Commercially available image processing software (ERDAS, IDRISI and PCI
Geomatica) are used for image fusion namely, HPF, IHS, PCA, Wavelet, Brovey,
Multiplicative and PCI Pan sharpening. Wavelet transform fusion technique is
ranked the best based on quantitative assessment followed by Brovey and PCI
Pan sharpening fusion techniques. Rest of the fusion techniques were unable to
provide a satisfactory performance based on quantitative assessment.
Taking above aspects into consideration, the specifie recommendations drawns
for Bhopal are:
• Maps of Scale of 1:10,000 should be generated for Bhopal UDP using the
images generated from one of the finally concluded fusion technique, or
aerial photography or other high resolution like Cartosat 2 or IKONOS or
Quickbird. Up to Level III classification, map of scale 1:10,000 is suitable;
• For higher level of classification, a map with scale larger that 1:10,000
should be used. If possible, latest remote sensing data set should be used
for generation of existing LU map for example the draft of Bhopal UDP
2021 released in September 2009 utilises existing LU map of year 2005; and
• Fusion technique should be tried out, if possible with images of same sensor
for their better performance in geo-registration. This should minimise the
error in GIS and remote sensing integration.
REFERENCES
Blaschke,T. 2010, Object based image analysis for remote sensing, ISPRS Journal of
Photogrammetry and RemoteSensing Vol 65, No 1, pg 2-16
Couloigner, I., Ranchin, T., Valtonen, V.P., and Wald, L,1998, Benefit of the future SPOT -
5 and of data fusion to urban roads mapping, International Journal of Remote Sensing,
19(8), pg 1519-1532.
Chidambaram, M., 2010. Scientific GIS Digital Base Maps - Urban Planning using GIS/RS
Technologies. Available online at: http://www.gisdevelopment.net/ application/urban/
overview/Scientific-GIS-Digital-Base-Maps-Urban-Planning-using-GIS-RS-Technologies.htm.
Gupta K. , Jain S., 2005, Enhanced Capabilities of IRS P6 LISS IV sensor for urban mapping,
Current Science Vol. 89, No. 11.
Mesey, V., 2008. Integration of Remote Sensing and GIS. Book Publisher: Wiley & Sons,
ISBN: 978-0-470-86409-8.
National Urban Information System (NUIS): Design and Standards, Town & Country Planning
Organization, 2006
Anshu Gupta, Dr. Jagdish Singh 99Institute of Town Planners, India Journal 7 - 4, 90 - 100, October - December 2010
Perera, S. C. and Shantha, K. D. P., 1995. Integration of Remote Sensing Data With GIS
Technology for the Acceleration of the Activities in National Mapping Agencies. Available
online at: http://www.gisdevelopment.net/aars/acrs/1995/ps3/ps3002.asp.
Radhadevi P. V., Solanki S. S., Jyothi M. V., Varadan Geeta, 2009. Automated Co registration
of Images from multiple bands of LISS 4 Camera, ISPRS Journal of Photogrammetry and
Remote Sensing Vol 64, issue 1, pg 17-26.
Tiwari D. P., 2002. Remote Sensing and G.I.S. for efficient Urban Planning, proceedings,
Map Asia 2003..
Uttarwar, P.S., 2001., Applications of GIS and Remote Sensing in urban planning,
implementation and monitoring of urban projects - Case study of Rohini and Dwarka project,
New Delhi. Available Online at: http://www.gisdevelopment.net/-application/urban/
overview/urbano001htm
Urban Development Planning Formulation and Infrastructure (UDPFI Guidelines), 1996,
authored by: Ministry of Urban Affairs and Employment, Govt. of India, New Delhi.
Wald, L., Ranchin, T. and Mangolini, M., 1997, Fusion of Satellite Images of Different
spatial resolutions: assessing the quality of resulting Images, Photogrammetric Engineering
and Remote Sensing, 63(6), pg. 691-699
Zhang, Y., 2004, Understanding image fusion, Photogrammetry Engineering and Remote
Sensing, 70(6), pg. 653–760
Zhang Yun, 2008, Methods for image fusion quality assessment-A Review, comparison and
analysis, The International Archieve of the Photogrammetry, Remote Sensing and Spatial
Information Science Vol. XXXVII. Part B7, Beijing.
ITPI PUBLICATIONS
Reader Volumes (Rs. 100/- each)
Advanced Transportation Planning
City and Metropolitan Planning and Design
Development Management
Ecology and Resource Development
Environmental Impact Assessment
Environmental Planning and Design
History of Human Settlements
Housing
Land Economics
Network and Services
Planning Legislation and Professional Practice
Planning Techniques
Planning Theory
Project Formulation and Appraisal
Regional Planning and Development (Part -I)
Social Formation and Changes
Statistics and Population Studies
Transportation Planning
Village Planning and Rural Development
Anshu Gupta, Dr. Jagdish Singh 100You can also read