A deep learning method for classification of chest X-ray images - IOPscience
←
→
Page content transcription
If your browser does not render page correctly, please read the page content below
Journal of Physics: Conference Series

PAPER • OPEN ACCESS

A deep learning method for classification of chest X-ray images
To cite this article: Jiashi Zhao et al 2021 J. Phys.: Conf. Ser. 1848 012030

View the article online for updates and enhancements.

 This content was downloaded from IP address 46.4.80.155 on 24/05/2021 at 13:41

ICAACE 2021 IOP Publishing
Journal of Physics: Conference Series 1848 (2021) 012030 doi:10.1088/1742-6596/1848/1/012030

A deep learning method for classification of chest X-ray
images

 Jiashi Zhao1, Mengmeng Li1, Weili Shi1, Yu Miao1*, Zhengang Jiang1*, Bai Ji2
 1
 Computer Science and Technology, Changchun University of Science and
 Technology, Changchun, Jilin, 130000, China
 2
 Hepatobiliary and Pancreatic Surgery, The First Hospital of Jilin University,
 Changchun, Jilin, 130000, China
 *
 Yu Miao’s e-mail: miaoyu@cust.edu.cn
 *
 Zhengang Jiang’s e-mail: jiangzhengang@cust.edu.cn

 Abstract. Deep learning techniques have provided new research methods for computer-aided
 diagnosis, allowing researchers to use deep learning methods to process medical imaging data.
 Chest X-ray examinations are widely used as a primary screening method for chest diseases.
 Therefore, it is of great importance to study diagnosis of 14 common pathologies in chest X-ray
 images using deep learning methods. In this paper, we propose a deep learning model named
 AM_DenseNet for chest X-ray image classification. The model adopts a dense connection
 network and adds an attention module after each dense block to optimize the model's ability to
 extract features, and finally a Focal Loss function is applied to solve the data imbalance problem.
 The experiments used chest X-ray images as model input and were trained to output the
 probabilities of 14 chest pathologies. The Area under the ROC curve (AUC) was used to
 measure the classification results, and the final average AUC was 0.8537. The experimental
 results show that the AM_DenseNet model could complete the pathology classification of the
 chest X-ray images effectively.

1. Introduction
Thorax diseases have severely threatened the health of human beings. Among them, the pneumonia
alone affects approximately 450 million people (i.e., 7% of the world population) and results in about 4
million deaths per year[1]. As we all know, Chest radiography is often used as a screening tool at the
onset of disease, because it is low-radiation, low-cost, widely available, and fast, making it an excellent
tool for initial screening of chest diseases. However, in medically underdeveloped areas, there are still
few radiologists who can identify chest diseases accurately. Especially in rural areas, the lack of
specialized physicians results in many treatable diseases going undetected, which leads to increased
mortality from chest diseases. Therefore, research on computer-aided diagnosis of chest diseases can
enable early diagnosis and treatment of patients, which can effectively prevent the progression of chest
diseases.
 Since 2006, deep learning has emerged and developed rapidly as a branch of machine learning.
However, different from natural images, medical images are not easy to obtain, have few relevant
datasets, and have high image similarity, making it difficult to train using deep learning. Therefore, the
acquisition of medical image data is very important for the promotion of deep learning in medical image
processing. At first, only the Open-i, founded by the National Library of Medicine, was available for

 Content from this work may be used under the terms of the Creative Commons Attribution 3.0 licence. Any further distribution
 of this work must maintain attribution to the author(s) and the title of the work, journal citation and DOI.
Published under licence by IOP Publishing Ltd 1
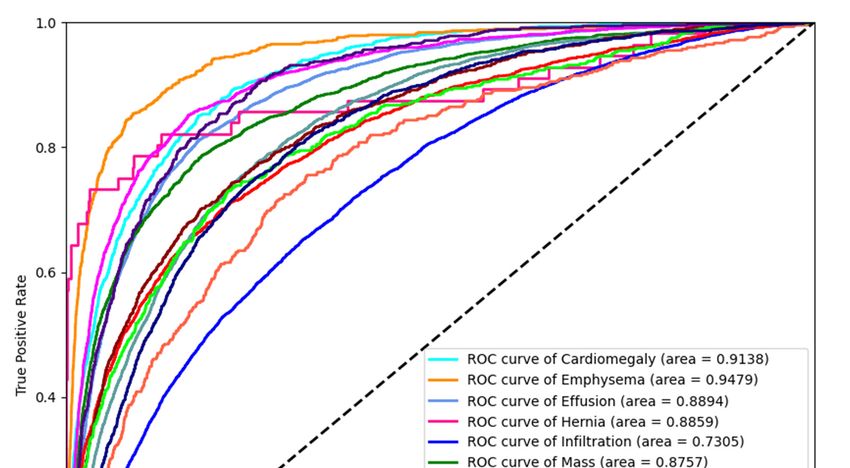
ICAACE 2021 IOP Publishing
Journal of Physics: Conference Series 1848 (2021) 012030 doi:10.1088/1742-6596/1848/1/012030

the study of chest X-ray images, which contained only 7470 chest X-ray images[2]. However, due to the
many and complex thoracic diseases, it cannot meet the needs of deep learning research. In 2017, the
National Institutes of Health (NIH) released the first large chest X-ray dataset with more than 100,000
anonymous chest X-ray images and their corresponding data[3]. The dataset contains 112,120 frontal
view chest X-ray images of 14 types of common chest pathologies, and contains the patient's age, gender,
view position and other information. Afterwards, the Stanford team and MIT released two large datasets,
CheXpert and MIMIC-CXR [4][5]. CheXpert contains 224,316 chest X-ray images and has pathology
reports written by radiologists for each chest radiograph. And MIMIC-CXR contains 371920 labeled
chest radiographs.
 The publication of the large chest dataset has spurred research on the classification of chest-related
diseases. Reference [3] presented a unified weakly-supervised multi-label image classification model.
The authors used pre-trained AlexNet, GoogleNet, VGGNet-16 and ResNet-50, then removed the fully
connected layer and the final classification layer, and added a transition layer, a global pooling layer, a
prediction layer and a loss layer in the end. Reference[6] proposed a model named ChestNet which
consists of a classification branch and an attention branch. Reference [7] proposed a model based on
location aware Dense Networks (DNetLoc), whereby it incorporates both high-resolution image data
and spatial information for abnormality classification.
 However, there are still some difficulties in multi-classification studies of chest pathology. Thorax
X-ray images are highly similar to each other and detailed features are not easily distinguished. Besides,
different categories of data are severely imbalanced, resulting in unsatisfactory classification. In this
paper, we propose a dense network model based on attention mechanism to make the model training
more efficient and use Focal loss function to optimize the class imbalance problem. We validated the
effectiveness of our model using the Chest X-ray 14 dataset and achieved good results.

2. Proposed model
In this paper, a deep convolutional neural network model named AM_DenseNet is proposed for multi-
label classification of 14 thoracic diseases. The AM_DenseNet model structure is shown in Figure 1(a),
this model uses DenseNet-121[8] as the backbone network and adds the Convolutional Block Attention
Module (CBAM) after the first three Dense Blocks to form three Blocks, Block structure is shown in
Figure 1(b). At the end of the model, a fully connected layer is used to transform the trained feature
vector into a 14-dimensional output vector. This vector is used to represent the probability of disease
for 14 thoracic diseases, where full 0 denotes "No Finding". Besides, to solve the problem that there are
many types of thoracic diseases and the number of labels for each type of diseases is very unbalanced,
the Focal Loss function is used in this paper to improve the problem of class imbalance.

 Figure 1 The AM_DenseNet Model structure.

 2
ICAACE 2021 IOP Publishing
Journal of Physics: Conference Series 1848 (2021) 012030 doi:10.1088/1742-6596/1848/1/012030

2.1. DenseNet-121
The paper adopts DenseNet-121 as the backbone network. DenseNet introduces the concept of dense
convolutional network, which directly interconnects all layers. For any layer, the feature maps of all
previous layers are used as input, while its own feature map is used as input for all subsequent layers.
With this dense connection, the model retains the features of all previous layers well and does not need
to learn redundant features, making the model perform better.
 DenseNet-121 consists of four dense blocks, each dense block consists of a specified number of
convolutional layers, and each convolutional layer contains Batch Normalization (BN), ReLU activation
function and convolutional for feature extraction. After the first three dense blocks, a transition layer is
added, which consists of BN,1*1 convolutional layer and 2*2 average pooling layer. The transition layer
is used to connect two dense blocks, change the channel dimension, and downsample. At the end of the
model is the classification layer, and the output is obtained by global average pooling, fully connected
layer and softmax activation function.
 The total number of convolutional and fully connected layers in DenseNet-121 is 121. Compared
with ResNet, DenseNet has a smaller number of parameters because it does not need to learn redundant
features. By setting up dense connections, the model can reuse features to obtain a larger information
flow, and the regularization operation can alleviate the problem of gradient disappearance. References
[8] states that the DenseNet network performs significantly better than other networks in most tasks.

2.2. Attention Mechanism
The attention mechanism allows the deep convolutional neural network model to focus adaptively on
relevant regions of the image and is a practical way to improve the effectiveness of the model. SENet[9],
published by Jie Hu et al. in 2017, subjected the feature maps in the CNN to two operations, squeezing
and excitation. And it improves the quality of the feature maps by explicitly establishing the
interdependencies between the channels of the images. In addition, the model allows the network to
perform feature recalibration, and through this mechanism, the network can learn to use global
information, selectively emphasize features that are useful for model training and suppress less useful
features. However, SENet only implements an attention mechanism on feature channels, and Sanghyun
Woo et al. published CBAM[10] in 2018 successfully, CBAM implemented a hybrid attention mechanism
on channels and spaces. The structure of the CBAM attention mechanism is shown in Figure 1(c), which
consists of a channel attention module and a spatial attention module. Given an intermediate feature
map, the CBAM module sequentially deduces the attention map along two independent dimensions—
channel and space, and then multiplies the attention map with the input feature map to perform adaptive
feature optimization. It is verified experimentally that the CBAM module can improve the classification
and detection performance on different models without adding too much computation, which is better
than SENet attention mechanism that only focuses on the channel.
 In the thoracic X-ray image lesion classification task, multiple lung diseases need to be distinguished,
so lung regions provide more useful features for disease classification, while other regions provide only
a few useful features. By adding a CBAM attention module to the DenseNet-121 network model, the
training of the deep neural network is focused on disease-relevant regions, adaptively assigning more
weight to the learned features in the relevant regions, thereby increasing the model's ability to extract
major features that are truly useful. The classification model is passed through Dense Block Layer and
Transition Layer to obtain the feature map of the image. The feature map is first passed through Channel
attention module (CAM) which performs global maximum pooling and global average pooling on the
feature map to obtain F and F , respectively. And then, Fcavg and Fcmax obtain two sets of
features by forwarded to a shared network MLP (multi-layer perceptron), and these two sets of features
are summed by elements and passed through the sigmoid activation function to obtain channel attention
feature map. The CAM process is shown in equation (1).
Mc F σ MLP AvgPool F MLP MaxPool F σ W 1 W0 F W1 W0 F (1)

 3
ICAACE 2021 IOP Publishing
Journal of Physics: Conference Series 1848 (2021) 012030 doi:10.1088/1742-6596/1848/1/012030

where σ is the sigmoid function, W ∈ ℝ ,W ∈ℝ , r denotes the reduction ratio. The
resulting feature map is multiplied with the input features as input to the Spatial Attention Module
(SAM). The SAM first does global max pooling and global average pooling on the features, and does
concat on the channel, then uses a convolution operation to obtain the features with 1 channel. Finally,
the spatial attention feature is generated by sigmoid function. And the spatial feature is multiplied by
the SAM input to get a final feature map to be used as input for the next Block. The SAM process is
shown in equation (2).
 Ms F σ 7*7 AvgPool F ; MaxPool F σ 7*7[F ; F ] (2)
 7*7
where σ is the sigmoid function, and represents the convolution with kernel size 7*7.

2.3. Loss Function
In the problem of multi-classification of 14 diseases of chest X-ray, a single image may contain more
than one disease, so the problem is essentially a multi-label classification problem. The calculation of
multi-label classification loss can be translated into a binary class loss on each label. A common
approach is to use the sigmoid activation function at the output level, then for each output value, use the
binary cross entropy (BCE) loss function to find the loss of this class, and finally average all the loss
values. The BCE loss expression for the multi-label classification problem is shown in equation (3).
 LBCE ∑ log ’ 1 log 1 ’ (3)
where m denotes the class number, y represents the sample label of dimension m, and y' represents the
predicted output of dimension m. The essence of cross-entropy is to find the distance between the sample
label and the predicted value. The optimal model parameters are obtained by training the model to make
the loss as small as possible.
 However, in the chest X-ray datasets, the number of normal samples is much larger than the number
of diseased samples, and there are many types of chest diseases, so it is difficult to achieve the ideal
training results using BCE loss. On this basis, an improved algorithm for BCE loss, named Focal loss[11],
was proposed, which introduces a weighting factor α, the value of which is between 0 and 1. And when
the label is 1, the weight is α. When the label is 0, the weight is 1-α. By using the weighting factor,
increasing the penalty for non-diseased samples, and balancing the contribution of positive and negative
 γ
samples in the loss function. At the same time, the modulation factor 1 ′ , γ>0 is introduced. The
smaller the difference between the prediction result and the label, the easier it is to distinguish this
sample, the smaller the value of the modulation factor. The larger the difference between the prediction
result and the label, the less easy it is to distinguish this sample, the larger the value of the modulation
factor. So that, making the training more focused on the hard-to-distinguish samples. Focal loss
expression is shown in equation (4).
 γ
 LFL α 1 ′ log ′ 1 α ′γ log 1 ′ (4)

3. Dataset
Using large publicly available dataset ChestX-ray14 [3] to study the classification of chest diseases. The
dataset contains 112,120 frontal CXRs from 30,805 unique patients. The size of each image is
1024*1024 and images are saved in PNG format. The authors used NLP to uncover 14 common chest
pathologies from radiological reports, including Atelectasis, Consolidation, Infiltration, Pneumothorax,
Edema, Emphysema, Fibrosis, Effusion, Pneumonia, Pleural_Thickening, Cardiomegaly, Nodule, Mass,
and Hernia. The accuracy of the mining labels was greater than 90%. The authors provided pathology
labels for all images, and 0 or more pathologies may appear in a single image.
 Besides, the disease information was converted into a 14-dimensional vector of disease labels, where
‘0’ indicates the absence of the disease and ‘1’ indicates the presence of the disease. Then, a
preprocessing operation was performed on the images, using nearest neighbor interpolation to scale the
images to the specified size, which in this experiment was 512*512 pixels in width and height. Finally,

 4
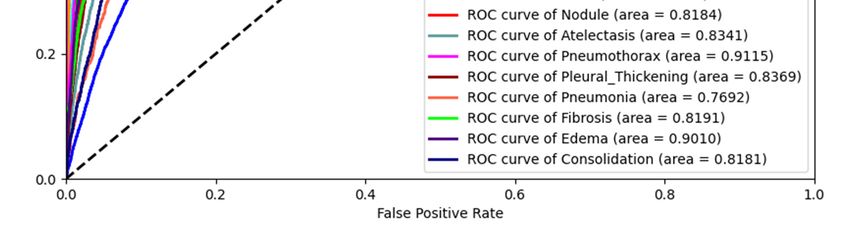
ICAACE 2021 IOP Publishing
Journal of Physics: Conference Series 1848 (2021) 012030 doi:10.1088/1742-6596/1848/1/012030

the pixels were normalized to between 0 and 1 by dividing by the maximum grayscale value. The
preprocessed images were randomly divided into a training set and a test set, with 70% of the training
set and 30% of the test set.

4. Experiment and results
This experiment uses the pytorch framework to implement the AM_DenseNet network model and runs
on a deep learning machine with a 32GB graphics card. The training parameters are as follows: the batch
size is 8, the initial learning rate is 0.0001, the learning rate decays by 0.1 when the loss is stagnant, the
epoch is 20, and the training stops when the training loss is no longer decreasing. The model is initialized
with DenseNet-121 pre-trained on the ImageNet dataset and optimized using the Adam optimization
algorithm.
 We evaluate the classification performance of the AM_DenseNet network model for 14 chest
diseases using the Receiver Operating Characteristic (ROC) curve and the Area under the ROC curve
(AUC) score. The average AUC value of the AM_DenseNet model is used to measure the overall
performance of the model in the multi-classification task. Figure 2 shows the experimental results of the
AM_DenseNet model. The results showed that seven categories achieved AUC values greater than 0.85,
Emphysema had the highest AUC value of 0.9479, while Infiltration had an AUC value of only 0.7305,
and the mean AUC was 0.8537.

 Figure 2 The ROC curves of the diagnoses generated by AM_DenseNet on all 14 thorax
 diseases.

 We compared our experimental results with those of other deep learning methods, and the data for
the comparison experiments were obtained from published papers. The results show that our
experiments outperform the other three experiments in 7 categories of pathologies and have the highest

 5
ICAACE 2021 IOP Publishing
Journal of Physics: Conference Series 1848 (2021) 012030 doi:10.1088/1742-6596/1848/1/012030

average AUC values, and the AUC value of Hernia is slightly lower than ChestNet. It is verified that
the AM_DenseNet model can effectively handle the multi-classification problem of chest pathology.

 Table 1 The AUC of 4 methods of ChestX-ray.
 pathologies Chest x-ray 14 ChestNet DNetLoc Ours
 Cardiomegaly 0.8100 0.8748 0.826 0.9138
 Emphysema 0.8330 0.8222 0.911 0.9479
 Effusion 0.7585 0.8114 0.885 0.8894
 Hernia 0.8717 0.8996 0.716 0.8859
 Infiltration 0.6614 0.6772 0.854 0.7305
 Mass 0.6933 0.7833 0.774 0.8757
 Nodule 0.6687 0.6975 0.765 0.8184
 Atelectasis 0.7003 0.7433 0.872 0.8341
 Pneumothorax 0.7993 0.8098 0.806 0.9115
 Pleural_Thickening 0.6835 0.7513 0.892 0.8369
 Pneumonia 0.6580 0.6959 0.925 0.7692
 Fibrosis 0.7859 0.8041 0.820 0.8191
 Edema 0.8052 0.8327 0.785 0.9010
 Consolidation 0.7032 0.7256 0.941 0.8181
 Avg ROC AUC 0.7451 0.7806 0.841 0.8537

 To further investigate the contribution of each method in the AM_DenseNet model, the ablation
experiments were performed in this paper. The DenseNet model was used to perform multi-
classification experiments on Chest X-ray 14 datasets. Table 2 shows the comparison of experimental
results using the DenseNet model and the AM_DenseNet model, respectively. The comparison results
show that the improved AM_DenseNet model is much better than the original model, with an average
AUC increase of 4.15% and an increase of more than 5% in four pathologies, including Nodule by
10.67%, Hernia by 6.03%, Pleural_Thickening by 5.27%, and Mass by 5.25%. The experimental results
show that more features useful for disease classification can be obtained using the CBAM attention
mechanism, and the performance of the model can be effectively improved, especially in pathologies
such as Nodule.
 Subsequently, this paper investigates the role of Focal loss on AM_DenseNet model enhancement
by training the model with Focal loss, and BCE loss, respectively. The experimental results are shown
in Table 3. The experimental results showed that the mean AUC using Focal loss was elevated by 2.38%
over the BCE loss function, and 11 pathologies had AUC values higher than the BCE loss, including
Nodule elevated by 13.08%, Emphysema by 4.03%, and Pleural_Thickening by 3.73%.

 Table 2 Comparison of DenseNet and Table 3 Comparison of experimental results
 AM_DenseNet experimental results (AUC values) for different loss functions (AUC values)
 pathologies DenseNet AM_DenseNet pathologies BCE loss focal loss
 Cardiomegaly 0.9007 0.9138 Cardiomegaly 0.8868 0.9138
 Emphysema 0.9006 0.9479 Emphysema 0.9076 0.9479
 Effusion 0.8794 0.8894 Effusion 0.8897 0.8894
 Hernia 0.8256 0.8859 Hernia 0.7551 0.8859
 Infiltration 0.6978 0.7305 Infiltration 0.7272 0.7305
 Mass 0.8232 0.8757 Mass 0.8623 0.8757
 Nodule 0.7117 0.8184 Nodule 0.8083 0.8184
 Atelectasis 0.8006 0.8341 Atelectasis 0.8364 0.8341
 Pneumothorax 0.8671 0.9115 Pneumothorax 0.8913 0.9115
 Pleural_Thickening 0.7842 0.8369 Pleural_Thickening 0.7996 0.8369
 Pneumonia 0.7334 0.7692 Pneumonia 0.7750 0.7692

 6
ICAACE 2021 IOP Publishing
Journal of Physics: Conference Series 1848 (2021) 012030 doi:10.1088/1742-6596/1848/1/012030

 Fibrosis 0.7719 0.8191 Fibrosis 0.7887 0.8191
 Edema 0.8860 0.9010 Edema 0.8850 0.9010
 Consolidation 0.7884 0.8181 Consolidation 0.8048 0.8181
 Avg ROC AUC 0.8122 0.8537 Avg ROC AUC 0.8298 0.8537

5. Conclusion
In this paper, we proposed a multi-classification model AM_DenseNet combining attention mechanism
for chest x-ray images and validated the model effectiveness using the large-scale public dataset Chest
X-rays 14. Experimentally, the average AUC value of the AM_DenseNet model is 0.8537, which
exceeds the performance of other experiments. In addition, an ablation experiment was performed to
evaluate the value of the attention mechanism and the Focal Loss function in the model. Although the
AM_DenseNet model cannot replace the radiologist's diagnosis for some reasons, it can provide a
reference of great value to physicians. In future work, we will try to incorporate more information for
computer-aided diagnosis to further improve the model results.

Acknowledgment
This work is supported by the Science & Technology Development Program of Jilin Province, China
(No.20200401078GX).

References
[1] Ruuskanen, O., Lahti, E., Jennings, L. C., et al. (2011) Viral pneumonia. Lancet, 377(9773):1264-
 1275.
[2] NLM, 2017. Open-i: An open access biomedical search engine. https://openi.nlm.nih.gov.
[3] Wang, X., Peng, Y., Lu, L., et al. (2017) ChestX-ray8: Hospital-scale Chest X-ray Database and
 Benchmarks on Weakly-Supervised Classification and Localization of Common Thorax
 Diseases. In: The IEEE Conference on Computer Vision and Pattern Recognition (CVPR).
 Hawaii. pp. 3462-3471.
[4] Irvin, J., Rajpurkar, P., Ko, M., et al. (2019) CheXpert: A Large Chest Radiograph Dataset with
 Uncertainty Labels and Expert Comparison. In: The Thirty-Third AAAI Conference on
 Artifcial Intelligence (AAAI-19). Hawaii. pp. 590-597.
[5] Johnson, A. E. W., Pollard, T. J., Greenbaum, N. R., et al. (2019) Mimic-cxr: a large publicly
 available database of labeled chest radiographs. In: The IEEE Conference on Computer Vision
 and Pattern Recognition (CVPR). Los Angeles. pp. 1562-1568.
[6] Wang, H., Xia, Y. (2018) ChestNet: A Deep Neural Network for Classification of Thoracic
 Diseases on Chest Radiography. arXiv preprint, arXiv:1807.03058, 2018 - arxiv.org.
[7] Gündel, S., Grbic, S., Georgescu, B., Liu, S., Maier, A., Comaniciu, D. (2019) Learning to
 Recognize Abnormalities in Chest X-Rays with Location-Aware Dense Networks. In:
 Iberoamerican Congress on Pattern Recognition (CIARP). Madrid. pp. 757-765.
[8] Huang, G., Liu, Z., Laurens, V. D. M., Weinberger, K. Q. (2016) Densely Connected
 Convolutional Networks. In: The IEEE Conference on Computer Vision and Pattern
 Recognition (CVPR). Las Vegas. pp. 4700–4708.
[9] Hu, J., Shen, L., Sun, G., Albanie, S. (2018) Squeeze-and-excitation networks. In: The IEEE
 Conference on Computer Vision and Pattern Recognition (CVPR). Salt Lake City. pp. 7132-
 7141.
[10] Woo, S., Park, J., Lee, JY., Kweon IS. (2018) CBAM: Convolutional Block Attention Module.
 In: The European Conference on Computer Vision (ECCV). Munich. pp. 3-19.
[11] Lin, T. Y. , Goyal, P. , Girshick, R. , He, K. , & Dollár, Piotr. (2017) Focal Loss for Dense Object
 Detection. In: IEEE International Conference on Computer Vision (ICCV). Venice. pp. 2999-
 3007

 7
You can also read