Deep Metric Learning Network using Proxies for Chromosome Classification in Karyotyping Test
←
→
Page content transcription
If your browser does not render page correctly, please read the page content below
Proceedings of Machine Learning Research – Under Review:1–9, 2020     Full Paper – MIDL 2020 submission

          Deep Metric Learning Network using Proxies for
          Chromosome Classification in Karyotyping Test

Author(s) names withheld                                                        email(s) withheld
Address withheld

Editors: Under Review for MIDL 2020

                                               Abstract
     In karyotyping, the classification of chromosomes is a tedious, complicated, and time-
     consuming process. It requires extremely careful analysis of chromosomes by well-trained
     cytogeneticists. To assist cytogeneticists in karyotyping, we introduce Proxy-ResNeXt-
     CBAM which is a metric learning based network using proxies with a convolutional block
     attention module (CBAM) designed for chromosome classification. RexNeXt-50 is used
     as a backbone network. To apply metric learning, the fully connected linear layer of the
     backbone network (ResNeXt-50) is removed and is replaced with CBAM. The similarity
     between embeddings, which are the outputs of the metric learning network, and proxies
     are measured for network training.
         Proxy-ResNeXt-CBAM is validated on a public chromosome image dataset, and it
     achieves an accuracy of 95.86%, a precision of 95.87%, a recall of 95.9%, and an F-1 score
     of 95.79%. Proxy-ResNeXt-CBAM which is the metric learning network using proxies
     outperforms the baseline networks. In addition, the results of our embedding analysis
     demonstrate the effectiveness of using proxies in metric learning for optimizing deep convo-
     lutional neural networks. As the embedding analysis results show, Proxy-ResNeXt-CBAM
     obtains a 94.78% Recall@1 in image retrieval, and the embeddings of each chromosome are
     well clustered according to their similarity.
     Keywords: Karyotyping test, Karyotype, Chromosome, Metric learning, Proxy, Deep
     learning

1. Introduction
In the field of cytogenetics, karyotyping is one of the most reliable tests for detecting genetic
abnormalities (e.g. Down syndrome, Edwards syndrome, Turner syndrome and Chronic
myelogenous leukemia). Karyotyping is performed on individual human chromosome images
obtained during the metaphase stage of cell division. As shown in Figure 1, a healthy
human cell consists of 22 pairs of autosomes and a single pair of sex chromosomes (X and
Y), totaling 23 pairs of chromosomes. Cytogeneticists have individually segmented a total
of 46 chromosomes of healthy humans, thoroughly examined, and classified them as one of
the 24 chromosome types (1, ..., 22, X, Y).
    The manual analysis of each and every chromosome for diagnosis purposes takes a
considerable amount of time and is highly dependent on expert knowledge. In the recent past
years, artificial intelligence researchers have focused on automating the karyotyping process
to assist doctors and reduce their work load. Researchers proposed and used various machine
learning and deep learning techniques for automating the karyotyping process and obtained

c 2020 A.n. withheld.
Short Title
Figure 1: Chromosome images
encouraging results. Most studies used deeply stacked convolutional neural networks for
chromosome classification (Hu et al., 2019; Zhang et al., 2018; Sharma et al., 2018b,a, 2017)
and some studies employed feature based deep learning methods (Qin et al., 2019; Jindal
et al., 2017).
Metric learning is used to convert objects to corresponding embeddings. The main
advantage of metric learning is that it can exploit the semantic similarity of objects to
regularize a network. In embedding space, objects from the same class are more closer
than objects from different classes. In the fields of image retrieval and face verification, the
majority of current state-of-the-art (SOTA) approaches are based on metric learning (Omkar
M. Parkhi and Zisserman; Zhai et al.). The success of metric learning in these fields is
dependent on its ability to understand the similarity of objects.
The main contributions of this paper are as follows. First, we use proxy based metric
learning for the chromosome classification task. Second, we introduce a new network for
metric learning named Proxy-ResNeXt-CBAM, which has a convolutional block attention
module (CBAM). The classification performance of our network is higher than that of
conventional deep convolutional neural networks. Finally, we apply image retrieval and
image clustering to validate the embedding of chromosomes.
2. Methods
Networks: ResNeXt (Xie et al., 2017) is simple and highly modularized deep convolu-
tional neural network. ResNeXt consists of a repeating convolutional building block that
aggregates feature information. ResNeXt has a multi-branch architecture with only a few
hyper-parameters. we use ResNeXt-50 as a backbone network, which is one variation of
ResNeXt.
In metric learning, convolutional features of objects are converted into N-dimensional
embeddings. Embeddings represent objects from the same class, which are closer in distance
than objects from different classes. When modifying a general classification network to
2Short Title
Table 1: Description of networks.
Network RexNeXt Proxy-ResNeXt Proxy-ResNeXt-CBAM
conv1 7×7, 64, stride 2
3×3,
max pool, stride
2
1×1, 128
conv2 3×3, 128, C=32 ×3
1×1, 256
1×1, 256
conv3 3×3, 256, C=32 ×4
Backbone
1×1, 512
1×1, 512
conv4 3×3, 512, C=32 ×6
1×1, 1024
1×1, 1024
conv5 3×3, 1024, C=32 ×3
1×1, 2048
CBAM
global average pool + global max pool
global average pool
global average pool (concat)
Layer Normalization Layer Normalization
1000-d fc Normalization Normalization
output size 1×c 2048×c 2048×c
C = grouped convolutions, c = the number of classes
convert images into embeddings, its fully connected (FC) linear layer, which is the last
layer of the network, is removed. Therefore, the output vector size of the network changes
from 1×c to N×c (c is the number of classes).
To obtain adaptive embedding vectors, we employ a convolutional block attention mod-
ule (CBAM)(Woo et al., 2018). CBAM is proved as an effective but simple attention
module for deep convolutional neural networks. Since CBAM is a lightweight and gen-
eral module, it can be seamlessly integrated into metric learning based networks. For our
metric learning-based network Proxy-ResNeXt-CBAM, CBAM is attached to the backbone
network (ResNeXt-50) which performs feature map extraction. CBAM sequentially infers
two separate attention maps. To adaptivly refine attention maps, both attention maps are
multiplied to a input feature map.
A proxy (Movshovitz-Attias et al., 2017) is a representative embedding of objects and
employed for comparing similarities. We used a cosine similarity based distance metric to
calculate losses for optimizing Proxy-ResNeXt-CBAM. Proxies of each class (1, 2, 3, ..., X,
Y) are the same size as the embeddings of objects and trained with the network parameters.
Various networks designed for chromosome classification are summarized in Table 1.
ResNeXt is the original network. Proxy-ResNext is a metric learning network that employs
proxies. Proxy-ResNext-CBAM is Proxy-ResNeXt with the attached CBAM. Cross-entropy
loss is used when training ResNeXt, and normalized softmax loss, which is described in the
next section, is used to train metric learning based networks. The details of each network
are provided in Table 1.
3Short Title
Normalized Softmax Loss: When generating embeddings using deep neural networks
(DNNs), quantifying the similarity and dissimilarity of objects makes it difficult to optimize
networks. Since DNNs use only a mini-batch of objects at each iteration, it is difficult to
sample a set of pairs or triplets of objects for optimally generating embeddings. So a set of
pairs or triplets of objects has to be sampled from the mini-batch. The object pair sampling
method (similar or dissimilar data points) and the object triplet sampling method (Wu
et al., 2017; Schroff et al., 2015) are the most commonly used. Contrastive loss (Chopra
et al., 2005) and triplet loss (Hoffer and Ailon, 2015) were proposed for the pair and triplet
sampling methods, respectively.
A sampling strategy of selecting informative pairs or triplets of objects is necessary
for effectively optimizing models and improving convergence rates. We employed the class
balanced sampling strategy which is commonly used in image retrieval tasks (Zhai et al.).
This strategy involves including multiple objects per class when constructing the training
mini batch. For each training batch, classes are selected and objects in each class are chosen.
The normalized softmax loss which is the partially modified conventional loss can be
applied in the class balanced sampling strategy. The normalized softmax loss can be used for
proxy-based metric learning when the class weight is represented as a proxy and a distance
metric can be used as the cosine similarity distance function. We used the same notations
as in (Zhai et al.). x denotes the embedding of an input image with the class label y. The
normalized softmax loss can be expressed with the weight of class py among all possible
classes in set Z:
!
exp xT py
Lnorm = − log P T
(1)
z∈Z exp (x pz )
3. Experiments
3.1. Dataset
We utilized the publicly available Bioimage Chromosome Classification dataset (Poletti
et al., 2008). This dataset contains a total of 5,256 images of chromosomes of healthy pa-
tients, which were manually segmented and labeled by expert cytogeneticists. As done in
the baseline methods, we divided the 5,256 images into training (4,176), validation (360),
and test (720) sets. In our experiments, the resolution of chromosome images in grayscale
is 50 × 50, which is enlarged to the desired resolution of 256 × 256.
3.2. Experiment Settings
Experimental setups: In this section, we evaluate the performance of chromosome
classification networks using different experimental setups which are summarized in Table 2.
We used a Pytorch deep learning framework in our experiments. The output embedding
of size N was set to 2048 and output embeddings were compared with the proxies of each
class. All the networks were trained using the SGD optimizer with an initial learning rate
4Short Title
of 1e-3, a momentum of 0.9 and an L2 penalty weight-decay of 1e-4. We used a simple
learning rate scheduler called ReduceLRonPlateau which is used to reduce the learning rate
by a constant factor when the loss on the validation set plateaus. ReduceLRonPlateau was
set to a factor of 0.1 for every 10 patients. The best network parameters on the validation
set is saved at each epoch and used for testing.
Table 2: Experimental setups
Experiment Metric Learning Loss Backbone
CBAM
Name with Proxy Type Network
ResNeXt X Cross-entropy X
Proxy-ResNeXt O Normalized softmax X ResNeXt-50
Proxy-ResNeXt-CBAM O Normalized softmax O
Before feeding an individual chromosome image as input to networks, a) Random Crop,
b) Random Horizontal Flip, and c) Random Vertical Flip were applied during the training
phase to augment data. Padded images (256 × 256) were randomly cropped to the size of
224 × 224. In the testing phase, images were randomly cropped to 224 × 224 without any
flip augmentation. The TorchVision package was used for this task.
3.3. Results
Chromosome classification performance We measured and compared the performance
of Proxy-ResNeXt-CBAM with that of the baseline classification networks on the Bioimage
Chromosome Classification dataset. Accuracy, Precision, Recall, and F-1 score were used as
evaluation metrics to measure the classification performance of the networks in our experi-
mental setups. The authors who proposed the baseline classification networks reported only
the Accuracy results and not the Precision, Recall or F1 score results in their manuscript;
therefore, only the Accuracy results of the baseline networks are listed in Table 3.
For a fair performance comparison, we randomly generated 100 different datasets and
measured performance on each dataset (performance of the baseline networks on a single
dataset was measured). The average performance of metric learning based networks using
proxies and that of the baseline networks are shown in Table 3.
Table 3: Classification performance of various networks
Method Accuracy Precision Recall F-1 score
Deep CNN (Sharma et al., 2018a,b) 87.50 N/A N/A N/A
ResNet-50 (Sharma et al., 2018a,b) 87.64 N/A N/A N/A
Res-CRANN (Sharma et al., 2018a) 90.42 N/A N/A N/A
Super-Xception (Sharma et al., 2018b) 92.36 N/A N/A N/A
ResNeXt 90.22±4.52 89.93±2.68 88.91±2.39 88.28±2.24
Proxy-ResNeXt 95.30±1.29 95.29±1.74 95.03±1.05 95.02±1.41
Proxy-ResNeXt-CBAM 95.86±0.62 95.87±0.61 95.90±0.73 95.79±0.65
5Short Title
We compare the performance of ResNeXt that do not use metric learning, proxies, or
CBAM with baseline classification networks. Generally, ResNeXt achieves better perfor-
mance than conventional ready-made CNNs (e.g. Deep CNN and ResNet-50 (Sharma et al.,
2018a,b)), and obtains performance comparable to that of CNNs with modified architec-
tures (e.g. Res-CRANN (Sharma et al., 2018a) and Super-Xception (Sharma et al., 2018b)).
However, the high standard deviation values of accuracy, precision, recall and F-1 score of
ResNeXt can be attributed to the inconsistent performance of RexNeXt in chromosome
classification.
We compared the performance of ResNeXt with that of metric learning networks trained
with proxies (Proxy-ResNeXt and Proxy-ResNeXt-CBAM). The chromosome classification
performance of Proxy-ResNeXt sharply increased. Proxy-ResNeXt, the simple metric learn-
ing based network, achieves an accuracy of 95.3±1.29, a precision of 95.29±1.74, a recall of
95.03±1.05, and an F-1 score of 95.02±1.41. The overall performance of Proxy-ResNeXt is
better than that of ResNeXt, and the standard deviations of the accuracy, precision, recall,
and F-1 scores of Proxy-ResNeXt are lower than those of ResNeXt. The drastic improve-
ment in performance of Proxy-ResNeXt can be attributed to metric learning. Additionally,
the performance of the metric learning based network with CBAM (Proxy-ResNeXt-CBAM)
also improved. All the performance metric scores slightly increased as their standard devi-
ations decreased. CBAM which is attached to the last part of Proxy-ResNeXt effectively
uses adaptive feature refinement to consistently train the network.
Embedding analysis Metric learning is used to train networks to generate consistent ob-
ject embeddings. During the training phase, the object from the same class are mapped
closer to each other than objects from different classes. Therefore, embeddings can be
utilized to compute the similarity between objects. The distances between embeddings con-
verted from objects can be compared, which makes it possible to apply metric learning to
tasks beyond image classification, such as image retrieval and image clustering. In this sec-
tion, Proxy-ResNeXt and Proxy-ResNeXt-CBAM are applied in image retrieval and image
clustering tasks to determine whether they can effectively generate object embeddings.
Table 4: Image retrieval performance of Proxy-ResNeXt and Proxy-ResNeXt-CBAM
Method Recall@1 Recall@2 Recall@4 Recall@8
Proxy-ResNext 94.61±1.35 96.22±0.75 97.11±0.3 97.98±0.08
Proxy-ResNext-CBAM 94.78±0.46 96.44±0.4 97.36±0.48 97.81±0.23
Recall@K is used to quantitatively measure the image retrieval performance of Proxy-
ResNeXt and Proxy-ResNeXt-CBAM. Recall@K is the ratio of relevant objects found in the
top-K retrievals. Each object is converted to a corresponding embedding. Cosine similarity
is used to retrieve the top K objects, excluding the query object itself, from the test set.
Table 4 shows the image retrieval performance of Proxy-ResNeXt and Proxy-ResNeXt-
CBAM in terms of recall at 1, 2, 4 and 8. As demonstrated by their Recall@1 scores, both
Proxy-ResNeXt and Proxy-ResNeXt-CBAM are effective in retrieving objects similar to the
query object. The Recall@8 score of Proxy-ResNeXt and Proxy-ResNeXt-CBAM increased
to about 98%. Proxy-ResNeXt-CBAM obtains better performance than Proxy-ResNeXt,
which shows that CBAM can help a network more effectively generate embeddings.
6Short Title
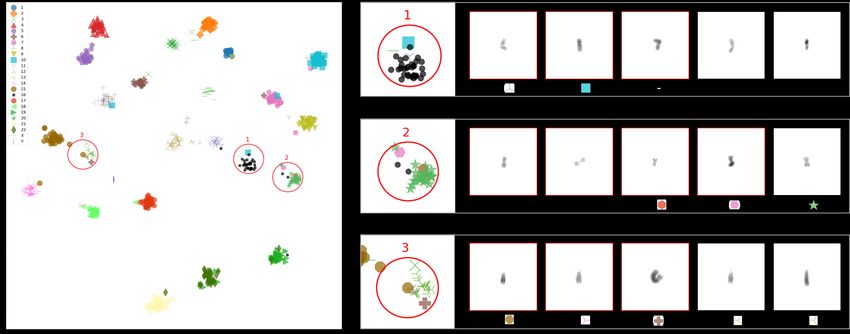
Figure 2: Image clustering
For the qualitative analysis, we clustered embeddings to better visualize embeddings.
The t-SNE (t-distributed stochastic neighbor embedding) (Maaten and Hinton, 2008) method
which converts similarities of data points into joint probabilities was used to reduce the di-
mension of embeddings from 2048 to 2. Figure 2 illustrates all the data points that represent
embeddings of chromosomes, which are generated by Proxy-ResNeXt-CBAM. Almost all
data points from each class are accurately clustered. Three areas that contain some mis-
clustered data points are circled in red in the left sub-figure of Figure 2. In the right
sub-figure of Figure 2, images of mis-clustered data points are highlighted in red boxes
and images of the well-clustered data points are highlighted in black boxes. Most of the
images of the mis-clustered data points circled in red are generally in lower resolution than
the images of the well-clustered data points. Since chromosomes of different classes have
unique band patterns, the band patterns of chromosomes are crucial in classifying chromo-
somes. But the band patterns of the mis-clustered chromosomes are not clear due to the
lower resolution. The lengths of the mis-clustered chromosomes are shorter than that of
the well-clustered chromosomes from the original class. In addition, distorted chromosome
images degraded the clustring performance of Proxy-ResNeXt-CBAM.
4. Conclusion
To assist cytogeneticists with karyotyping and help them more efficiently classify chromo-
somes, we proposed Proxy-ResNeXt-CBAM which is a metric learning network that has
an attached CBAM and uses proxies in chromosome classification. Proxy-ResNeXt-CBAM
outperforms conventional classification deep learning networks. Also, we conducted an em-
bedding analysis to demonstrate the effectiveness of using proxies. The embedding analysis
results shows that using proxies improves the performance of deep convolutional neural
networks in distinguishing embeddings of chromosomes of each class.
7Short Title
References
Sumit Chopra, Raia Hadsell, Yann LeCun, et al. Learning a similarity metric discrimina-
tively, with application to face verification. In CVPR (1), pages 539–546, 2005.
Elad Hoffer and Nir Ailon. Deep metric learning using triplet network. In International
Workshop on Similarity-Based Pattern Recognition, pages 84–92. Springer, 2015.
Xi Hu, Wenling Yi, Ling Jiang, Sijia Wu, Yan Zhang, Jianqiang Du, Tianyou Ma, Tong
Wang, and Xiaoming Wu. Classification of metaphase chromosomes using deep convolu-
tional neural network. Journal of Computational Biology, 26(5):473–484, 2019.
Swati Jindal, Gaurav Gupta, Mohit Yadav, Monika Sharma, and Lovekesh Vig. Siamese
networks for chromosome classification. In Proceedings of the IEEE International Con-
ference on Computer Vision, pages 72–81, 2017.
Laurens van der Maaten and Geoffrey Hinton. Visualizing data using t-sne. Journal of
machine learning research, 9(Nov):2579–2605, 2008.
Yair Movshovitz-Attias, Alexander Toshev, Thomas K Leung, Sergey Ioffe, and Saurabh
Singh. No fuss distance metric learning using proxies. In Proceedings of the IEEE Inter-
national Conference on Computer Vision, pages 360–368, 2017.
Andrea Vedaldi Omkar M. Parkhi and Andrew Zisserman. Deep face recognition.
Enea Poletti, Enrico Grisan, and Alfredo Ruggeri. Automatic classification of chromosomes
in q-band images. In 2008 30th Annual International Conference of the IEEE Engineering
in Medicine and Biology Society, pages 1911–1914. IEEE, 2008.
Yulei Qin, Juan Wen, Hao Zheng, Xiaolin Huang, Jie Yang, Ning Song, Yue-Min Zhu,
Lingqian Wu, and Guang-Zhong Yang. Varifocal-net: A chromosome classification ap-
proach using deep convolutional networks. IEEE transactions on medical imaging, 38
(11):2569–2581, 2019.
Florian Schroff, Dmitry Kalenichenko, and James Philbin. Facenet: A unified embedding
for face recognition and clustering. In Proceedings of the IEEE conference on computer
vision and pattern recognition, pages 815–823, 2015.
Monika Sharma, Oindrila Saha, Anand Sriraman, Ramya Hebbalaguppe, Lovekesh Vig, and
Shirish Karande. Crowdsourcing for chromosome segmentation and deep classification.
In Proceedings of the IEEE Conference on Computer Vision and Pattern Recognition
Workshops, pages 34–41, 2017.
Monika Sharma, Lovekesh Vig, et al. Automatic chromosome classification using deep
attention based sequence learning of chromosome bands. In 2018 International Joint
Conference on Neural Networks (IJCNN), pages 1–8. IEEE, 2018a.
Monika Sharma, Lovekesh Vig, et al. Automatic classification of low-resolution chromosomal
images. In Proceedings of the European Conference on Computer Vision (ECCV), pages
0–0, 2018b.
8Short Title
Sanghyun Woo, Jongchan Park, Joon-Young Lee, and In So Kweon. Cbam: Convolutional
block attention module. In Proceedings of the European Conference on Computer Vision
(ECCV), pages 3–19, 2018.
Chao-Yuan Wu, R Manmatha, Alexander J Smola, and Philipp Krahenbuhl. Sampling
matters in deep embedding learning. In Proceedings of the IEEE International Conference
on Computer Vision, pages 2840–2848, 2017.
Saining Xie, Ross Girshick, Piotr Dollár, Zhuowen Tu, and Kaiming He. Aggregated residual
transformations for deep neural networks. In Proceedings of the IEEE conference on
computer vision and pattern recognition, pages 1492–1500, 2017.
Andrew Zhai, Hao-Yu Wu, and US San Francisco. Classification is a strong baseline for
deep metric learning.
Wenbo Zhang, Sifan Song, Tianming Bai, Yanxin Zhao, Fei Ma, Jionglong Su, and Limin Yu.
Chromosome classification with convolutional neural network based deep learning. In 2018
11th International Congress on Image and Signal Processing, BioMedical Engineering and
Informatics (CISP-BMEI), pages 1–5. IEEE, 2018.
9You can also read