Win With An All-Rounder - ITI Multi Cap Fund An open ended equity scheme investing across - ITI Mutual Fund
←
→
Page content transcription
If your browser does not render page correctly, please read the page content below
Win With An
 All-Rounder
    ITI Multi Cap Fund
(An open ended equity scheme investing across
  Large Cap, Mid Cap and Small Cap stocks)

                                                1
Why Equity as an Asset Class ?

                                 2
Why equity?

                          •   Grow with the company
Ownership in Business     •   Periodic Income via dividends

                          •   Listed on Exchanges
Liquidity &Transparency   •   Highly transparent

                          •   Capital Appreciation
WealthCreation            •   Diversify Risk across sectors
                          •   Excellent returns across long run

                          •   Participate in India growth story
EconomicLinkages          •   Helps in beating Inflation

                                                                  3
Returns over long term

 A comparisonacrossAssetClasses

                                                                                                             GoldCAGR
                                                                                             10.42
                                                                                               %
                                                                                                                7.4
                    NiftyCAGR                         22.95
                                                        %
                                                                                                                 %     PSU Bank 3YearAverageFD
                                                                           ASSET                                       Rate
                                                                          CLASSES                      8.0
                                                                                                        %             NSCAverageRate
                                                                                            7.3
                                                                                             %        Post Office 3YearAverage FDRate
                                                                     8.1%
                           PPFAverageRate

Source : for NSC, PPF and Post Office Rates - http://www.nsiindia.gov.in/ . PSU Bank FD Rates – PSU Bank Website Gold Prices are LBMA AM Fixed and Nifty data -
Bloomberg
interest Rates taken as simple annual average from 2008 till 2021 and returns are in CAGR for the same period (2008 – 2021) Past Performance may or may not be
sustainable in future. Investments in mutual funds should not be construed as a guarantee of any minimum returns. There is no capital protection guarantee or
assurance of any return. Kindly consult your financial advisor before investing.

                                                                                                                                                              4
Equities vs Debt over time
Equities have outperformed Fixed Income over Long Periods of Time
1,200
Equity v/s Debt over last 15years
1031
1,000
800
600
400
100 324 200
-
Jun-04
Jun-05
Jun-06
Jun-07
Jun-08
Jun-09
Jun-10
Jun-11
Jun-12
Jun-13
Jun-14
Jun-15
Jun-16
Jun-17
Jun-18
Jun-19
Jun-20
Jun-21
Dec-
Dec-
Dec-
Dec-
Dec-
Dec-
Dec-
Dec-
Dec-
Dec-
Dec-
Dec-
Dec-
Dec-
Dec-
Dec-
Dec-
04
05
06
07
08
09
10
11
12
13
14
15
16
17
18
19
20
Nifty 50TRI CCIL All Sov BondTRI
Data Source – Niftyindices.com for Nifty 50 TRI and ccilindia.com for CCILAll Soverign Bond Index TRI
Data Period Apr 2004 to June 2021. The Graph shows how Rs 100 invested on 1-jan-2004 in both these indices have grown as on 30-June-2021 Past Performance
may or may not be sustainable in future. Investments in mutual funds should not be construed as a guarantee of any minimum returns. There is no capital protection
guarantee or assurance of any return. Kindly consult your financial advisor before investing.
5
Time in themarketis moreimportant
                  than timing the market
                                                             NSE 500Index                                                 Nifty 50Index
                                          Rolling Rolling Rolling Rolling Rolling                       Rolling Rolling Rolling Rolling Rolling
                                          1Y          3Y         5Y          7Y          10Y            1Y         3Y          5Y           7Y          10Y
  Min Ret%                                  -60.3% -21.9% -1.8%                   4.0%     4.7%          -56.3% -14.7% -1.0%                     5.1%     4.9%
  Max Ret%                                 134.2% 65.7% 51.9% 33.9% 24.6%                               107.4% 58.0% 45.8% 30.4% 22.0%
  Avg Ret%                                   17.9% 16.6% 16.8% 15.9% 14.7%                                16.2% 15.3% 15.6% 15.1% 14.2%

  Total Instances                             5098       4608       4112        3620       2873             5098       4608       4112       3620        2873
  Instances of -veReturns                     1245         408          46           0           0          1309         295            5          0           0
  Probability of -veReturns                    24%          9%          1%         0%          0%            26%          6%         0%           0%          0%
The longer the time horizon, greater the probability of creating wealth.
Above data analysis is for the period Jan 2020 to June 2021 to depict a trend of instances for these benchmarks for different time periods of 1Y, 3Y, 5Y, 7Y
and 10Y
Data Source – Niftyindices.com. Data Period Jan 2000 to June 2021. Returns above 1Y are CAGR. Past Performance may or may not be sustainable in future. Investments
in mutual funds should not be construed as a guarantee of any minimum returns. There is no capital protection guarantee or assurance of any return. Kindly consult your
financial advisor before investing.

                                                                                                                                                                          6
Difference between Volatility and Risk

                 VOLATILITY                                                                RISK

Sharp movement in stock prices in the near term                     Potential downside because of deterioration in
    can be caused due to systemic events or                       fundamentals, business environment, management
sentiments surrounding the country, sector or the                  quality and sectoral dynamics resulting in loss of
                company itself.                                                    invested capital.

        Volatility is a friend of a smart investor and gives opportunities to buy at attractive price points.

                 Befriending volatility and reducing the risk of loss of capital is key in Investing.

                                                                                                                        7
Is it right time to invest in Equities?

                                          8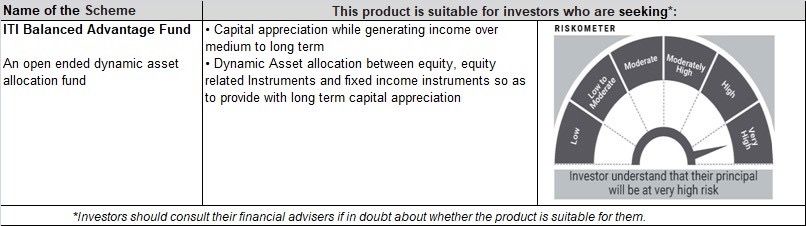
Current economic scenario

  Bottom ofthe               GDP Growthto                  Lowinterest                        IIP @rock
 economiccycle                 accelerate                     rates                             bottom

                                            Narrowrally,
                                                                         Vaccination drives
                 LowCredit                  ~Largenoof
                                                                            to assist in
                   growth                    stocks at
                                                                         economicrebound
                                             attractive
                                               levels

                                                                                                          9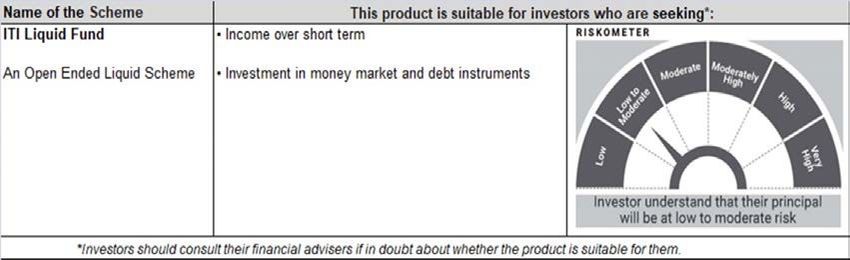
Presenting
  ITI Multi CapFund
(An open ended equity scheme investing across Large
        Cap,Mid Cap and SmallCap stocks)

                                                      10
PotentialRisk ReturnPayoffacrossEquityCategories
Mid or Small
Cap Fund
Potential Risk
Focused
Fund
Multi Cap
Fund
Large & Mid
Cap Fund
Large Cap
Fund
PotentialReturn
11Index returns converge overtime
16000
14000
12000
10000
8000
6000
4000
2000
0
Jan-
Jan-
Jan-
Jan-
Jan-
Jan-
Jan-
Jan-
Jan-
Jan-
Jan-
Jan-
Jan-
Jan-
Jan-
Jan-
Jan-
Jan-
04
05
06
07
08
09
10
11
12
13
14
15
16
17
18
19
20
21
NIFTY 50 -TRI NIFTY 500 -TRI Nifty Midcap 100 - TRI Nifty Smallcap 100- TRI
Data Source – Niftyindices.com. Data Period Jan 2004 to June 2021. Graph shows the movement of indices over time. Past Performance may or may not be sustainable in future. Investments in
mutual funds should not be construed as a guarantee of any minimum returns. There is no capital protection guarantee or assurance of any return. Kindly consult your financial advisor before
investing.
.
12Winners keep changing across Market Caps
BesttoWorst
NSE Small Cap 100 NSE Midcap 100 NSE 500 Nifty
2021(YTDJune 30) 37.8% 29.9% 17.6% 13.2%
NSE Midcap 100 NSE Small Cap 100 NSE 500 Nifty
2020 23.0% 22.8% 17.9% 16.1%
Nifty NSE 500 NSE Midcap 100 NSE Small Cap 100
2019 13.5% 9.0% -3.4% -8.5%
Nifty NSE 500 NSE Midcap 100 NSE Small Cap 100
2018 4.6% -2.1% -14.6% -27.7%
NSE Small Cap 100 NSE Midcap 100 NSE 500 Nifty
2017 58.7% 49.3% 37.7% 30.3%
NSE Midcap 100 NSE 500 Nifty NSE Small Cap 100
2016 8.3% 5.1% 4.4% 3.2%
NSE Small Cap 100 NSE Midcap 100 NSE 500 Nifty
2015 8.2% 7.6% 0.2% -3.0%
NSE Midcap 100 NSE Small Cap 100 NSE 500 Nifty
2014 57.9% 56.6% 39.3% 32.9%
Nifty NSE 500 NSE Midcap 100 NSE Small Cap 100
2013 8.1% 4.8% -3.7% -7.0%
NSE Midcap 100 NSE Small Cap 100 NSE 500 Nifty
2012 41.4% 38.5% 33.5% 29.4%
Nifty NSE 500 NSE Midcap 100 NSE Small Cap 100
2011 -23.8% -26.4% -30.0% -33.1%
NSE Midcap 100 Nifty NSE Small Cap 100 NSE 500
2010 20.4% 19.2% 19.0% 15.3%
NSE Small Cap 100 NSE Midcap 100 NSE 500 Nifty
2009 110.3% 102.2% 91.0% 77.6%
Nifty NSE 500 NSE Midcap 100 NSE Small Cap 100
2008 -51.3% -56.5% -58.7% -70.6%
NSE Small Cap 100 NSE Midcap 100 NSE 500 Nifty
2007 89.3% 79.4% 64.6% 56.8%
NSE Small Cap 100 Nifty NSE 500 NSE Midcap 100
2006 47.6% 41.9% 36.2% 30.9%
Data Source – Niftyindices.com.. Figures are calendar year returns Past Performance may or may not be sustainable in future. Investments in mutual funds should not be construed as a guarantee of any 13
minimum returns. There is no capital protection guarantee or assurance of any return. Kindly consult your financial advisor before investing.Winners keep changingacross sectors
Date Auto Bank Commodities Consumptio Energ FinServ FMCG Infra IT Media Metals Pharma PSE Realty Service
n y s
2007 6.5% 66.1% 112.3% 39.3% 100.2% 84.8% 25.1% 96.6% -11.1% 62.1% 16.1% 86.8% 73.7% 48.4%
2008 -54.0% -48.5% -56.9% -42.6% -47.4% -54.6% -17.8% -56.9% -54.2% -68.3% -73.3% -24.9% -49.1% -82.5% -49.2%
2009 197.7% 83.5% 110.7% 53.0% 63.5% 91.3% 44.4% 40.9% 167.6% 83.6% 232.5% 60.9% 79.7% 71.4% 69.6%
2010 37.5% 32.0% 3.2% 23.0% 4.8% 31.3% 32.9% -3.3% 30.8% 5.2% 0.9% 36.3% -5.5% -25.3% 20.6%
2011 -17.8% -31.7% -33.4% -9.4% -28.2% -28.3% 10.2% -38.0% -17.0% -32.3% -47.2% -9.0% -30.1% -51.3% -23.4%
2012 44.6% 58.4% 20.9% 39.3% 15.5% 54.1% 50.7% 23.0% -0.2% 60.2% 19.4% 32.9% 11.9% 53.6% 28.5%
2013 10.7% -7.7% -6.7% 10.8% 1.9% -6.1% 13.3% -2.8% 60.2% 2.5% -12.2% 27.3% -5.9% -33.6% 10.1%
2014 58.2% 66.2% 18.6% 31.5% 10.1% 59.1% 19.6% 24.2% 20.1% 39.1% 8.4% 44.4% 37.8% 10.8% 39.7%
2015 0.3% -8.9% -7.4% 9.0% 1.1% -4.5% 1.4% -7.6% 1.5% 11.2% -29.4% 9.7% -9.3% -14.3% -2.1%
2016 11.7% 8.5% 27.4% -1.3% 21.6% 6.1% 4.6% -0.9% -5.3% -0.3% 48.4% -13.8% 21.6% -3.5% 2.4%
2017 32.6% 41.4% 38.3% 46.7% 41.9% 42.7% 31.2% 36.1% 14.5% 33.6% 54.0% -5.7% 21.1% 110.7% 33.5%
2018 -22.3% 6.8% -13.6% -1.1% 2.8% 11.3% 15.3% -11.0% 26.1% -25.4% -16.8% -7.3% -17.8% -32.7% 10.0%
2019 -9.4% 18.9% 2.1% 0.6% 13.3% 26.4% 0.1% 4.5% 11.0% -28.9% -9.6% -8.7% -1.4% 29.3% 18.3%
2020 13.1% -2.8% 12.7% 20.5% 9.5% 4.7% 14.7% 14.3% 58.1% -7.6% 18.0% 61.8% -10.4% 5.7% 13.5%
YTD 2021 (June) 15.6% 11.5% 36.5% 8.0% 19.0% 8.5% 7.6% 19.6% 21.1% 9.2% 62.0% 11.1% 32.0% 9.6% 12.1%
Among Top 5 Performing Sectors in that CY Among Bottom 5 Performing Sectors in that CY
Data Source – Niftyindices.com.. Figures are calendar year returns Past Performance may or may not be sustainable in future. Investments in mutual funds should not be construed as a guarantee of 14
any minimum returns. There is no capital protection guarantee or assurance of any return. Kindly consult your financial advisor before investing.Why invest in ITI Multi Cap Fund?
15Aplay across MarketCaps
Unique long term orientation that helps Investors
Mature Phase
Ø Stablegrowth Ø Establishedbusiness Ø Reduced flexibility Ø Lower risk compared
models to Mid Capcompanies
Large
Caps
GrowthPhase
Ø Emerging Ø High growth phaseBut Ø Business not yetwell
companies prone to higherrisks established
Mid
Ø Superiorgrowth Ø Maintains Ø Lower risk comparedto
profile flexibility small cap companies Caps
Start-upPhase
Ø Newlyestablished Ø No trackrecord Ø Prone to significantly higherrisks
businesses
Small
Caps
16Win With An All-Rounder
ITI Multi Cap Fund
Leveraging the Discovering Enjoying the
potential of the best of stability of
Mid Caps Small Caps Large Caps
17Product features
Valuation based approach
to analyze business and Active Allocation
market cycles between Market Cap
Segments
Potential Long
Term Wealth
Benchmark Creation Product
Agnostic Portfolio
Construction
18Product advantages
Can leverage opportunities in Tactical allocation bets within
sectors and stocks appearing market cap segments depending
across market spectrum upon market scenarios
Flexibility to align with market Robust Investment controls
Risk-Reward perceptions and Risk Framework in place
19Risk Monitoring Framework
Sector in Sector not
DecisionMaking Benchmark inBenchmark
Benchmark Weight
At FMLevel + 2.5% ofAUM
+/- 2.5%
Active Sector
ExposureLimits
Any further deviation in multiples
In Consultation with Maximum Upto
of 2.5%. Maximum allowed
CIO & Analyst 10% of AUM.
deviation is Benchmark +/- 10%
Decision Benchmark NonBenchmark
Making Stock Stock
Benchmark Maximum Weight of
At FMLevel Weight +/- 3% 3% of AUM
Active Stock
ExposureLimits
In Consultation with Any further deviation
CIO & Analyst beyond 3%
20Who should invest?
Time Horizon Seeking exposure to
for 3 – 5 years companies across
market caps
Multi Cap
Investor
Seeking potential Looking for all in
higher risk one solution across
adjusted returns risk profiles
21Meet the Fund Managers &
understand their learnings
Mr.GeorgeHeberJoseph Mr. PradeepGokhale
CEO & CIO
Head - Equity
Big Companies Mid Caps segment Within small Caps, Great Companies
give stability to the has higher bottom up at cheap valuation
portfolio and exposure to stock selection should not be
protect the emerging and high is vital missed,
downside in bad growth sectors. irrespective of the
market situations overall market
valuation
22Which companies to bet on?
Quality & Soundbalance
Scalability sheet
Good corporate
Strong marketshare
governanceand
gains or niche
sound track
segment leadership
record
Capable of
sustaining good Attractive
valuation
RoEs andRoCEs
23Our Equityinvestment process
Bottom Up stock Top Down Sector Eligible Portfolio
selection Allocation Universe
• Growth drivers • Emerging Themes • Assessment of Liquidity
• Leverage • Expected Tailwinds and Margin of safety
• Corporate Governance • Macro Economic • Valuation metrics
metrics Orientation
24Our investment approach & risk management
Continuous Monitoring
Post investment Decision, the investee companies are always
under the radar for monitoring their valuation metrics, company
fundamentals and any news surrounding the same
Diligent Screening and Evaluation
Internal Limits
Disciplined approach towards
screening and evaluation of stocks Robust internal risk management framework to
eligible under a stated investment Risk avoid any instances of undue concentration
mandate with comprehensive Management risks and higher volatility
Research Framework
Experienced Personnel Periodic Position Sizing
Dedicated and knowledgeable team of Regular evaluation of Portfolio sizing to optimize the
Analysts promptly mentored by senior risk reward trade-off and simultaneously ensuring
experienced Investment Professionals conformance with stated investment mandate
25Our Equity investment philosophy
S Q L
Margin of Quality of The Low
Safety Business Leverage
• Quality of the business is of great significance while • High leverage significantly reduces a business’s ability to
• Margin of safety is the fair value of the
investing. withstand economic downturns & business cycle
business minus the current shareprice
challenges
• Quality companies with strong competitive advantages
• Buying stocks with good safety margin is an • Low leverage companies are generally cash rich and can
have been long term wealth creators.
critical for excellent investment support growthorganically.
experience.
• We would like to invest in stocks that we understand
well, good Industry structure, strong business moats, • Such companies are able to invest and grow their
• This helps in creating good long term wealth excellent managements, have growth ambitions and business and create wealth for investors
strong balancesheets
26Investment Style is “GARP "
Growth At Reasonable Price
27What do we look for?
Emerging sectors with high growth potential - e.g.,healthcare, logistics, non-lending financials, digitally enabled
businesses, e-commerce,etc.
Companies gaining market share
Companies with niche market positions
Companies benefitting from shift from unorganised to organised sectors
Beneficiaries of Government policies: i) Atmanirbhar Bharat ii) Focus on creating infrastructure
Plays on rural economy
Companies focusing on deleveraging / restructuring or facing macro headwinds which can reverse
Cyclical companies trading at attractive valuations
28Portfolio construct
29Top portfolio exposures –June 2021
Top Sector Exposures Top Scrip Exposures
27% Sun Pharma 9.98%
CONSUMERGOODS
Lupin 9.63%
PHARMA 22%
ITC 8.81%
FINANCIAL SERVICES 22%
Eicher Motors 6.56%
AUTOMOBILE 12%
V-GuardIndustries 5.87%
IT 5%
Amara Raja Batteries 5.04%
OIL &GAS 4%
M & M Fin Serv 4.96%
MEDIA, ENTERTAINMENT & PUBLICATION 2%
Reliance Industries 4.31%
METALS 2% DCB Bank 4.31%
INDUSTRIAL MANUFACTURING 1% IDFC 3.43%
Sector Concentration Stock Concentration
Top 3 Sectors 70.63% Top 5 Stocks 40.85%
Top 5 Sectors 87.64% Top 10 Stocks 62.89%
Top 10 Sectors 97.32% Top 20 Stocks 91.96%
30Market Capallocationtrend%
Large Mid Small Others
120.0
2.7 2.6 1.6 0.5 2.5 2.7
100.0
28.6 30.3 28.6 26.4
80.0 31.1
39.5
60.0 26.5 25.7
29.3 25.2
27.6
27.8
40.0
20.0 42.8 44.4 45.2
39.5 38.7
30.2
0.0
Jan/21 Feb/21 Mar/21 Apr/21 May/21 Jun/21
Trend Since Jan 2021 when SEBI guidelines on Multi Cap Allocation rules started applying. Market Classification applied as per AMFI prescribed criteria
31Fund Performance –June 2021
Value of Investment of ₹ 10,000
Additional Additional
Fund Benchmark Benchmark
Period Benchmark Fund (Rs) Benchmark
Returns (%) Returns (%) (Rs)
Returns (%) (Rs)
ITI Multi Cap Fund - Regular -Growth
Last 1 Year 54.11% 74.01% 54.58% 15,411 17,401 15,458
Since Inception 17.51% 24.48% 19.02% 14,099 15,937 14,487
ITI Multi Cap Fund - Direct -Growth
Last 1 Year 57.45% 74.01% 54.58% 15,745 17,401 15,458
Since Inception 20.05% 24.48% 19.02% 14,756 15,937 14,487
Past performance may or may not be sustained in future. Different Plans i.e. Regular Plan and Direct Plan under the scheme have different expense
structure. Benchmark: Nifty 500 Multicap 50:25:25 TRI # Additional Benchmark: Nifty 50 TRI. With Effect from December 31, 2020, the Benchmark is
changed to Nifty 500 Multicap 50:25:25 TRI from Nifty 500 TRI.
Mr. George Heber Joseph and Mr. Pradeep Gokhale are jointly managing the scheme since its inception 15th May 2019. Face Value per unit: Rs. 10.
Performance of other funds managed by Mr. George Joseph and Mr. Pradeep Gokhale are in Appendix I
32Fund SIP Performance – June 2021
Additional Additional
Amount Fund Value Fund Returns Benchmark Benchmark
Period Benchmark Benchmark
Invested (Rs) (%) Value (Rs) Returns (%)
Value (Rs) Returns (%)
ITI Multi Cap Fund - Regular - Growth
Last 1 Year 1,20,000 1,53,146 55.31% 1,60,432 68.38% 1,47,862 46.03%
Since Inception 2,50,000 3,36,107 30.08% 3,76,308 43.04% 3,38,979 31.03%
ITI Multi Cap Fund - Direct - Growth
Last 1 Year 1,20,000 1,55,049 58.70% 1,60,432 68.38% 1,47,862 46.03%
Since Inception 2,50,000 3,44,266 32.76% 3,76,308 43.04% 3,38,979 31.03%
Past performance may or may not be sustained in future. Different Plans i.e. Regular Plan and Direct Plan under the scheme have different expense
structure. Benchmark: Nifty 500 Multicap 50:25:25 TRI # Additional Benchmark: Nifty 50 TRI. With Effect from December 31, 2020, the Benchmark is
changed to Nifty 500 Multicap 50:25:25 TRI from Nifty 500 TRI.
For SIP returns, monthly investment of Rs.10,000 invested on the 1st business day of every month has been considered. CAGR Returns (%) are
computed after accounting for the cash flow by using the XIRR method (investment internal rate of return).
Mr. George Heber Joseph and Mr. Pradeep Gokhale are jointly managing the scheme since its inception 15th May 2019. Face Value per unit: Rs. 10.
Performance of other funds managed by Mr. George Joseph and Mr. Pradeep Gokhale are in Appendix I
33Investment team
GEORGE HEBERJOSEPH
CEO & CIO
Nisha Sanjeev Shweta Raut
PradeepGokhale Vikrant Mehta Harish Iyer Madhur Maheshwari
Head – Legal, DealingTeam ExecutiveAssistant
Head – Equity Head – FixedIncome Products & Risk Quant Strategist
Secretarial & and Investment
Management
Compliance Support
Re a h alysts
Fund Manager / Research Analysts
ShashankSawant Priya Sridhar Vikas Nathani
Dealer – Debt Dealer – Equity Dealer - Equity
Sahil Doshi Ayushi
Rohan Pratibh Bhavesh Garodia
Agarwal Research
Korde Jain Analyst Hetal Gada Research
Fund Sr.Research Research Research Analyst
Retail, Non-
Manager Analyst Analyst Analyst Bankingand
Lending
FMCG, Industrials, Pharma, Financials, Cement, Financial
Consumer Construction, Healthcare, Media, Metalsand Services
Durables, Real-Estate, Agri & Telecom, Oil & Gas 34
Auto Power, Chemicals Services
Transportation andTextiles
Researchand FundManagement Teamwith a combined experienceof 114years acrosssectors 34ITI Multi Cap Fund
Benchmark - Nifty 500 Multicap 50:25:25 TRI
Investment Objective- The investment objective of the Scheme is to generate long-term capital appreciation from a diversified portfolio that
predominantly invests in equity and equity-related securities of companies across various market capitalization.
However, there can be no assurance that the investment objective of the scheme would be achieved.
Indicative Allocation (% Of Total
Type of Instruments Assets) Risk Profile
Maximum Minimum High/Medium/Low
Equity and Equity related instruments 100% 75%
Large Cap Companies 50% 25% Medium to High
Mid Cap Companies 50% 25% Medium to High
Small Cap Companies 50% 25% Medium to High
Debt and Money Market Instruments 25% 0% Low to Medium
Fund Managers - Mr. George Heber Joseph and Mr. Pradeep Gokhale
Minimum Investment Amount - Rs. 1000 and in multiples of Rs. 1 thereafter
Plans & Options - Plans - Direct & Regular Plan. Options – Growth & IDCW
Exit Load - 1% if redeemed or switched out on or before completion of 12 months; Nil thereafter.
35Appendix 1
Performance of Funds Managed by Mr. George Joseph and Mr. Pradeep Gokhale
Value of Investment of ₹ 10,000
Benchmark Returns Additional Benchmark Additional Benchmark
Period Fund Returns (%) (%) Returns (%) Fund (Rs) Benchmark (Rs) (Rs)
ITI Long Term Equity Fund - Regular - Growth
Last 1 Year 57.45% 60.77% 54.58% 15,745 16,077 15,458
Since Inception 23.37% 24.84% 21.18% 14,238 14,524 13,815
ITI Long Term Equity Fund - Direct - Growth
Last 1 Year 60.95% 60.77% 54.58% 16,095 16,077 15,458
Since Inception 26.14% 24.84% 21.18% 14,778 14,524 13,815
Past performance may or may not be sustained in future. Different Plans i.e. Regular Plan and Direct Plan under the scheme have different expense structure. Benchmark: Nifty 500 TRI # Additional Benchmark: Nifty 50 TRI.
Mr. George Heber Joseph and Mr. Pradeep Gokhale are jointly managing the scheme since its inception 25th October 2019. Please refer to the link Leaflet for performance of all schemes managed by the fund manager.
Face Value per unit: Rs. 10.
Value of Investment of ₹ 10,000
Benchmark Returns Additional Benchmark Additional Benchmark
Period Fund Returns (%) Fund (Rs) Benchmark (Rs)
(%) Returns (%) (Rs)
ITI Balanced Advantage Fund - Regular - Growth
Last 1 Year 18.76% 28.36% 54.58% 11,876 12,836 15,458
Since Inception 0.71% 16.06% 20.05% 10,107 12,501 13,150
ITI Balanced Advantage Fund - Direct - Growth
Last 1 Year 21.39% 28.36% 54.58% 12,139 12,836 15,458
Since Inception 2.92% 16.06% 20.05% 10,441 12,501 13,150
Past performance may or may not be sustained in future. Different Plans i.e. Regular Plan and Direct Plan under the scheme have different expense structure. Benchmark: Nifty 50 Hybrid Composite Debt 50:50 Index#
Additional Benchmark: Nifty 50 TRI. With effect from December 31, 2020, the Benchmark is changed to Nifty 50 Hybrid Composite Debt 50:50 Index from CRISIL Hybrid 50+50 - Moderate Index. Mr. George Heber Joseph
and Mr. Pradeep Gokhale are jointly managing the scheme since its inception 31st December 2019. Performance details of other scheme(s) managed by the same Fund Managers has not been provided as the
scheme has not completed 1 year. Face Value per unit: Rs. 10.
36Appendix 1
Performance of Funds Managed by Mr. George Joseph and Mr. Pradeep Gokhale
Value of Investment of ₹ 10,000
Benchmark Returns Additional Benchmark Additional Benchmark
Period Fund Returns (%) (%) Returns (%) Fund (Rs) Benchmark (Rs) (Rs)
ITI Small Cap Fund - Regular - Growth
Last 1 Year 83.63% 112.73% 54.58% 18,363 21,273 15,458
Since Inception 35.73% 41.62% 22.55% 15,159 16,062 13,190
ITI Small Cap Fund - Direct - Growth
Last 1 Year 87.72% 112.73% 54.58% 18,772 21,273 15,458
Since Inception 38.77% 41.62% 22.55% 15,623 16,062 13,190
Past performance may or may not be sustained in future. Different Plans i.e. Regular Plan and Direct Plan under the scheme have different expense structure. Benchmark: Nifty Small Cap 100 TRI# Additional Benchmark:
Nifty 50 TRI.
Mr. George Heber Joseph and Mr. Pradeep Gokhale are jointly managing the scheme since its inception 17th Feb 20. Face Value per unit: Rs. 10.
Performance of Funds Managed by Mr. George Joseph and Mr. Vikrant Mehta Value of Investment of ₹ 10,000
Benchmark Returns Additional Benchmark Additional Benchmark
Period Fund Returns (%) Fund (Rs) Benchmark (Rs)
(%) Returns (%) (Rs)
ITI Arbitrage Fund - Regular - Growth
Last 1 Year 2.40% 3.51% 3.58% 10,240 10,351 10,358
Since Inception 3.31% 3.53% 5.36% 10,606 10,647 10,990
ITI Arbitrage Fund - Direct - Growth
Last 1 Year 3.17% 3.51% 3.58% 10,317 10,351 10,358
Since Inception 4.08% 3.53% 5.36% 10,751 10,647 10,990
Past performance may or may not be sustained in future. Different Plans i.e. Regular Plan and Direct Plan under the scheme have different expense structure. Benchmark: Nifty 50 Arbitrage Index # Additional Benchmark:
Nifty 50 TRI. Mr. George Heber Joseph - managing this scheme since inception (September 09, 2019) & Mr. Vikrant Mehta from (January 19, 2021). Face Value per unit: Rs. 10.
37Appendix 1
Performance of Funds Managed by Mr. George Joseph and Mr. Vikrant Mehta
Value of Investment of ₹ 10,000
Benchmark Returns Additional Benchmark Additional Benchmark
Period Fund Returns (%) Fund (Rs) Benchmark (Rs)
(%) Returns (%) (Rs)
ITI Overnight Fund - Regular - Growth
Last 7 days 3.00% 3.24% 4.17% 10,006 10,006 10,008
Last 15 days 3.02% 3.26% 1.36% 10,012 10,013 10,006
Last 30 days 3.00% 3.25% 2.45% 10,025 10,027 10,020
Last 1 Year 2.93% 3.18% 3.58% 10,293 10,318 10,358
Since Inception 3.34% 3.53% 5.14% 10,569 10,602 10,882
Past performance may or may not be sustained in future. Different Plans i.e. Regular Plan and Direct Plan under the scheme have different expense structure. Above Returns are for Regular plan Growth option only.
Benchmark: CRISIL Overnight Fund Index # Additional Benchmark: CRISIL 1 Year T-Bill Index. Mr. George Heber Joseph - managing this scheme since inception (October 28, 2019) & Mr. Vikrant Mehta from (January 19,
2021). Returns less than 1 year period are simple annualized and greater than 1 year are compounded annualized. Face Value per unit: Rs. 1000.
Value of Investment of ₹ 10,000
Benchmark Returns Additional Benchmark Additional Benchmark
Period Fund Returns (%) (%) Returns (%) Fund (Rs) Benchmark (Rs) (Rs)
ITI Liquid Fund - Regular - Growth
Last 7 days 3.17% 3.73% 4.17% 10,006 10,007 10,008
Last 15 days 3.14% 3.59% 1.36% 10,013 10,015 10,006
Last 30 days 3.08% 3.57% 2.45% 10,025 10,029 10,020
Last 1 Year 2.91% 3.71% 3.58% 10,291 10,371 10,358
Since Inception 3.83% 4.98% 5.78% 10,857 11,122 11,308
Past performance may or may not be sustained in future. Different Plans i.e. Regular Plan and Direct Plan under the scheme have different expense structure. Benchmark: CRISIL Liquid Fund Index # Additional Benchmark:
CRISIL 1 Year T-Bill Index. Mr. George Heber Joseph - managing this scheme since inception (April 24, 2019) & Mr. Vikrant Mehta from (January 19, 2021). Returns less than 1 year period are simple annualized and greater
than 1 year are compounded annualized. Value per unit: Rs. 1000
38Riskometer & disclaimers
www.itiamc.com
Toll Free Number 1800 266 9603 | Email mfassist@itiorg.com
All figures and data given in the document are dated unless stated otherwise. In the preparation of the material contained in this document, the AMC has used information that is publicly
available, including information developed in-house. However, the AMC does not warrant the accuracy, reasonableness and/ or completeness of any information.
The information provided is not intended to be used by investors as the sole basis for investment decisions, who must make their own investment decisions, based on their own
investment objectives, financial positions and needs of specific investor. Investors are advised to consult their own legal tax and financial advisors to determine possible tax, legal and
other financial implication or consequence of subscribing to the units of ITI Mutual Fund. The information contained herein should not be construed as a forecast or promise nor should it
be considered as an investment advice.
The AMC (including its affiliates), the Mutual Fund, the trust and any of its officers, directors, personnel and employees, shall not liable for any loss, damage of any nature, including but
not limited to direct, indirect, punitive, special, exemplary, consequential, as also any loss of profit in any way arising from the use of this material in any manner
Mutual Fund investments are subject to market risks, read all scheme related documents carefully
39Riskometer of other funds managed by theFund
Managers
Name of the Scheme This product is suitable for investors who
are seeking*:
ITI LongTermEquity Fund
• Capital appreciation over long term
An open ended equity linked
saving scheme with a statutory • Investment in equityandequityrelatedsecurities
lockinof 3yearsandtaxbenefit
*Investors should consult their financial advisors if in doubt about whether the product is suitable
for them.
Name of the Scheme This product is suitable for investors who Name of the Scheme This product is suitable for investors who
are seeking*: are seeking*:
• To generate income by predominantly investing in
ITI Arbitrage Fund ITI Small Cap Fund
arbitrage opportunities
• Capital appreciation over long term
• Investments predominantly in arbitrage An open ended equity
An open ended scheme investing predominately investing in small • Investment in a diversified portfolio predominantly
opportunities in the cash and derivative segments
in arbitrage opportunities of the equity markets and the arbitrage consisting of equity and equity related instruments
cap stocks
opportunities available within the derivative of small cap companies
segment and by investing the balance in debt and
money market instruments
*Investors should consult their financial advisors if in doubt about whether the product is suitable
for them.
*Investors should consult their financial advisors if in doubt about whether the product is suitable
for them.
40Riskometer of other funds managed by the Fund
Managers
The performance details provided herein are of Growth option under Direct and Regular Plans. Assuming Rs. 10,000 invested as lumpsum 1 year ago as
well as since inception. The returns for the respective periods are provided as on last available NAV of 30th June 2021 for the respective Schemes.
Returns 1 year and above are Compounded Annualized, below 1 year returns for Overnight Fund and Liquid Fund are Simple Annualized. Load is not
taken into consideration for computation of performance. Different plans shall have a different expense structure. The expenses of the Direct Plan
under the Scheme will be lower to the extent of the distribution expenses / commission charged to the Other than Direct Plan. The performance data
of the scheme(s) managed by the respective Fund Manager which has/have not completed 1 year is not provided.
41MutualFund investments are subject to market risks, read all scheme
related documentscarefully.
42You can also read