Estimating Environmental Flows (EFlow) in India - Prof. Ramakar Jha, Ph.D. Professor, Department of Civil Engineering National Institute of ...
←
→
Page content transcription
If your browser does not render page correctly, please read the page content below
Estimating Environmental
    Flows (EFlow) in India

            Prof. Ramakar Jha, Ph.D.
  Professor, Department of Civil Engineering
National Institute of Technology Rourkela INDIA
               rjha43@gmail.com
             Cell: +91 9439107366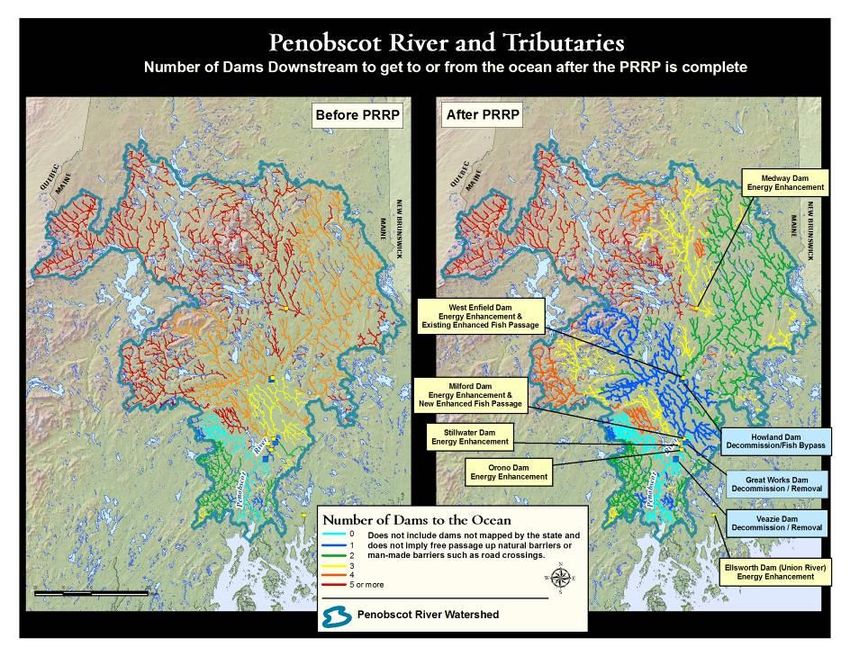
ENVIRONMENTAL FLOWS –
                                              WHERE ARE THEY?
                                                                                                Potentially utilizable water (for
                                                                                                agriculture, industry etc)
                        Total resource capacity, e.g.
                        “natural” Mean Annual Runoff
                        (MAR)                                                                         Total volume of
                                                                                                      ENVIRONMENTAL FLOW
                                                                                                      REQUIREMENTS

                                    E.Rapti (Nepal), Rajaya, 560 km2

                  120                                                                              • To take flow variability into account, the
                  100                                                                              total EFR is assumed to be made of two
                                                                                    Quickflow      requirements - one for low flow and one
Discharge, m3/s

                  80
                                                                                                   for high flow:
                  60

                  40                                                                               EFR = Low Flow Requirement (LFR) +
                  20
                                                                                                   High Flow Requirement (HFR
                   0                                                                Baseflow
                        0     50     100        150         200         250   300     350
                                           Days since 1 January, 1991

                                            baseflow      total flow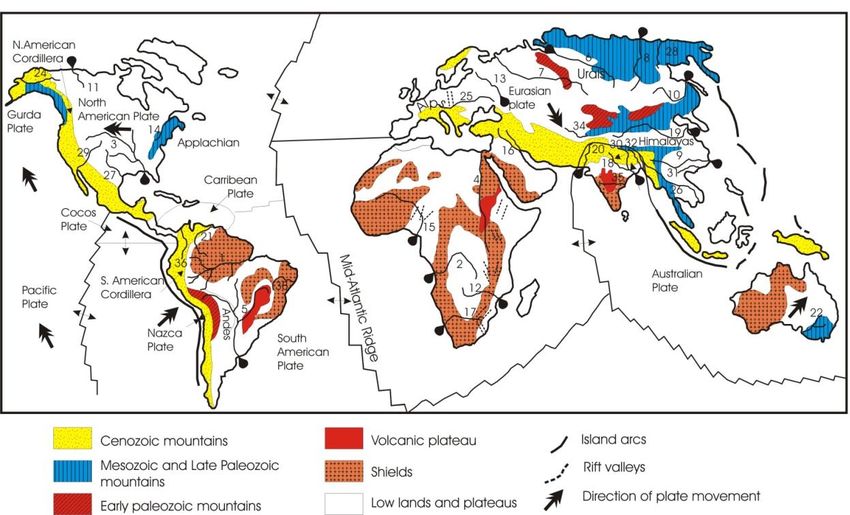
Large River systems
• Sustain civilizations (past,
present) and biodiversity
• One of the most important
natural resources for the
future of human societies
Large Rivers
Main plumbing of the continents
Source: Indian Today, Jan 26, 1998
Multidisciplinary River
science necessary for
monitoring and managing
river futures
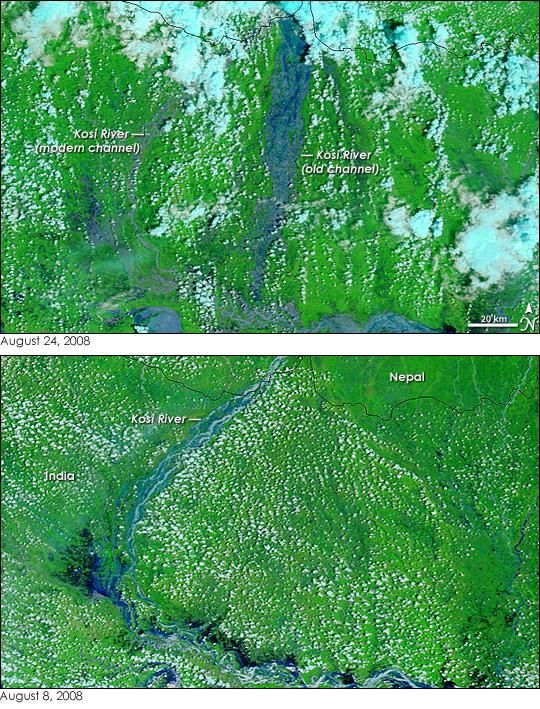
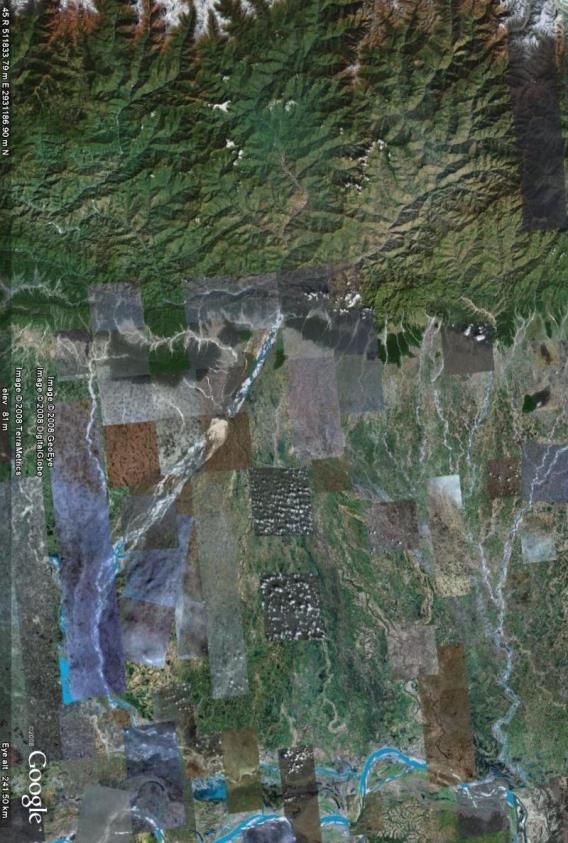
Tandon & Sinha (2007)‘Command & Control’ approach: (mis)management
Reoccupied
old channel
Himalaya
120
km
Megafan
surface
Kosi River system (Source: NASA)
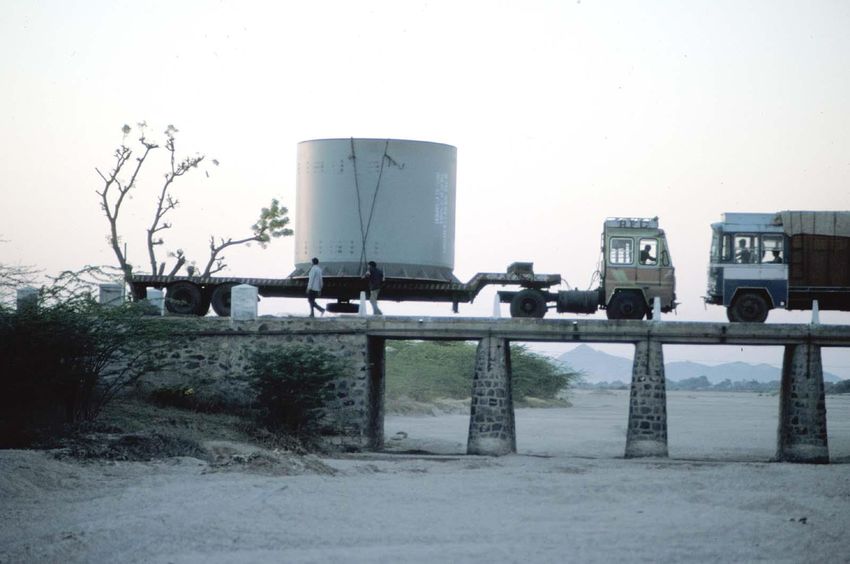
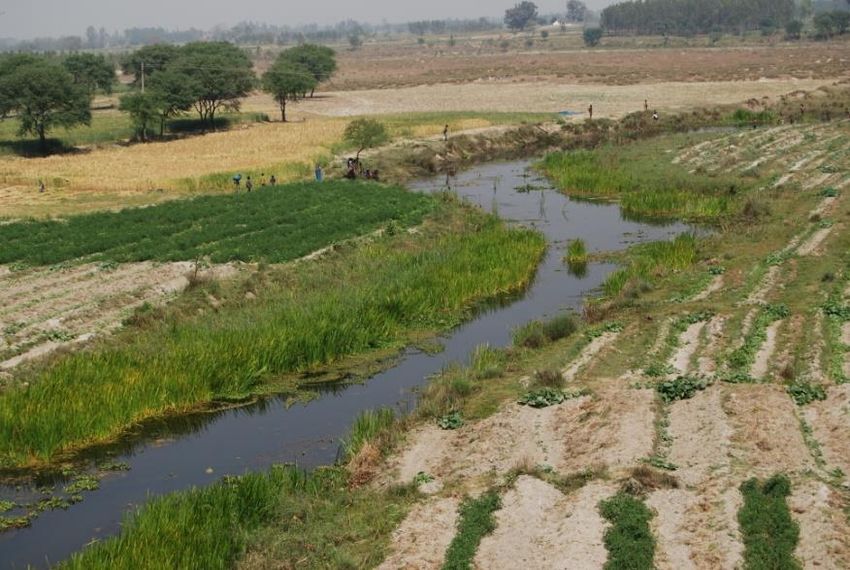
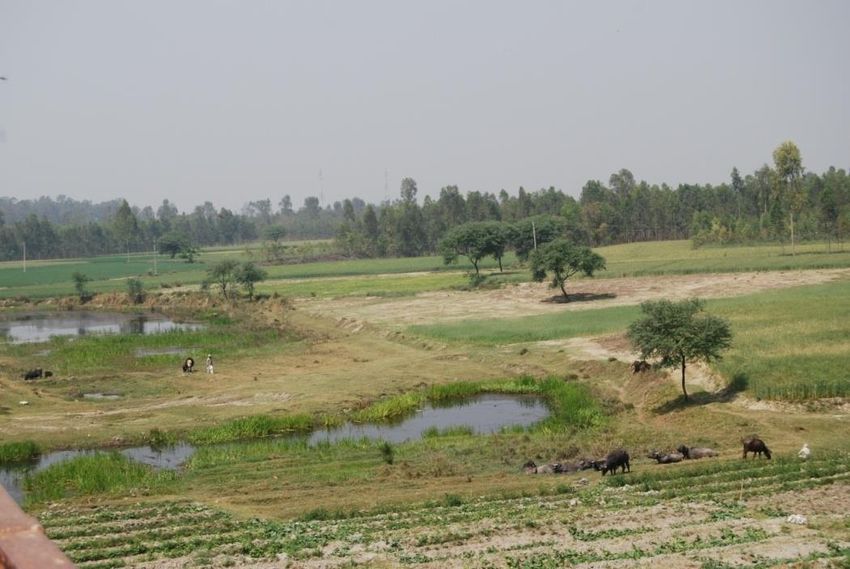
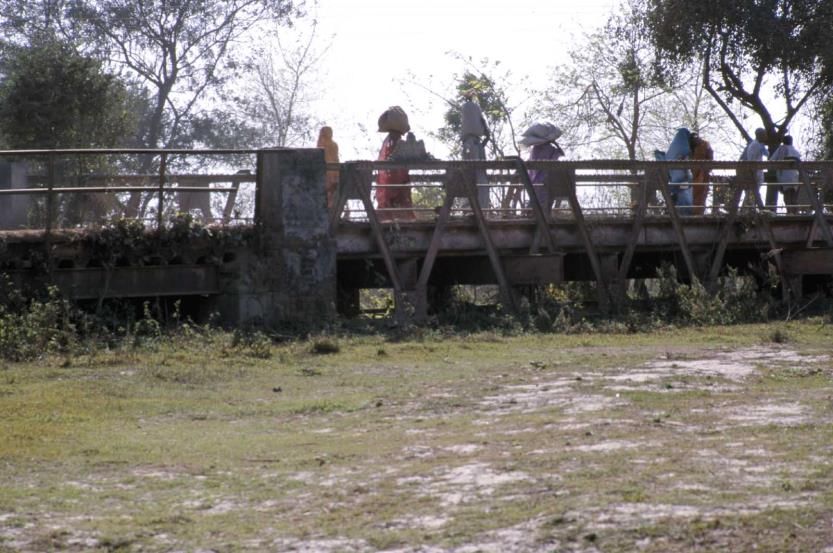
The
purposeless
bridges in
Bihar, India
Baghmati River Baghmati RiverHydro-Geomorphology - Ecology Bridge
Solutions in ESS are hindered “by a general failure to adequately stir
existing ingredients together” (Harte, 2002).
Geomorphology Ecology
(Processes- (Darwinian
Gravitational
potential Newtonian Approach)
Rainfall (Water) Approach) Evolutionary
Processes
Resources
Scale, Hierarchy, Connectivity, Variability & Complexity
GP RCC (1980)
FPC
FPZ
RES (2006)
Lg Lt
V
River science
- requires multidisciplinary & Hydrology
holistic understanding Discharge, Sediment LoadRiverine Ecosystem Synthesis
River science
Riverine ecosystem synthesis
Fluvial Lotic ecology Landscape ecology
Geomorphology • River continuum concept • Patch dynamics
(RCC)
• Process domains • Hierarchy theory
(stream power) • Flood pulse concept (FPC)
• River hierarchy • Functional Process zone
(scale) (FPZ)
• River networks • River Ecosystem synthesis
[(Dis)connectivity] (RES)
Riverscape
Modified after Thorp, et al., 2008Ganga Riverscape
Riverscape – river, its catchment
including natural and cultural
attributes and its interactions
Idealised view of riverscape
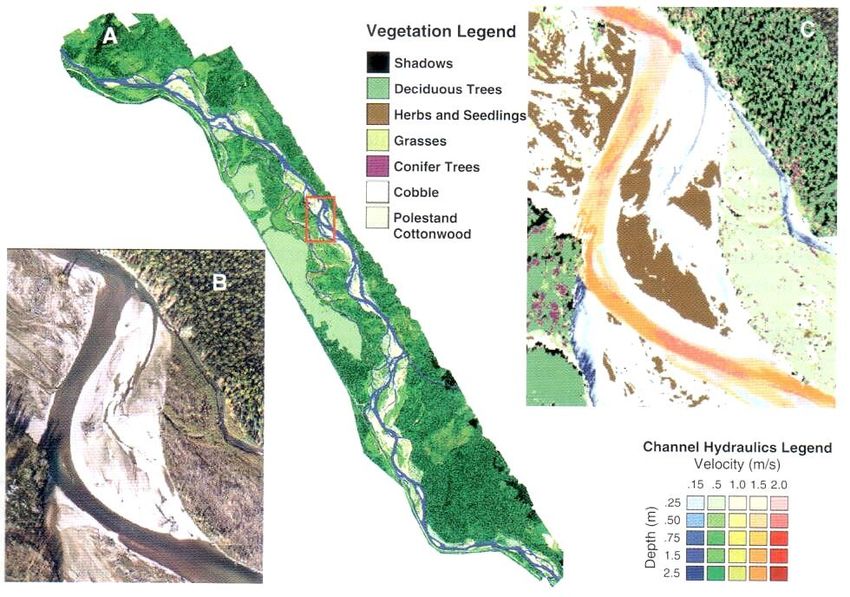
High resolution Vegetation-hydraulic relationship
0 km 2
Modified after Stanford, 2006
Stanford, 2006 Flathead R, MontanaRiverine landscape & functional
process zones (FPZs) (Thorp, et al., 2008)
Riverine Continuum Concept
(Vannote et al., 1980; Craig, 2002)Large River systems Ganga Dispersal System in the
Himalayan Foreland Basin (HFB)
Bridging Physical-Biological aspects
• Parameters Himalaya/Tibet
– Drainage area (A) – 800, I
000 km2
– River Length (Lr) – 2500 G
km B
– Average annual discharge
(Q)- 7500 m3/s Tidal
– Annual suspended &
dissolved load – 100 mt Limit
• Landscape diversity &
multicausality
SW Indian
Monsoon Plate
(Hovius, 1998; Motion
Tandon & Sinha, 2007) I – Indus R, G – Ganga R, B – Brahmaputra RMorphological diversity
Expression of geodiversity at
landscape scale resulting
from water & sediment
Patna dispersal variability
Fan-Interfan systems
(Eastern Ganga plains)
(modified after Geddes, 1960; Ganga
Sinha and Friend, 1994) Valley
Interfluve
(plains-fed
Rivers)
Valley-Interfluve
Yamuna
System Valley
(Western Ganga plains)
Cratonic rivers
& badlands
(Sinha et al., 2005)Geomorphic diversity in the Ganga system: causative factors
Tectonic +Climate Stream power
Unit Stream Power (Bankfull discharge) = .Q.S/w Consequences:
Ganga(Garh)
Unit stream power (Mean annual flood)
• Complex spatial response of rivers
Yamuna (Delhi)
Ganga (Hardwar)
Ghaghra (Zalimnagar)
45
Ganga (Allahabad
• Stream power variable ( water &
Unit Stream Power (W/sq. m)
40
Ganga (Patna)
sediment discharge, slope)
35
• Changes river’s equilibrium profile
Ganga (Kanpur)
Baghmati(Dheng)
30
Incision / Aggradation
Baghmati (Hayaghat)
25
Rapti
Kosi (Baltara)
20
Sediment Output Variability
Kosi (Kursela)
6.0
15 West
WestGanga plains Plains
Ganga
Sediment Yield (x1000t/sq km/yr)
10 Rapti-Ghaghara
Rapti-Ghaghra
System system
5
East
East Ganga
Ganga plains Plains
0
WGP EGP 4.0
(Sinha et al., 2005)
2.0
0.0
Discharge Locations 0 200 400 600
Sed Yield Locations Drainage basin area (sq km)
(Sinha et al., 2005)Geomorphology-Ecology relationship in
the Ganga plains: implications for E-flows
• E-flow: how much water is required
to protect and conserve river
function
• Geomorphological perspective:
Water allocation is necessary to
maintain structure and function of the
river
• Biological perspective: maintain
individuals, populations, communities
and ecosystem processes
Multi-scale interactions
Interdisciplinary framework: among biota, physical
requires linking changes in river structure and hydrological
discharge with geomorphologic and processes
ecological processesRiver ecosystems
Hierarchy
Connectivity
Scale
Spatial
Temporal
Nested levels of Organisation Scale & Hierarchy
RELATIONSHIP in a river system
OF LEVEL TO
THE GRAIN
(Thorp et al., 2008)
AND EXTENT OF
SCALE
Pattern variation
at different
scales (After Rice
et al., 2001)Landscape classes & connectivity
Landscape Connectivity Longitudinal Connectivity
The way in which different Himalayan Himalayan
landscape compartments fit
together in the catchment Hinterland Hinterland
(Brierley, et al., 2005)
Longitudinal connectivity WGP EGP LGP
Lateral connectivity
Vertical connectivity
Cratonic Cratonic Bay of
Why is it important? Hinterland Hinterland Bengal
Movement of biophysical fluxes
in the dispersal system
Connectivity shapes the
operation of geomorphic
processes over a range of spatial
and temporal scale
To predict future landscape Lateral connectivity
trajectories• Floodplains are important ecotones
(transitional areas) that regulate
interactions in rivers
• Lateral connection between main
river and floodplains
– Exchange of carbon and nutrients
– Influenced by magnitude, frequency
and duration of flooding
• Hydrological fragmentation –
reduction or elimination of
connections between patches in a
landscape Implications for E-flows: Restore
• Landuse changes in floodplains flooding of large areas of
– Change in ‘reactive floodplain surface floodplains, for longer period and
area’ with strategic timingHydropower Plan
Conservation Plan
Spawning
habitat
Headwater
habitat
Floodplain Existing dam
fishery Proposed dam
Priority conservation river segment Source: TNCLack of integrated planning
Projects in areas of conservation
concern carry a heavy
mitigation load
Dam operations constrained by
environmental flow regime
Source: TNCHydropower Plan
Cross-compare Scenarios
Conservation Plan
Existing dam
Proposed dam
Priority conservation river segment Source: TNCCross-compare Scenarios
Locate additional dams
on already Locate areas of conflict
developed segment
and eliminate
conflicting dam Existing dam
Proposed dam
Priority conservation river segment
Operations of total Locate alternative
cascade is less conservation segment
constrained by with similar
environmental flow ecosystem values
requirements
Evaluate Results:
Modify downstream
dam operations to re-
-Similar ecosystem values?
regulate flows to -Similar hydropower outputs?
improve flow regime
in flood-plain
conservation area
Source: TNCPenobscot River Restoration The Nature Conservancy
US Army Corps of Engineers
Energy Piscataquis River Fisheries
Penobscot River
Howland
Medway Dam West Enfield Dam
(expanded) Existing Fish Passage
Howland Dam
West Enfield Dam Decommission /
Innovative Fish Bypass
Penobscot River
Milford Dam
Milford Dam New Upstream
Fish Passage
0
Stillwater Dam Great Works Dam
Indian Island
Decommission /
(expanded) Removal
Stillwater River
Old Town
Orono Dam Veazie Dam
Decommission /
(added) Orono
Removal
Ellsworth Dam
(Union River) Bangor Penobscot RiverMontana or Tennant Method Narrative description of Recommended flow Recommended flow general condition of regimens (% of MAF) regimens (% of MAF) flow October to March April to September Flushing or maximum 200% 200% Optimum range 60-100% 60-100% Outstanding 40% 60% Excellent 30% 50% Good 20% 40% Fair or degrading 10% 30% Poor or minimum 10% 10% Severe degradation
Flow Duration Curve Analysis
The 7Q10 Flow
•   Construct flow duration curve of each water year
    by plotting and arranging the daily discharge
    values in descending order.
•   After construction of FDC for each year, read
    values of daily discharge at every 5% probability of
    exceedance.
•   Make separate table for each year Discharge Vs
    Probability of exceeedance.
•   Rank in ascending order of the discharge values
    read from each flow duration curve of a given N
    year term.
m
•
P
n 1
100
Calculate the plotting position with the following Weibull
plotting formula, select the type probability paper to be
used, and plot the data on the probability paper
• (1)
• where, P is the probability of all events less than or equal
to each discharge value, m is the rank of the event, and n
is the number of events on record.
• Now, The flow duration curve for various recurrence year
are developed by using the distribution characteristics of
a set of probability plots of stream now calculated by the
Weibull plotting formula at suitable time intervals from 0
to 100 percent on the time axis.
• Visually fit a straight line through the estimated values.• Using straight line equation, get the discharge value down
from the best fit line at the chosen probability value for
various return period (1 year, 2 year, 5 year, 10 year, 20
year, 50 year and 100 year).
• Repeat steps 3 to 6 at suitable time intervals from 0 to
100 percent of the time axis ( in the present case it is
taken at every 5%).
• The developed FDC were used to evaluate the severity of
high, ordinary, and low flow regimes of Brahmani-
Baitarani River Systems.
• The developed FDC were used to evaluate the severity of
high, ordinary, and low flow regimes of Brahmani-
Baitarani River Systems.
• Plot probability daily discharge values read at suitable
intervals and draw a smooth FDC of return period of 1
year, 2 year, 5 year, 10 year, 20 year, 50 year and 100 year.Range of Variability analysis
Holistic Models
•   MAINTENANCE OF AQUATIC LIFE
•   STREAM SELF-PURIFICATION AND WATER
    QUALITY IMPROVEMENT
•   SEDIMENT TRANSPORTATION AND
    FLUSHING
•   CHANNEL SEEPAGE
•   CHANNEL EVAPORATION
Figure 1: Brahmani River system in Orissa, India
Figure 2: Daily discharge of sampling stations in the Brahmani River system
Table 1: Availability of data in the
Brahmani River system
 River       Hydrological      Water     Ecological Ancillary
 system      (rainfall, flow   quality   data       data
 /Sampling   and               data
 station     groundwater)
             data
 Tilga       1980-2003         1990-2003 2004-2005 Soil maps,
                                                   land      use
 Panposh     1989-2003         1990-2003 2004-2005
                                                   maps,
 Gomlai      1980-2003         1990-2003 2004-2005 contour
                                                   maps,
 Samal       1980-1994         1990-2003 2004-2005 drainage
 Talcher     1985-1996         1990-2003 2004-2005 maps     and
                                                   were
 Jenapur     1980-2003         1990-2003 2004-2005 obtained.
MAINTENANCE OF AQUATIC LIFE
THE
 METHODOLOGY
Based On:

• A Flow Time Series at a site which reflects
  ‘natural’ or unregulated flow variability (observed
  or simulated)

• ‘A period of record Flow Duration Curve
  (FDC)’ represented by 17 percentage points

• developed by Smakhtin and Anputhas in 2006
Flow duration curves (FDC) technique,
    were tested and applied to estimate 7-
    day 10-year flow (7Q10) FDC in Brahmani
    River.
•
• The Brahmani basin is dominated by a humid sub-
  tropical monsoon climate, low-flow episodes of
  sufficient severity usually do not last for long periods
  during the dry season (March-June). Practically, a 7-day
  low flow better represents the drought conditions of
  concern and can be used more effectively in water
  management (Jha et al. 2008).
• Smakhtin (2001) concluded that a 7-day period which
  eliminates day-to-day variations of river flow is less
  sensitive to measurement errors, which offer credence
  to the applicability of the 7-day 10-year flow (7Q10)
  FDC approach in the present work.
• The 7Q10 FDC method is the most widely used index in
  the USA, UK and several other countries
Table 2: Results of flow indices in the Brahmani River system
Flow Tilga Gomlai Jenapur
indices Flow rate Flow Flow rate Flow Flow rate Flow
(m3/sec) Volume (m3/sec) Volume (m3/sec) Volume
(Mcum) (Mcum) (Mcum)
Q17 63.5 2002.54 340.0 10722.24 610.0 19237.00
Q40 14.1 444.66 46.9 1479.04 107.0 3374.35
Q50 7.3 230.21 30.5 961.85 66.5 2097.14
Q80 1.3 41.00 12.9 406.81 20.3 640.18
Q90 0.8 25.23 10.3 324.80 16.5 520.35
Q95 0.0 0.0 9.3 293.28 12.2 384.747Q10 -FDC at Different Station
10000
Tilga
Gomlai
Jenapur
1000
Flow in cumec
100
10
1
0 20 40 60 80 100 120
0.1
% time exceedance
Figure 3: 7Q10 –FDC at different sampling stations of Brahmani RiverPre-and Post-Dam effect
2000
Pre-Dam flow
1800 Post-Dam flow
1600
Mean monthly flow (Cumec)
1400
1200
1000
800
600
400
200
0
November
December
March
June
October
September
May
July
January
February
April
August
Month
Figure 4: Mean monthly flow (pre- and post-Dam construction) at JenapurMinim um flow s
160
1-day m in
7-day m in
140
120
100
Flow in Cumec
80
60
40
20
0
1975 1980 1985 1990 1995 2000 2005
Year
Figure 5: 1-day and 7-day minimum flows at JenapurSTREAM SELF PURIFICATION AND WATER QUALITY IMPROVEMENT
Comparing measured values with the environmental
quality standard value, it is found that nine kinds of
main pollutants are dominant at all the gauging
stations in Brahmani River. They are Bio-chemical
Oxygen Demand (BOD5), Dissolved Oxygen (DO),
Nitrate (NO3), ortho-Phosphate (o-PO3),
Sulphate (SO4), Potassium (K), Chromium (Cr),
Aluminum (Al) and Iron (Fe),. To assess the self
purification capacity of Brahmani River, the study
was carried out in two phases.
Tilga Tilga Gom lai
12 250 10
Conductivity DO BOD
DO BOD 9
Conductivity in micromho/cm
10 200 8
BOD-DO in mg / l
BOD-DO in mg/l
7
8
150 6
6 5
100 4
4
3
50 2
2
1
0 0 0
0.1 1 10 100 1000 0.1 1 10 100 1000 1 10 100 1000 10000
Flow in cum ec Flow in cum ec Flow in cum ec
Gom lai Jenapur Jenapur
450 10 200
Conductivity Conductivity
400 9 DO BOD 180
Conductivity in microhom/cm
Conductivity in micromho/cm
350 8 160
BOD-DO in mg / l
300 7 140
250 6 120
200 5 100
4 80
150
3 60
100
2 40
50
1 20
0
0 0
1 10 100 1000 10000
1 10 100 1000 10000 1 10 100 1000 10000
Flow in cum ec Flow in cum ec Flow in cum ec
Figure 6: Flow Vs Water Quality at two Tilga, Gomlai and JenapurTable 3: EWD for improvement of water quality and self purification
capacity in different reaches of Brahmani River
Sampling EWD for self purification capacity and
station water quality improvement
Class-B to Class-A Class-C to Class -A
Flow rate Flow Flow rate Flow Volume
(m3/sec) Volume (m3/sec) (Mcum)
(Mcum)
Up to Tilga 1.5 47.30 3.0 94.61
Tilga- 19.2 605.49 28.5 898.78
Gomlai
Gomlai- 27.8 876.70 40.1 1264.59
JenapurSEDIMENT TRANSPORTATION AND
FLUSHING• In this study, based on the analysis of river load movement (Song et al. 2006), it is pointed out that EWD should be required to maintain a balanced state of erosion and deposition. Considering a river reach, the main factors that influence sediment erosion and deposition include sediment concentration from the upper reach, sediment transporting capacity and boundary condition (e.g., gradient) characteristics (Liu et al. 2002a).
Flow Vs Sediment (total) concentration at Tilga Relationship among sediment concentrations at Tilga Flow Vs Sediment (total) concentration at Gomlai
10
10 10
(Coarse+Medium )
Coarse, medium and find sediment
Fine sedim ent
concentration (grams/litre /day)
Sediment concentration
Sediment concentration
1 1
(grams/litre/day)
1
(grams/litre/day)
0.1 0.1
0.1
0.01 0.01
0.01 0.001 0.001
0.01 0.1 1 10 100 1000 10000 0.001 0.01 0.1 1 10 1 10 100 1000 10000 100000
Flow in cumec Total sediment concentration (grams/litre/day) Flow in cumec
Relationship among sediment concentrations at Gomlai Relationship among sediment concentrations at Jenapur
Flow Vs Sediment (total) concentration at Jenapur
10 10 10
(Coarse+Medium ) (Coarse+Medium )
Fine sedim ent Fine sedim ent
Coarse, medium and find sediment
Coarse, medium and find sediment
concentration (grams/litre /day)
concentration (grams/litre /day)
Sediment concentration
1 1 1
(grams/litre/day)
0.1 0.1 0.1
0.01 0.01
0.01
0.001 0.001
0.001
1 10 100 1000 10000 100000 0.001 0.01 0.1 1 10
0.001 0.01 0.1 1 10
Flow in cumec Total sediment concentration (grams/litre/day)
Total sediment concentration (grams/litre/day)
Figure 7: Flow and sediment concentrations (Coarse, Medium, Fine) relationshipTable 4: EWD for sediment transport and flushing
Station Average Sediment EWD for sediment
sediment yield transport and flushing
transport (Kg/sec)
capacity
Flow rate Flow
(Kg/m3)
(m3/sec) Volume
(Mcum)
up to Tilga 0.6 77 128.60 4055.53
Tilga-Gomlai 0.37 280 749.14 23624.88
Gomlai- 0.26 276 1062.20 33497.54
JenapurSEEPAGE LOSSES
• For the part of Brahmani River in upper
  reaches, ground water has been exploited
  and part of which comes from in-stream flow.
  This amount of water can be regarded as
  EWD for channel seepage and can be
  estimated by Darcy’s law
Table 5: EWD for seepage losses

Station        Hydraulic Hydrauli Cross-     EWD for Seepage
               conductiv    c     section         losses
                  ity    gradient al area
                                          Flow rate Flow
                (m/sec)              of
                                          (m3/sec)    Volume
                                  stream
                                                      (Mcum)
                                   (m2)

up to Tilga      0.3       0.02     62       0.62      11.73
Tilga-Gomlai     0.1       0.01     130      0.16       4.1
Gomlai-          0.1      0.005     320      0.16      5.05
Jenapur
EVAPORATION LOSSES
• EWD for channel evaporation was
  determined estimated by the formula given
  by Song et al., 2006
Table 6: EWD for evaporation losses

Station      Averag     Length Channel Time         EWD for
             e width      from  evaporat (sec) evaporation losses
                of      upper      ion
             surface   reach to capacity       Flow     rate Flow
              water      lower   (mm)          (m3/sec)      Volu
               (m)       reach                               me
                         (Km)                                (Mcu
                                                             m)
up      to     10          115    0.10    420      0.27       6.51
Tilga
Tilga-         25        125      0.10     480       0.65    20.50
Gomlai
Gomlai-        50        110      0.10     480       1.04    32.79
Jenapur
COMPUTATION OF TOTAL
ENVIRONMENTAL WATER DEMAND
EWDtotal MaxEWDaquatic, EWDwaterqquality, EWDsediment
EWDseepage EWDevaporation Table 7: Volume of EWD required for different purposes
Station Up to Tilga Tilga- EWD total
Gomlai
EWD aquatic (Mcum/year) 25.23 324.82 520.34
(1.07%MAF) (2.38%MAF (2.51%MAF)
)
EWD water quality 94.61 898.78 1264.59
(Mcum/year) (3.99%MAF) (6.59%MAF (6.1%MAF)
)
EWD sediment (Mcum/year) 4055.53 23624.88 33497.54
& (171.23%M (173.14%M (161.64%MA
EWD sediment AF) AF) F)
(Mcum/month) 333.33 1941.77 2753.22
(14.07%MA (14.23%M (13.29%MAF
F) AF) )
EWD seepage (Mcum/year) 11.73 4.1 5.05
(0.83%MAF) (0.09%MAF (0.05%MAF)
)
EWD evaporation 6.51 20.50 32.79
(Mcum/year) (0.55%MAF) (0.23%MAF (0.26%MAF)Thank you Prof. Ramakar Jha, Ph.D. Professor, Department of Civil Engineering NIT Rourkela, Orissa rjha43@gmail.com Cell: +91 9439107366
You can also read