A Time to Act COVID-19 Academic Slide in New Jersey Fall 2020 - Winter 2021 - JerseyCAN
←
→
Page content transcription
If your browser does not render page correctly, please read the page content below
A Time to Act COVID-19 Academic Slide in New Jersey Fall 2020 - Winter 2021
Executive Summary

New Jersey was one of the earliest states hit by COVID-19 (hereinafter COVID), forcing all schools in our State to be shuttered
from mid-March through June 2020. Now, more than half-way into the 2020-21 school year, some of our largest and
neediest school districts are just welcoming students back to the classroom. With long-standing achievement gaps across
our state and a digital divide that persisted for too long in New Jersey, COVID has the potential to drastically exacerbate the
educational inequities in New Jersey for an entire generation of students. This study analyzes lost learning time during the
first-half of the 2020-21 school year to project New Jersey’s COVID slide —how students performed pre-pandemic to how
they will perform due to COVID lost learning—in an effort to support our students’ education recovery.

A Time to Act’s Key Findings
  • Based on estimated academic proficiency on the New Jersey State Learning Assessment (NJSLA), a majority of
    New Jersey’s students in grades 3-8 at the start of the 2020-21 school year were not on grade level due to COVID.
  • More students were pushed off course by Fall 2020 and the COVID slide continued because New Jersey’s students
    achieved less than expected academic growth in the first half of the school year.

                                           Actual NJSLA proficiency vs Expected NJSLA proficiency
                                                                 ELA        Math
                                     100

                                     90

                                     80

                                     70
                Percent Proficient

                                     60

                                     50       58%

                                     40             45%
                                                                  39%
                                     30                                                      34%
                                                                          29%
                                     20
                                                                                                      22%
                                      10

                                      0
                                                 2019             Fall 2020*               Winter 2021*
                                                            *means expected proficiency

      - In English Language Arts (ELA), it is estimated that academic proficiency dropped from 58% of students being
        proficient in Spring 2019 to 39% in Fall 2020 to only 34% of students being proficient by the middle of this
        school year.
      - In Math, it is estimated that academic proficiency dropped from 45% of students being proficient in Spring
        2019 to 29% at the start of the school year to only 22% of students being proficient mid-way through this year.

                                                                                                                                  1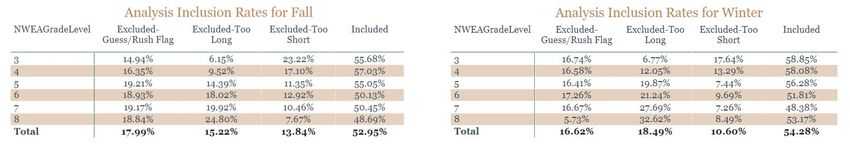
• Our study found that the COVID slide deepened for New Jersey students this year because, on average, students in
  grades 3-8 suffered less than expected growth in the first half of the school year from Fall 2020 to Winter 2021:

                                           Expected Learning Loss         Expected Learning Loss
                 Student Group
                                                  in Math                         in ELA
               New Jersey Students                    36%                            30%
           Economically Disadvantaged                 43%                            37%
            English Language Learners                 33%                            37%
                Students with IEPs                    50%                            44%
                  Black Students                      50%                            43%
                 Latinx Students                      40%                            37%

• Now, only one-third of New Jersey students are expected to be academically proficient in ELA and
  less than one-fourth of our students are expected to be proficient in Math.

                                                                                                                      2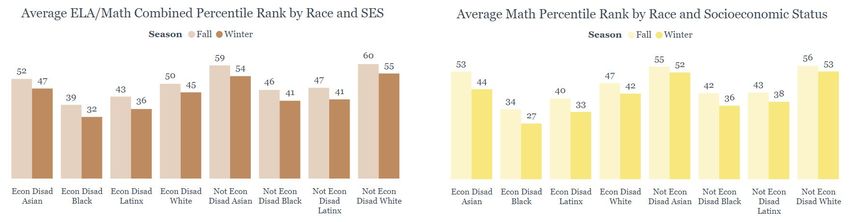
It is no surprise that many students have slipped academically in the months since the start of the pandemic.
Initial research from early in the pandemic forecasted staggering learning loss, particularly for low-income
students. An early analysis by CREDO found that on average in New Jersey, there were at least 58 days of
learning lost in reading and over 174 days lost in Math in Spring 2020. Furthermore, school closures eliminated
other critical aspects of school beyond academic achievement, including critical social, emotional and economic
support systems. According to a recent report from McKinsey, these academic, social and emotional gaps will
have long-term economic impacts on students, estimating that the average US K-12 student will lose $61,000 to
$82,000 in lifetime earnings, or an entire years’ salary, due to the learning gaps exacerbated by COVID-19. These
estimates are worse for Black and Hispanic students. Altogether, K-12 students are expected to lose $110 billion
in annual earnings due to COVID 19-related school closures, with $98.8 billion of that due to loss of learning and
$11.2 billion due to the increase in high-school dropouts.

Most notably, a Fall 2020 poll of parent perspectives in New Jersey demonstrates that parents are deeply
concerned about their children’s educational and emotional wellbeing during these difficult times. Indeed,
the poll found that New Jersey parents’ top concern was ensuring their child did not fall behind academically.
Parents’ second concern was their child’s social and emotional well being. The poll also uncovered that parents
of color and low-income parents were more likely to say that their child is fully remote learning.

  A Time to Act represents the best information to date about the pandemic’s impact on New
  Jersey student academic achievement. It provides valuable data for our communities to utilize
  when designing solutions to improve hybrid learning and accelerate the academic and
  social-emotional recovery of students, particularly those who were already the most at risk
  of academic failure.

                                                                                                                     3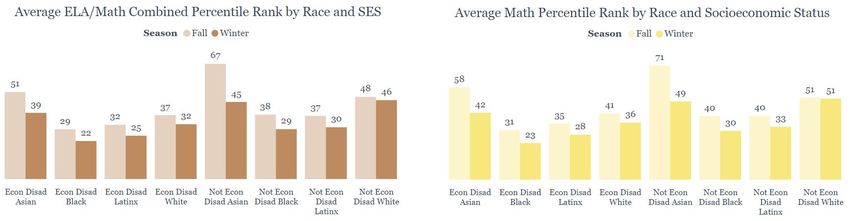
About This Report

This report highlights the COVID academic slide in New Jersey to support further conversations
about education recovery—to get students back on track and to continue to close achievement and
opportunity gaps in New Jersey. It looks at the lost student learning time that has occurred during the first-half
of the 2020-21 school year for students in grades 3-8 to see the impact of COVID on student learning. Knowing that lost
learning time will continue to affect student proficiency, this report also projects how New Jersey students would perform
on a Spring statewide assessment—the New Jersey Student Learning Assessment (NJSLA)—if NJSLA were administered
in Spring 2021. Our dataset includes more than 18,000 students in grades 3-8, cross-sector with Fall 2020 and Winter
2021 assessment data from 15 New Jersey school districts and public charter schools across New Jersey. JerseyCAN thanks
the participant school districts for their data, EmpowerK12 for their rigorous data analysis and the New Jersey Children’s
Foundation for funding this report.

About the Assessments Utilized in this Report

This section contains information about the two assessments we received from schools: NWEA Measures of Academic
Progress (MAP) and i-Ready Diagnostic.

NWEA Measures of Academic Progress (MAP) measures what students know and what they’re ready to learn
next. By dynamically adjusting to each student’s performance, MAP Growth creates a personalized assessment experience
that accurately measures performance—whether a student performs on, above, or below grade level. MAP Growth reveals
how much growth has occurred between testing events and, when combined with our norms, shows projected proficiency.

i-Ready Diagnostic (i-Ready) is an adaptive assessment designed to provide teachers with actionable insight into
student needs. It offers a complete picture of student performance and growth. By adapting to student responses and
assessing a broad range of skills—including skills above and below a student’s chronological grade—the i‑Ready Diagnostic
pinpoints student ability level, identifies the specific skills students need to learn to accelerate their growth, and charts a
personalized learning path for each student.

About the Organizations Supporting this Report

               JerseyCAN: The New Jersey Campaign for Achievement Now is a nonprofit organization that
               advocates for all students across the state to have access to high-quality schools. We work to improve
               policies and programs to support equity and excellence in New Jersey education.

               EmpowerK12 is a nonprofit specializing in education data systems, strategic analysis and research
               and improvement science best practices that translate data into action. The organization released a
               similar study of Fall COVID slide data for the District of Columbia in December 2020.

               The New Jersey Children’s Foundation is a nonprofit organization aimed at promoting a fact-
               based discussion about public education in New Jersey. Its mission is to invest in people, programs
               and partnerships that will improve public education systems by putting the interests of children first.

                                                                                                                              4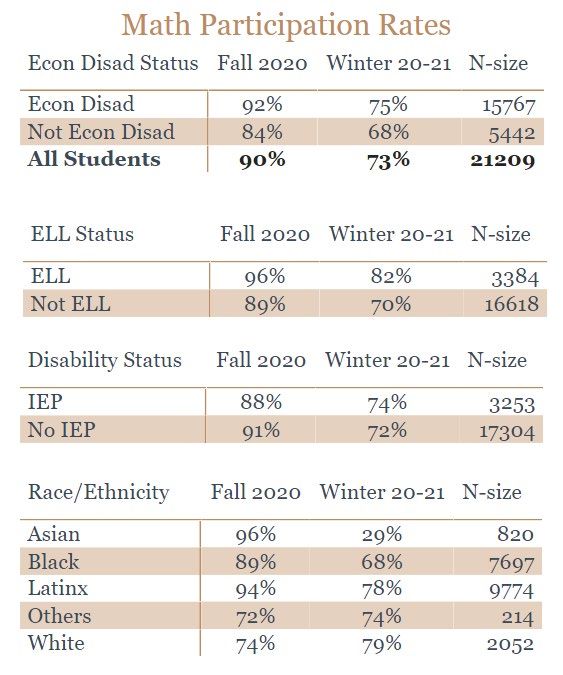
Study Context: How COVID has Impacted New Jersey Education

To fully understand the Fall baseline assessment data and the estimated changes in outcomes illuminated by this
report, we must step back and understand the pandemic’s toll on economic and social-emotional welfare of New Jersey
students and families.

What Happened with New Jersey Schools when the Pandemic Reached the US in March

The Spring 2020 school closures and stay-at-home orders in response to the coronavirus outbreak brought unprecedented
changes in New Jersey during the 2019-20 school year. With little time to prepare, students, families and educators shifted
to distance learning, adopting new models of instruction and learning tools. As learning moved to a virtual space, existing
differences in academic achievement, language fluency and ability, as well as inequalities in technology, internet access,
income and other resources, were amplified. This sparked concern about widening achievement gaps and altered social-
emotional well-being, in addition to health and financial concerns related to the pandemic.

The start of the 2020-21 school year brought an inconsistent delivery of education across the state, with some students
returning full-time to the classroom, some students hybrid and other students learning fully remote. An October 2020 poll
conducted by Global Strategy Group for JerseyCAN and the New Jersey Children’s Foundation found that in Fall 2020,
52% of all parents said that they had at least one child participating in remote learning full-time. However, when we looked
at this in more detail, 70% percent of Black parents, 61% of Latinx parents and 72% of low-income families said that their
child was remote learning full-time. Low-income parents (56%) and parents of color were also less likely to report having the
option of hybrid learning when compared to their White (76%) or more affluent peers (73%). These notable differences in
the options presented to students during the pandemic appear to reflect the fact that COVID had a disproportionate impact
on low-income communities and communities of color.

Now, with vaccine availability having been expanded to educators in New Jersey, many large urban districts have plans to
bring students back into classrooms. Recent CDC guidance reducing the spacing between student desks from six feet to
three feet should also allow for more students to receive in-person instruction for more time each week. With the ability
to bring more of our students back into our schools for learning, now is the time to understand where
they are academically and embark on implementing research-based, proven strategies to get them back
on track.

COVID Academic Slide Analysis Methodology

Using data from more than 18,000 students in grades 3-8 from public schools across the state that completed the NWEA
MAP Growth and i-Ready Diagnostic this past Fall and Winter, we examined three primary research questions:

  1. How has student academic growth changed since schools shifted to distance learning due to the pandemic?
  2. Based on the 2020-21 achievement data, how many students are on-track to score proficient on the NJSLA this Spring?
  3. Do results differ between student demographic groups?

There are multiple ways to analyze the data using different metrics that have contrasting nuanced interpretations addressing
the central research questions. We focus on the following metric types:

  • Percent of typical Fall-to-Winter growth met. Both NWEA MAP and i-Ready provide students with a nationally-
    normed “expected growth” value based on how they performed in Fall. Normally, the average New Jersey student
    earns as much growth as expected, attaining 100% of the growth target. We analyze how that growth is different this
    year, and then translate those differences into months of instructional based on a 5-month academic half year.
  • On-track for NJSLA proficiency. We examine the percent of sample students whose Fall and Winter NWEA MAP
    scores put them on-track to earning NJSLA proficiency this Spring. NWEA produced a study showing strong links
    between MAP scores and NJSLA scores. Since our sample districts serve a different demographic makeup than the
    state overall, we applied rigorous mathematical controls to ensure estimates were reflective of all New Jersey.
  • Average national percentile rank changes. Fall national studies focused on change in average percentile
    rank from last year to this year. Essentially, they compared how Fall scores would have ranked in the pre-COVID
    2019-20 school year. We also analyze changes in percentile rank for key student groups.

                                                                                                                                5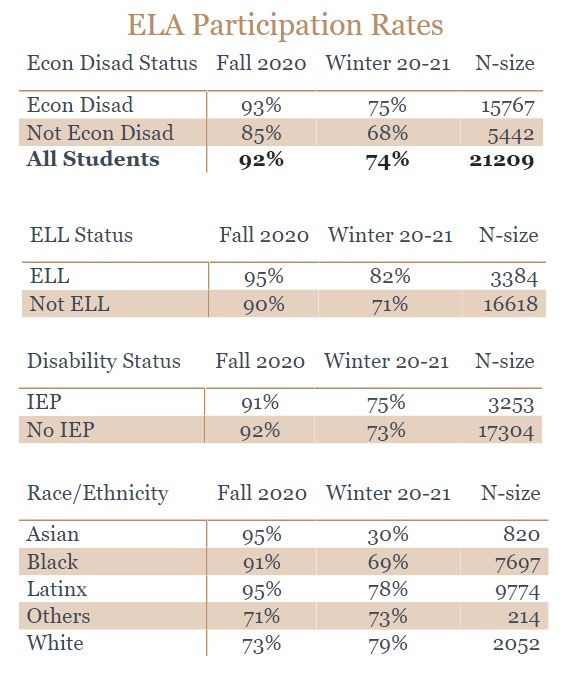
This year’s test administration windows were unlike any other with nearly all students completing baseline assessments
independently from home. Very few students in our sample completed their assessment in-person at school. Given
the uniqueness of testing from home, we rigorously analyzed test participation data as well as test characteristic data
provided by vendors, including length of time taken and rapid guessing rates throughout the assessment. Our goal was
to identify and narrow the sample down to a group of students whose test characteristics were reflective
of a valid and reliable administration like most of the regular in-person tests taken at school.

About the Study Sample and Participation
We received Fall and Winter 2020-21 assessment data for more than
18,000 students from 15 school districts across the state. Since our sample
demographics and historical academic performance by race, disability
status, English learner status, and socioeconomic status differ slightly
from the state student population, we applied coefficients in our model at
the demographic level (i.e. economically disadvantaged, non-economically
disadvantaged, students with disabilities, students without disabilities,
English learners, non-English learners, Asian, Black, Hispanic/Latino, and
White) to better estimate the impact of COVID at the state level.

Assessment Participation Rates

In NWEA’s Fall 2020 brief, researchers noted that participation in this Fall’s MAP Growth assessment administration window
was lower than normal and not evenly spread among schools serving different demographics for the 4.4 million students.
Across subjects and grades, untested students were disproportionately ethnic/racial minority students, students with lower
achievement in Fall 2019 and students in schools with higher concentrations of socioeconomically-disadvantaged students.

We analyzed the participation data of our New Jersey sample and found similar participation rates but not similar patterns
across student groups. While most students, regardless of demographic status, participated in Fall and Winter assessments
at schools that administered them, approximately one-quarter of students are missing from the Winter data.

                                                                                                                             6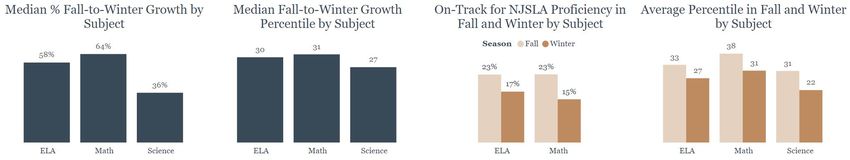
Impact of Remote Administration on Student Test Characteristics
We analyzed test-taking characteristics from MAP and i-Ready to see how these administration challenges might have impacted
the data to help us narrow the student sample to students whose test scores were more likely to represent accurate portrayals of
their skills. Both computer-adaptive assessments provide data on test duration and on the amount of rapid guessing. Students
this Fall tended to take less time to complete their tests from home than the time they normally needed at school. They also
tended to guess more often. Students who took atypical amounts of time and rapidly guessed at different rates demonstrated
growth rates that proved to be significantly different than those students with typical test data. Therefore, our analyses
focus only on students with typical test administration data in Fall and Winter. Graphs and charts for all tested
students, regardless of test characteristics, can be found in the appendix. In the next section of this report, we provide an
aggregate look at the impact of the pandemic on student proficiency and growth.
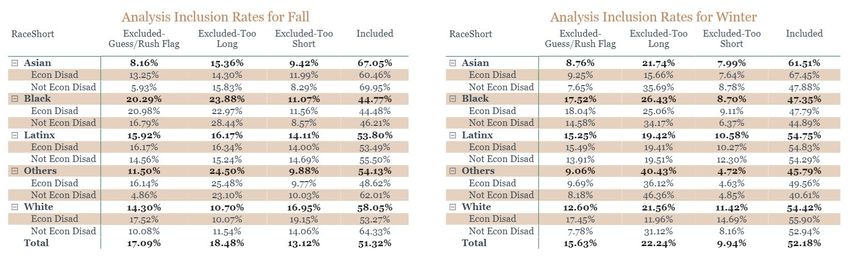
Percent of Student by Time Taken Category and Fall Year
Shorter Than Typical About Typical Longer Than Typical
SY2019-20 6.3% 65.1%2 8.6%
SY2020-21 13.8%6 3.3% 22.9%
Avg Fall-to-Fall Percentile by
Time Taken Category and Fall Year Winter Tests by
Pre-COVID 2016-2019 During COVID 2020-2021 Analysis Inclusion Status
Excluded-Too Long
39.7%
Shorter Than Typical 12%
25.8%
Excluded-Too Short
53.8% 16%
About Typical Included
43.5% 51%
58.4%
Longer Than Typical
55.4% Excluded-Guess/Rush Flag
21%
Avg Fall-to-Fall Growth Percentile
Differences in Prior Achievement between the Sample and the State
When estimating the broader impact of the pandemic on statewide
achievement, we analyzed differences in pre-pandemic proficiency rates
among our sample schools and statewide proficiency by student group.
Differences can lead to over or underestimates of statewide numbers
if they are not accounted for in calculations, so we mathematically
controlled for participating districts’ prior NJSLA achievement to increase
the estimate’s predictive validity.
We find that the average school in our sample had proficiency rates
that were often higher than statewide averages in 2018-19. Since there
is variation in historical proficiency between the sample and state, we
apply mathematical adjustments to model parameters to account for pre-
pandemic achievement differences.
7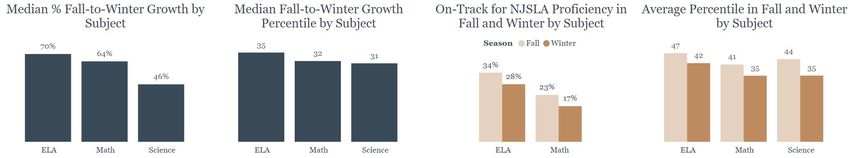
The “COVID slide” impact on NJ students in grades 3-8

Computer-adaptive diagnostic assessments have been utilized by New Jersey schools for many years as a tool to understand
baseline student knowledge as they return from the summer break. The tests allow educators to better understand their
students’ skills regardless of their actual grade level. While these tests have traditionally been administered in school
settings, they are also assessments most easily adapted to remote learning delivery.

The Impact of COVID Slide in Months of Instruction

The computer adaptive assessments also provide expected
Fall-to-Winter growth in terms of scale score points for
each student. These expectations are set by finding the
average growth for students in the same grade starting
with the same baseline score. For example, a sixth grade
student scoring 220 in the Fall is expected to make four
points of growth on the Math test by Winter.

We analyze the aggregate average percent of typical growth
during the first five instructional months of the first half
of the school year to understand how much learning was
actually attained compared to a normal year. Students in
grades 3-8 this Fall lost, on average, 30% of learning in
ELA and 36% of learning in Math.

The academic slide this year brought on by COVID was not
spread evenly across student groups.

Economically Disadvantaged students lost an average of 43% of expected learning in Math and 37% in ELA as compared to
their more affluent peers. English Language learners on average lost 33% of learning in Math and 37% of learning in ELA.
Students with IEPs on average lost 50% of learning in Math and 44% of learning in ELA. New Jersey’s low-income Black
and Latinx students are falling even further behind their peers. Black students lost 50% of expected learning in Math and
43% in ELA. Latinx students lost 40% of learning in Math and 37% in ELA.

                                                                                                                            8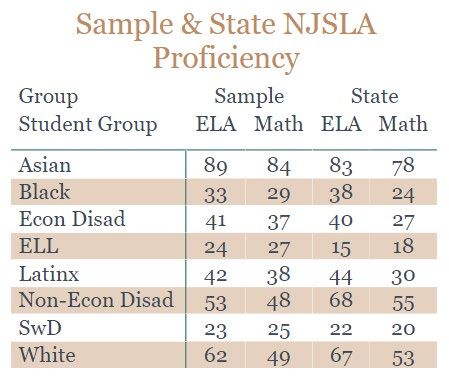
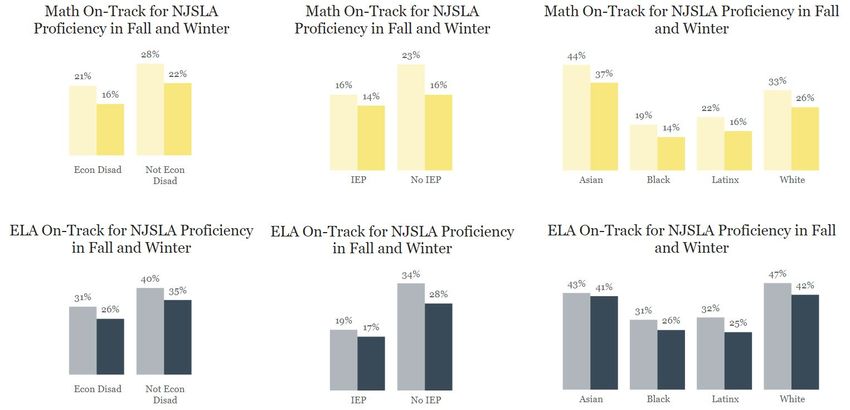
Percent of Students On-Track for NJSLA Proficiency as of this Fall and Winter

MAP results are predictive of NJSLA outcomes. The tests offer similar rigor and are aligned to the Common Core standards
like the NJSLA. NWEA MAP published a linking study that establishes what score students need in the Fall and Winter to be
on-track to achieve NJSLA proficiency by the Spring.

For the statewide NJSLA proficiency estimates, we began by utilizing students
in our sample with typical testing characteristics, applied student group weights
to reflect the state population and added Mathematical coefficients to control for
prior achievement at schools in our sample. Changes in percent on-track
for proficiency for New Jersey’s students are based on the sample’s Fall to
Winter growth data from MAP. Most of the proficiency losses occurred
in Spring and summer at the onset of the pandemic, and New Jersey’s
proficiency drops are similar to anticipated drops projected by national
studies. Most of the proficiency losses occurred in Spring and summer at
the onset of the pandemic.

In Spring 2019, 58% of New Jersey students in grades 3-8 were proficient
in ELA and 45% were proficient in Math. As of this Winter, if students
were to take the NJSLA this Spring for the grade in which they are enrolled,
we expect only 34% would meet or exceed expectations in ELA and only
22% would meet or exceed expectations in Math. This means, in ELA,
New Jersey students may have a 24 percentile point drop in academic
proficiency and a 23 percentile point drop in statewide Math proficiency.
The margin of error in the estimates is approximately 5 percentile points.

Difference in Average Percentiles from Prior Assessment Periods

NWEA’s national brief on COVID slide from the Fall focused on how average student achievement percentiles changed from
Fall 2019 to Fall 2020, utilizing a set of national norms established before the pandemic. This metric provides another way
to see how New Jersey students’ achievement slid compared to a normal school year and compared to a national dataset.
On average, New Jersey students in grades 3-8 with similar test characteristics dropped five to seven percentiles from the
start of the school year to mid-year.

For example, if a student group has an average percentile ranking of 60 from Fall 2019, then that student group outperformed
60% of students nationwide in the same grade on average. An average percentile of 35 in Fall 2020 means that those
students outperform 35% of students in the same group pre-COVID.

Achievement percentile drops differed across student groups in our sample. Students of color, particularly those from
low-income families, tended to have the largest drops in achievement percentile rank. Therefore, one takeaway from this
information is that New Jersey Black and Latinx students, regardless of economic status, have fallen furthest
behind in grade level proficiency.
                                                                                                                               9
Summary of Key Points from Fall and Winter Assessments
Here are our key takeaways from the computer-adaptive diagnostic data:
• Students experienced significant academic slide this Fall, demonstrating academic growth at only 70% of typical
growth from Fall to Winter in ELA, 64% in Math and 46% in science.
• The Fall 2020 to Winter 2021 slide is in addition to the heavy academic loss that occurred between mid-March
2020 and beginning of the year testing in September.
• Nearly two out of every five students who were previously proficient in ELA on the NJSLA are no longer on-track.
• About one out of every two students who were proficient in Math in Spring 2019 are not meeting or exceeding
expectations anymore.
• Economically disadvantaged students are disproportionately more likely to demonstrate learning loss this Fall
and Winter.
Conclusion
A Time to Act is a critically important snapshot of the effect of the pandemic on New Jersey student
learning. As we move into year two of the pandemic, we must act now to stem the COVID slide for
our students and get them back on track. JerseyCAN recommends that stakeholders and policymakers consider the
following solutions to help accelerate student learning for our students.
• Urgently prioritize the adoption and statewide implementation of extensive summer programming so that we
can stem the COVID slide now and further stop more students from falling behind;
• Adopt and implement personalized, research-based solutions for accelerating student learning like high-dosage tutoring;
• Allow parents to exercise their choice to retain or hold back their child, if desired, to provide additional time to
students for learning and the provision of social and emotional supports;
• Incentivize all districts to adopt high-quality instructional materials that are aligned to statewide assessments, which can
provide teachers and parents with ongoing information about student academic growth and that can project proficiency
on NJSLA; and
• Administer statewide assessments in Spring 2022 that are comparable to those administered in Spring 2019 to establish
a new baseline from which to measure student growth moving forward and to also enable comparisons to pre-pandemic
statewide proficiency.
10COVID Academic Slide Analysis Appendices
Additional Assessment Participation Data
Sample Data
11Study Inclusion Status by Demographic and Grade
State Estimates for Students with Typical Test Characteristics
State Estimates for All Students in Sample Regardless of Test Characteristics
12Math: Fall to Winter Median Growth Percentiles
ELA: Fall to Winter Median Growth Percentiles
NJSLA On-Track Rates – for both Math and ELA
13Average Percentile Rank by Subject – Students w/ Good Test Characteristics
Average Percentile Rank by Subject – All Students Regardless of Test Char.
14This study was made possible through the generous support of the New Jersey Children’s Foundation.
You can also read