SURFACE DEFORMATION STUDIES OF TENERIFE ISLAND, SPAIN FROM JOINT GPS-DINSAR OBSERVATIONS
←
→
Page content transcription
If your browser does not render page correctly, please read the page content below
Surface deformation studies of Tenerife Island,
              Spain from joint GPS-DInSAR observations
       Sergey Samsonov*t, Kristy Tiampot, Pablo J. Gonzalez+, Juan Prieto§, Antonio G. Camacho+ and Jose Fernandez+
                    *GNS Science, I Fairway Drive, Avalon, Lower Hutt, New Zealand, Email: s.samsonov@gns.cri.nz
                          tDepartment of Earth Sciences, University of Western Ontario, London, Ontario Canada
                       +Instituto de Astronomfa y Geodesia (CSIC-UCM), Plaza de Ciencias 3, 28040, Madrid, Spain
                 §Dpt. Ingenierfa Topognifica y Cartograffa, RTSI Topograffa, Geodesia y Cartograffa, UPM. Madrid, Spain

          Abstract-This work presents results for the three-dimensional
       displacement field at Tenerife Island calculated from campaign
       GPS and ascending and descending ENVISAT DInSAR inter-
       ferograms. The goal of this work is to provide an example
       of the flexibility of the technique by fusing together new va-
       rieties of geodetic data, and to observe surface deformations
       and study precursors of potential activity in volcanic regions.
       Interferometric processing of ENVISAT data was performed
       with GAMMA software. All possible combinations were used
       to create interferograms and then stacking was used to increase
       signal-to-noise ratio. Decorrelated areas were widely observed,
       particularly for interferograms with large perpendicular baseline
       and large time span. Tropospheric signal was also observed which
       significantly complicated the interpretation. Subsidence signal
       was observed in the NW part of the island and around Mount
       Teide and agreed in some regjons with campaign GPS data. It
       is expected that the technique will provide better results when
       more high quality DInSAR and GPS data is available.

                             I. INTRODUCTION
          Tenerife is the largest of the seven Canary Islands in the       Fig. 1.     The satellite image of the Tener{j'e Island. The Las Canadas
       Canary Archipelago with the surface area of 2034 krn 2 . The        Caldera as well as Teide volcano are well recognizable features on the island.
       island is clearly divided to a very dry southern part and a         Reprinted from ESA web site.
       very humid and vegetated north. Like the rest of the Canary
       Islands, it is of volcanic origin. The last stage of volcanic
       activity started about 500K ago and the last eruption occurred
       in ] 909, The eruptive system of the island is dominated by
       the Las Canadas Caldera and Teide, a 3715-m stratovolcano
       located at the northern border of the caldera which was formed
                                                                           28·30'
       during last 150,000 years (Figs. ]-2). For the past 100 years,
       volcanoes of the central volcanic complex (CYC) on Tenerife
       Island were quiescent, but a recent increase in seismic activity
       around the island [11 as well as diffuse emission of carbon
       dioxide along a zone known as the Santiago Rift [21 and
       increasing fumarolic activity at the summit of Teide volcano        28'15'
       [31 suggest their reawakening.
          In this work we applied a GPS-DInSAR optimization tech-
       nique [41 which combines GPS and DlnSAR data into a time-
       dependent three-dimensional densely spaccd dcformation ficld
       in order to identify local and regional geodetic signals. For       28·00'
       the first time, campaign GPS was used instead of continuous             -17'00'          -16'45'          -16'30'           -16'15'
       GPS data such as in our previous works of southern California
                                                                           Fig. 2. The digital elevation model of the Tenerife Island which is used in
       [51, [61. In this case the accuracy of the campaign GPS             this study. Black dots are the locations of GPS sites.
       observations is significantly lower, but the importance of each
       observation is significantly higher due to the small number of

                                                     1-4244-2547-1/08/$20.00 ©2008 IEEE

Authorized licensed use limited to: UNIVERSITY OF WESTERN ONTARIO. Downloaded on March 29,2010 at 11:41:10 EDT from IEEE Xplore. Restrictions apply.
observations and their targeted location. The lower accuracy 4(d), 4(e) and 4(f). The values of deformation here were
of GPS observation affects the accuracy of the initial model converted to velocities by applying linear regression to the
and, therefore, the accuracy of final GPS-DInSAR model. In 2000-2006 time series in order to make them comparable to
order to compensate for lower accuracy of the GPS data, two the differential InSAR velocity fields used in this technique.
DInSAR images from ascending and descending orbits were However, if required, these velocity fields can be easily con-
used simultaneously in the optimization. verted to deformation fields by multiplication of the timespan.
II. DATA USED IN PREVIOUS AND CURRENT STUDIES C. DlnSAR observations
For the past few decades a number of different studies were 'Differential interferograms were calculated from Synthetic
undertaken in this area in order to find precursors of possible Aperture Radar (SAR) images acquired by the ERS-1/2
volcanic eruptions. In particular, geodetic measurements in satellites starting from 1992. These images cover the whole
the southern part of the caldera using geodetic and leveling island and provide continuous deformation pattern with a high
micronetworks [7] and seismic studies [8], several gravity spatial resolution of approximately 30x30 m and an accuracy
campaign for structural studies [9], [10], [11], temporary better than 1 cm. Unfortunately some areas decorrelate due to
observations of gravimetric tides [12], regular observations of surface changes and different look angles resulting in large
temperature, fumarolic activity and measurements of different perpendicular baseline and, therefore, can not be used for
gases emitted at the top of Teide volcano [13] and diffusive measurement of surface deformation.
degassing in and around the caldera [14]. These observations These studies confirmed that there was no deformation in
have not detected any clear anomaly that could be regarded as
and around the Las Canadas Caldera, coinciding with similar
an indicator of volcanic reactivation in the monitored areas. results obtained from different terrestrial measurements. How-
However, since both historic and recent volcanic activities ever, a few areas of deformation were identified in the north-
are very scattered [15] over the island it was suggested that west comer of the island which coincided with the region of
new techniques covering the whole island need to be used, the last historic eruption [18].
otherwise some anomalies associated with future eruptions
Beginning in 2003, a few scenes became available from
might not be detected on time [16].
ascending and descending passes of ENVISAT satellite (pre-
A. Joint deformation and gravity observations sented in Table I). However, only a few interferometric pairs
with baseline less than 550 meters were successfully un-
Recent GPS and gravity measurement campaigns were un-
wrapped for the whole island and used in this study (Fig 3).
dertaken to measure surface deformation and gravity changes
as precursors of possible volcanic eruptions. The first joint III. THE GPS-DINSAR OPTIMIZATION
deformation-microgravity survey was performed in May 2004,
two weeks after an observed increase in seismic activity, The GPS-DInSAR optimization technique was used to com-
followed by campaigns in July 2004, April 2005 and July bine 2000-2006 campaign GPS and ENVISAT DInSAR data
2005. The network consisted of 14 benchmarks operated with available for Tenerife Island. In general this methodology was
the accuracy of 0.01 mGal and positioned in order to cover similar to that used in our previous works [4], [6], [5], but
an area of approximately 500 km 2 of the central volcanic with some modifications. First of all, GPS data was acquired
complex, including the Pico Viejo - Pico Teide complex, the only at certain times, but not continuously. In total there were
Las Canadas Caldera as well as the Santiago Rift. Within the six GPS campaigns with time intervals of approximately one
accuracy of the measurements, surface uplift was observed year (with one exception in 2003). These observations were
only at four benchmarks [1]. A widespread deformation pattern post-processed in order to account for a precise position of
was not observed by these surveys. the satellites during acquisitions and to remove some common
noise by using differential techniques. The tectonic plate
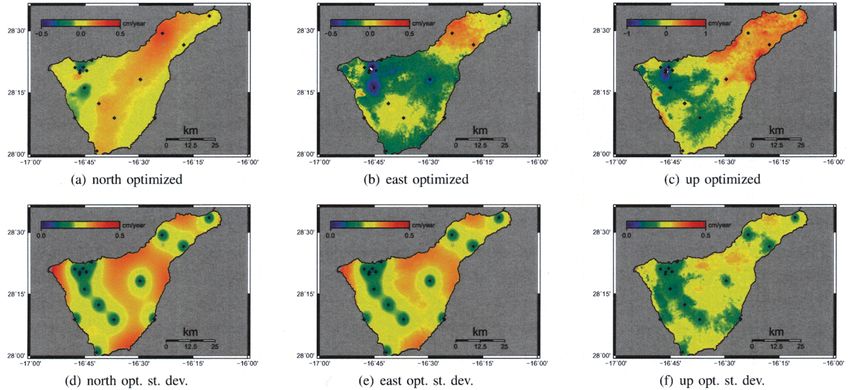
B. Campaign GPS observations velocity, common for all stations, was also subtracted from
The first independent campaign GPS observations were both horizontal components. The time series were created for
performed in 2000 and were consequently repeated every year each component of each GPS site and then this data was used
until 2006, skipping the year of 2003. The GPS observations to calculated velocities of deformations by applying linear
were performed using geodetic double frequency receivers regression.
installed for a period of 2-5 hours (depending on the baseline Ordinary kriging interpolation method was used to calculate
length) in 2000, and for more than 6 hours in the later initial continuous velocity maps and corresponding errors with
campaigns, independent of the baseline length. The collected the same geocoding and resolution (3 sec) as differential
data was processed using Bernese software [17] with precise InSAR interferograms. Gamma ISP and DIFF/GEO software
ephemerides. Precision obtained during the survey was of the packages were used to calculate differential interferograms
order of a few mm for horizontal components, and slightly from SLC data. SRTM digital elevation model was used to
less than 1 cm for the vertical component. Results for the remove the topographic phase and precise baselines were cal-
interpolation of these measurements by ordinary kriging are culated by estimating local fringe rate using two-dimensional
presented in Figs. 4(a), 4(b) and 4(c) with corresponding errors FFf transform and refined using least-squares estimations
Authorized licensed use limited to: UNIVERSITY OF WESTERN ONTARIO. Downloaded on March 29,2010 at 11:41:10 EDT from IEEE Xplore. Restrictions apply.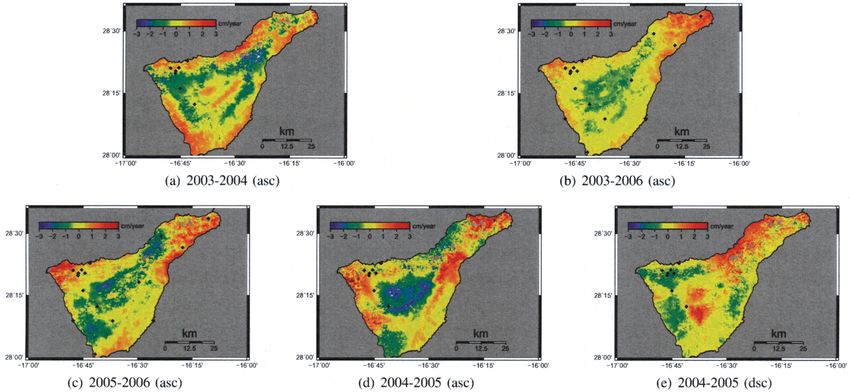
(a) 2003-2004 (ase)                                                    (b) 2003-2006 (asc)

                   (c) 2005-2006 (ase)                                (d) 2004-2005 (asc)                                  (e) 2004-2005 (dsc)

  Fig. 3. Ascending and descending stacks   (~l ENVISAT   interferograms   (~l   Tenerive Island. The time span is shown above, black diamonds are campaign GPS
  sites for corresponding time periods.

                                                                                 TABLE I
  Df/Jerential inteiferograms used in this study. Ascending intelj'erograms are grouped in three partial stacks ~panning approximately 2003-2004, 2004-2005,
                            2005-2006. Also two complete stacks were calculated: ascending 2003-2006 and descending 2004-2005.

                             Ascending           Time span in days      Bp, m              Descending        Time span in days    Bp, m
                         20030907-20040613              281                 25         20040611-20050527            350            -377
                         20030907-20050320              562                 147        20040611-20050701            386             384
                                                                                       20040611-20050909            452            -536
                         20040613-20050320                281               122        20050527-20050909            102             324
                         20040613-20050703                383              -275        20050527-20051014            138              67
                         20050213-20050807                175               259        20050527-20051118            171             351
                         20050320-20050703                102               163        20050527-20051223            208             144
                         20050424-20050703                 69               309        20050701-20050909             65            -437
                                                                                       20050805-20050909             32             514
                         20050213-20060129                350               -87        20050805-20051223            138             334
                         20050213-20060305                386               104        20050909-20051014             36            -254
                         20050529-20060129                244              -347        20050909-20051118             69              27
                         20050807-20060129                175              -156        20050909-20051223            105            -180
                         20050807-20060305                211               210        20051014-20051118             32             281
                         20060129-20060305                 36               191        20051014-20051223             69              74
                                                                                       20051118-20051223             36            -206

                                                                                 TABLE II
  Four optimization runs performed for d~nerent time~pans that were analyzed in this work. Five inteiferometric stacks were calculated: Ai (2 interjerograms)
                                  2003-2004, A2 (5) 2004-2005, A3 (6) 2005-2006, A4 (14) 2003-2006, D (16) 2004-2005.

                                  Run     Time period     Asc. pair    Dsc. pair         GPS time span     Num. of GPS stations
                                   1       2003-2004            Al                      2002.65-2004.48             7
                                   2       2004-2005            A2           D          2004.48-2005.57             8
                                   3       2005-2006            A3                      2005.57-2006.13            16
                                   4       2003-2006            A4           D          2002.65-2006.13            16

 based on the ground control point data. All possible master-                          than 550 meters were selected and used in this study (Table
 slave configuration of SAR data with perpendicular baseline                           I).
 less than 700 meters were processed but only 13 ascending and
 16 descending interferograms with perpendicular baseline less                           Four ascending 3(a), 3(b), 3(c), 3(d) and one descending
                                                                                       3(e) interferometric stacks were calculated from processed

Authorized licensed use limited to: UNIVERSITY OF WESTERN ONTARIO. Downloaded on March 29,2010 at 11:41:10 EDT from IEEE Xplore. Restrictions apply.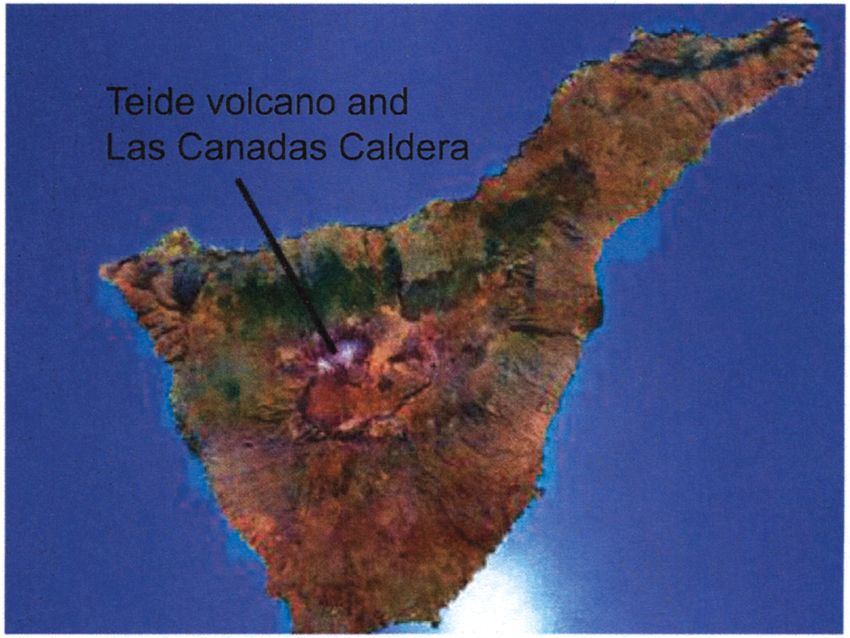
(a) north                                       (b) east                                         (c) up

                    (d) north st. dev.                              (e) east st. dev.                                 (t) up st. dev.

  Fig. 4. Interpolated by ordinary kriging GPS velocities calculated from 2000-2006 campaign GPS time series applying linear regression. Black diamonds
  are location of GPS sites.

  DInSAR data in order to increase signal to noise ratio and to                velocities did not reveal any particular variogram trend and an
  reduce the contribution from atmospheric noise. Stacking was                 exponential variogram model was chosen as an initial model
  performed by setting a spatial reference point and multiple                  for interpolation. Such behavior possibly can be explained by
  reference points were tested and no significant differences                  the complexity of ground deformations occurring on the island,
  were observed. The RMS errors were also calculated for each                  and suggests that a denser GPS network is required.
  stack (not presented here due to space limitation) which then                   The optimized velocity maps that were calculated using
  were used as a weighting terms in the optimization. The                      GPS data acquired between 2000 and 2006 and both, as-
  synthetic interferograms calculated from interpolated GPS data               cending and descending stacks, are presented on Figs 5(a),
  were used to adjust static shifts of the DInSAR stacks.                      5(b), 5(c) with corresponding errors 5(d), 5(e) and 5(£). In
     Four optimization runs were performed for this region,                    comparison to the original velocity maps derived from GPS
  which are summarized in Table II. First and third runs used                  data alone, the optimized velocity maps are not as smooth but
  only ascending stacks and the second and fourth runs used                    the degree of changes affecting each component varies. This
  both, ascending and descending stacks. In this paper only                    happens because InSAR is particularly sensitive to vertical
  displacements from the fourth run are presented on the Fig                   motion (incidence angle is approximately 20 degrees) and,
  5 due to space limitation. This run was chosen because it                    therefore, the InSAR contribution to the vertical velocity map
  utilizes all GPS data from 2000 until 2006 and all ascending                 is maximum during the optimization. The contribution to hori-
  and descending interferograms, combined in two stacks. The                   zontal components depends on the azimuth of the satellite and
  GPS coverage of some of the campaigns concentrated around                    in this case is moderate for eastern and minimal for northern
  the NW part of the island, and therefore the accuracy of the                 component. Another factor affecting the degree of change is
  final velocity fields is the highest in this area.                           the initial accuracy of GPS data. Because the accuracy of GPS
                                                                               vertical component is lower than the accuracy of horizontal
                   IV.   RESULTS AND DISCUSSION                                components it is weighted lower during the optimization.
     Analysis of individual interferograms and interferometric                    The subsidence with a rate of a few mm/year is observed on
  stacks (Fig 3) suggests that some signal in the central part                 both initial and optimized velocity maps in the NW comer of
  of the island correlates with the topography. It is anticipated              the island and some signal in the same region is observed on
  that this signal could be caused by the water vapor noise from               eastern component as well. It was discovered in previous work
  clouds and fog rather than errors in digital elevation model                 that at least some part of this subsidence is driven by extraction
  used for removing topography. However, the possibility of                    of groundwater, however, it is not observed on interferometric
  ground deformations caused by volcanic activities (or thermo                 stacks used in this work. The possible explanation of this
  elastic effects) can not be completely eliminated at this time.              behavior is that it is related to a seasonal fluctuation of
     The ordinary kriging technique used for interpolation of                  the groundwater levels and the long term subsidence trend
  initial GPS velocities significantly depends on the type of the              reverses during rainy seasons when aquifers get recharged.
  variogram model. In this work the variogram analysis of GPS                  This was confinned by observing subsidence signal on some

Authorized licensed use limited to: UNIVERSITY OF WESTERN ONTARIO. Downloaded on March 29,2010 at 11:41:10 EDT from IEEE Xplore. Restrictions apply.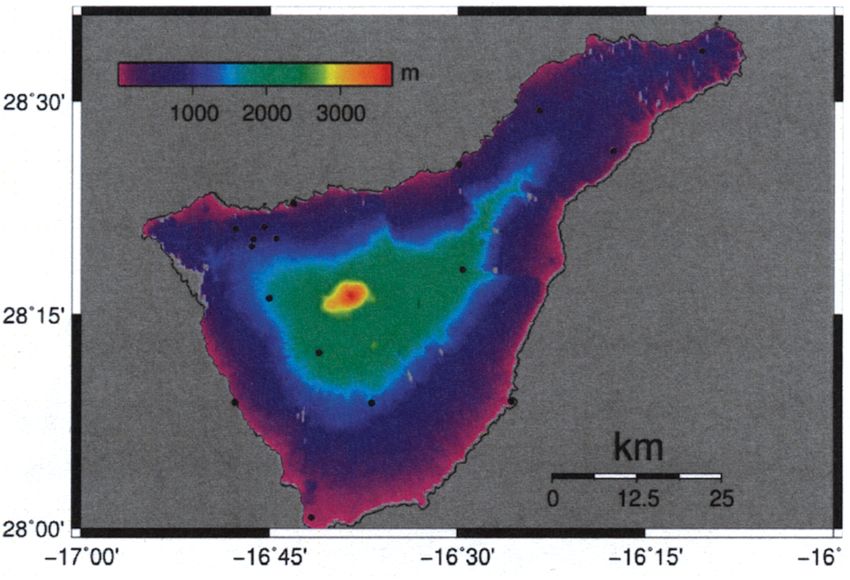
(a) north optimized                                (b) east optimized                                   (c) up optimized

                  (d) north opt. st. dev.                            (e) east opt. st. dev.                               (f) up opt. st. dev.

  Fig. 5. Velocity maps with corresponding errors calculated from 2000-2006 time series and ascending and descending inteiferometric stacks using GPS-
  DlnSAR optimization. Black diamonds are location of GPS sites.

  interferograms that were used for stacking.                                      l2J N. Perez, "Premonitory geochemical and geophysical signatures of
     Additional signals were observed on optimized velocity                             volcanic unrest in tenerife, canary islands," in Geophysical Research
                                                                                        Abstracts, 7, Abstract 09993, sref-id:EGU05-A-09993, 2005.
  maps and currently are being analyzed. These are not dis-                         l3J A. Garcia, J. Vila, R. Ortiz, R. Marcia, R. Sleeman, 1. Marrero,
  cussed here due to space limitations.                                                 N. Sanchez, M. Tarraga, and A. Correig, "Monitoring the reawakaning
                                                                                        of the Canary Islands Teide volcano," Eos Trans. AGU, vol. 87, no. 6,
                             V.   CONCLUSION                                            p. 61, 2006.
                                                                                    l4J S. Samsonov and K. Tiampo, "Analytical optimization of DInSAR
     As discussed in this work, a new GPS-DInSAR optimization                           and GPS dataset for derivation of three-dimensional surface motion,"
  technique was used to combine 2000-2006 campaign GPS time                             Geoscience and remote sensing letters, vol. 3, no. 1, pp. 107-111,2006.
  series and ascending and descending interferometric stacks                        l5J S. Samsonov, K. Tiampo, and 1. Rundle, "Application of DInSAR-
                                                                                        GPS optimization for derivation of three dimensional surface motion
  acquired by ENVISAT during approximately the same time.                               of southern California region along the San Andreas fault," Computers
  This technique illustrates a methodology that can combine                             and Geoscienses, vol. 34, no. 5, pp. 503-514, 2008.
  various types of geodetic data into time-dependent densely                        l6J S. Samsonov, K. Tiampo, 1. Rundle, and Z. Li, "Application of DInSAR-
                                                                                        GPS optimization for derivation of fine scale surface motion maps of
  spaced three-dimensional deformation field in order to identify                       southern California," Transactions on geoscience and remote sensing,
  local and regional geodetic signals. The technique can be                             vol. 45, no. 2, pp. 512-521, 2007.
  expanded by adding other sorts of data such as LIDAR and                          l7J M. Sevilla and F. Sanchez, "Geodetic network for deformation monitor-
                                                                                        ing in the Caldera of Teide. The European laboratory volcanoes," in In
  leveling. Analysis of results revealed the complexity of GPS
                                                                                        proceedings (~l the second workshop European Commission, R. Casale,
  and DInSAR observations on Tenerife Island. For example,                              Ed., 1996, pp. 615-636.
  some subsidence signal in the NW comer of the island was                          l8J J. Almendros, J. Ibanez, G. Alguacil, J. Morales, E. Del Pezzo,
  observed only by GPS, while other signal in the center of the                         M. La Rocca, R. Ortiz, V. Arana, and M. Blanco, "A double seismic
                                                                                        antenna experiment at Teide volcano: existance of local seismicity and
  island was observed only by DInSAR.                                                   lack of evidences of volcanic tremor." J. vhl. Geothenn. Res., vol. 103,
                                                                                        pp. 439-462. 2000.
                          ACKNOWLEDGMENT                                            19J R. Vieira, C. Toro, and V. Arana, "Microgravimetric survey in the
                                                                                        Caldera of Teide, Tenerife, Canary Islands," Tectonophysics, vol. 130,
    This research was partially supported by the GEOMOD                                 pp. 249-257, 1986.
  project (CGL2005-05500-C02). The ENVISAT precise orbits                         l10J G. Ablay and P Kerry, "Gravity constraints on the structure and volcanic
  used in this work were provided by Delft University of                                evolution of Tenerife, Canary Islands," Journal of Geophysical Research,
                                                                                        vol. 105, pp. 5783-5796, 2000.
  Technology and the images were plotted with the help of GMT
                                                                                  III J v. Arana, A. Camacho, F. Garcia, A. Montesinos, I. Blanco, R. Vieira,
  software developed and supported by Paul Wessel and Walter                            and A. Felpeto, "Internal structure of Tenerife (Canary Islands) based on
  H. F. Smith. The work of KFf was accomplished under an                                gravity aeromagnetic and volcanological data," 1. Vol. Geothenn. Res.,
  NSERC Discovery Grant.                                                                vol. 103, pp. 43-64, 2000.
                                                                                  ll2J J. Arnoso, J. Fernandez, R. Vieire, E. Velez, and A. Venedikov, "Results
                               REFERENCES                                               of tidal observations in Tenerife, Canary Islands," Mar. Terr. Bull. Inf,
                                                                                        vol. 132, pp. 10283-10290, 2000.
   II J J. Gottsman, L. Woller, J. Marti, J. Fernandez, A. Camacho, and P Gon-    [13] 1. Salazar, N. Perez, and H. P. "Secular variations of soil C02 flux
        zalez, "New evidence for reawakening of Teide volcano," Geophysical             levels at the summit cone of Teide volcano, Tenerife, Canary Islands,"
        Research Letters, vol. 33. p. L20311, 2006.                                     EOS Trans., AGU, vol. 81, p. 48, 2000.

Authorized licensed use limited to: UNIVERSITY OF WESTERN ONTARIO. Downloaded on March 29,2010 at 11:41:10 EDT from IEEE Xplore. Restrictions apply.
[14] P. Hernandez, N. Perez, J. Salazar, M. Sato, K. Notsu, and H. Wakita,
"Soil gas C02, CH4, and H2 distibution in and around Las Canadas
Caldera, Tenerife, Canary Islands, Spain," J. Vol. Geotherm. Res., vol.
103, pp. 425-438, 2000.
[15] J. Fernandez, T. Yu, G. Rodrigez-Velasco, 1. Gonzalez-Matesanz,
R. Romero, G. Rodriguez, R. Quiros, A. Dalda, A. Aparico, and
M. Blanco, "Neo geodetic monitoring system in the volcanic island of
Tenerife, Canaries, Spain. combination of InSAR and GPS techniques,"
J. Vol. Geotherm. Res., vol. 124, pp. 241-253, 2003.
[16] T. Yu, J. Fernandez, C. Tseng, M. Sevilla, and V. Arana, "Sensitivity test
of the geodetic network in Las Canadas Caldera, Tenerife for volcano
monitoring," J. Vol. Geotherm. Res., vol. 103, pp. 393-407, 2000.
[17] U. (edited by ) Hugentobler, S. Schaer, and P. Fridez, "Bernese GPS
software version 4.2," Astronomical institute, University of Berne,
Switzerland, 2001.
[18] J. Fernandez, R. Romero, K. Carrasco, D. TiamPO, G. Rodriguez-
Velasco, A. Aparicio, V. Arana, and F. Gonzalez-Matesanz, "Detection
of displacements on Tenerife Island, Canaries, using radar interferome-
try," Geophysical Journal International, vol. 160, pp. 33-45, 2005.
Authorized licensed use limited to: UNIVERSITY OF WESTERN ONTARIO. Downloaded on March 29,2010 at 11:41:10 EDT from IEEE Xplore. Restrictions apply.You can also read