Water quality, fertility, fish culture carrying capacity of Riam Kanan Reservoir, South Kalimantan Province
←
→
Page content transcription
If your browser does not render page correctly, please read the page content below
Water quality, fertility, fish culture carrying
capacity of Riam Kanan Reservoir, South
Kalimantan Province
1
 Muhammad Nur, 2Muhammad A. Rifa’i, 2Rizmi Yunita, 2Leila Ariyani Sofia
1
  Doctorate Program of Agricultural Science, Lambung Mangkurat University, Banjarbaru,
   South Kalimantan, Indonesia; 2 Faculty of Fisheries and Marine Science, Lambung
 Mangkurat University, Banjarbaru, South Kalimantan, Indonesia. Corresponding author:
                              M. Nur, nur@mhs.ulm.ac.id

       Abstract. Fish cultivation in Riam Kanan Resevoir has well developed based on the floating fish cage
       production development in the last few years. However, this development, if not controlled, will exceed
       the reservoir carrying capacity and can result problems in relation with degradation of water quality and
       its trophic status. This study was aimed at analyzing the water quality condition, the trophic status, and
       the fish cage culture carrying capacity in Riam Kanan reservoir. This study was carried out for 5 months,
       from May to September 2019. It applied field survey method to gather the water quality data. Water
       sample sites were pusposely selected as many as 7 stations, and water quality measurements were
       conducted 3 times at 2-month interval. There were 16 parameters measured, temperature,
       transparency, turbidity, TDS, TSS, pH, DO, TP, TN, NH3-N, free NH3, BOD, COD, NO3, NO2, and
       chlorophyll-a. Results revealed that water quality of Riam Kanan Reservoir was categorized as
       moderately polluted with mesotrophic fertility status. The capacity of total phosphorus load was 137.3
       ton yr-1. Riam Kanan Reservoir has recently an excessive load of TP as much as 89.3 ton yr-1 that is
       equivalent to excessive fish production of 5,030 ton yr-1. The recommended fish culture production is
       3,925 ton yr-1 or equivalent to 1,869 plots of floating fish cage.
       Key words: water quality status, trophic status, fish production, floating fish cage.

Introduction. Riam Kanan Reservoir is the largest reservoir in South Kalimantan
Province     that has multifunctions, such as hydropower plant, irrigation, source of
standard water, tourism object, water transportation media, fisheries, and aquaculture
(RDBPW 1995; SCBR 2016a, 2016b, 2016c). Riam Kanan Reservoir is one of the fish
culture center using the floating fish cage system. Fish culture production in this area
contributes 40% of total floating fish cage production in Banjar Regency (SCBR 2019b).
        In line with need development for human food, fish culture has developed fast
including fish culture using the floating fish cage (FFC) system. Fish production from FFC
system in Banjar Regency has significantly increased from 1,116 ton in 2006 to 11,364.8
ton in 2018 (SCBR 2007, 2019b).
        The development of floating fish cage culture in Riam Kanan Reservoir has given
positive impact to business opportunity and job opportunity for people around the
reservoir (Soendjoto et al 2009; SCBR 2009). Floating fish cage culture business in Riam
Kanan Reservoir is source of income for 425 fisheries households with revenue-cost (R/C)
ratio of 1.12 meaning that the business is feasible (Nur et al 2020a, b). Besides positive
impact, the FFC culture development is also potential to give negative impact on the
aquatic environment since the waste produced will rise. FFC culture yields some wastes,
such as uneaten feed, feces, and metabolites that are potential to contaminate the
aquatic environment (Shakouri 2003; Yusuf et al 2011). Pollution can occur if the fish
culture exceeds the carrying capacity of the aquatic environment. Problems of excessive
carrying capacity also happen on Fangbian Reservoir, China, causing increase in total
nitrogen (TN) and total phosphorus (TP) as much as 2.3 and 9.6 times, respectively,
above the standard criteria so that they are considered as main contribution of the

AACL Bioflux, 2021, Volume 14, Issue 1.
http://www.bioflux.com.ro/aacl
                                                      388
pollution and ecological problems in the reservoir (Zhou et al 2011). The excess of
carrying capacity of fish culture also occurs in Cirata Reservoir and Jatiluhur Reservoir,
West Java, and Maninjau Lake, West Sumatera, resulting in water quality decline,
increased disease infection frequency, and massive mortality of the cultured fish (Pribadi
2005; Fakhrudin 2010; Lukman et al 2015; Astuti et al 2016).
FFC culture is one of the organic pollution load sources in Riam Kanan Reservoir,
while other sources come from domestic, animal husbandry, and agricultural activities
(Brahmana & Achmad 2012). Increase in pollution load can be seen from number of fish
culture production, number of human population, number of livestocks cultured, and the
agricultural areas that tend to increase in the last several years. The statistics of 2006-
2018 indicate that the fish culture production of Aranio district rises 114% yr-1, far
reaching the other pollution load sources, only less than 18% yr-1 (SCBR 2007, 2019b). It
means that FFC culture is potential to contribute the largest organic pollution load to
Riam Kanan Reservoir waters. Increased number of FFC culture is feared to be going to
exceed the carrying capacity and cause future problems in relation with worsening water
quality and aquatic trophic status if it is uncontrolled. Riam Kanan Reservoir is a
multifunctional reservoir as source of standard water so that the quality needs to be
maintained in order to meet the required quality standard criteria. This study aims to
analyze the water quality status, the trophic status, and carrying capacity of the fish
culture in Riam Kanan Reservoir.
Material and Method
Research locality and period. This study was carried out for 5 months, from May to
September 2019 in Riam Kanan reservoir, Aranio district, Banjar regency, South
Kalimantan province. Aranio district is located at 3o9’34”-3o17’58” S and 115o7’50”-
115o5’13” E with an area of 1,166.35 km2. This district is mostly in forest area, either
public forest or national forest (SCBR 2019a, b).
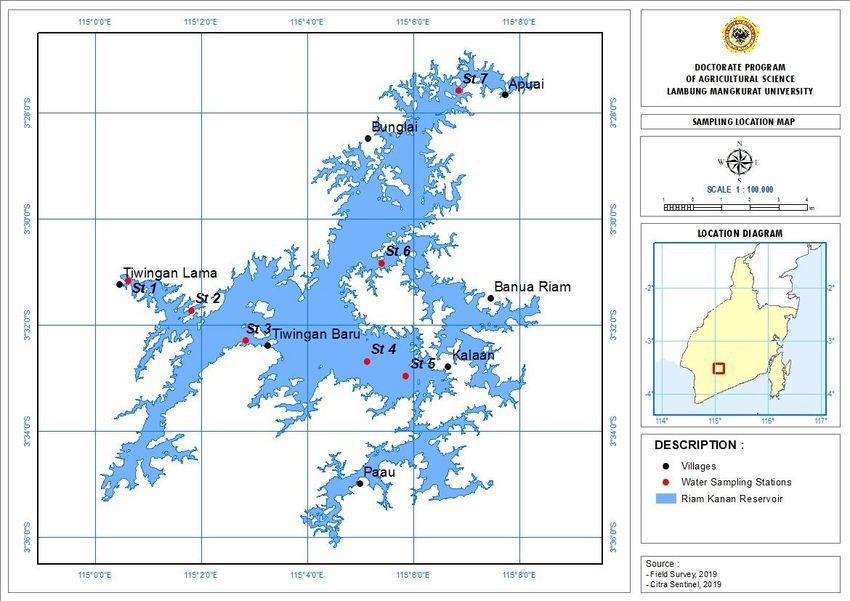
Data collection. The study used field survey method on water quality. It covered 16
parameters, temperature, pH, dissolved oxygen (DO), transparency, turbidity, total
density solid (TDS), total suspended solid (TSS), biological oxygen demand (BOD),
chemical oxygen demand (COD), NH3-N, free NH3, nitrate (NO3), nitrite (NO2), total
phosphorus (TP), total nitrogen (TN), and chlorophyll-a. Water quality observations were
done 3 times at 2-month interval. Water sampling was purposively done at 7 stations, 3
stations on the inlet of downstream, one at the middle reservoir, 2 in the floating fish
cage culture area, and another one near the outlet (Table 1 and Figure 1).
Table 1
Water sampling stations
Coordinate
Station Remarks
S E
St 1 03o31'09.6" 115o00'37.6" Reservoir outlet
St 2 03o31'43.2" 115o01'48.8" Floating cage fish culture
o
St 3 03 32'17.3" 115o02'50.6" Floating cage fish culture
o
St 4 03 32'40.9" 115o05'07.7" Middle reservoir
o
St 5 03 32'57.0" 115o05'51.9" River mouth
o
St 6 03 30'49.7" 115o05'24.3" River mouth
o
St 7 03 27'34.5" 115o06'51.2" River mouth
Water sample was collected at 3 depth points, 0.5 m below the surface, midwater
column, and 1 m above the bottom. Water sampling was done twice per observational
period, at 13.00-17.00 pm to measure all water quality parameters and 01.00-06.00 am
to record water temperature, pH, DO, and turbidity. Water quality measurements were
done in situ and in laboratory. Water temperature, pH, DO, turbidity, and transparency
were measured in situ, whereas other 11 components were measured in the laboratory.
AACL Bioflux, 2021, Volume 14, Issue 1.
http://www.bioflux.com.ro/aacl
389For TDS, TSS, BOD, COD, NH3-N, free NH3, NO3, NO2, TP and TN measurements, as
much as 2 L of water sample was collected, whereas for chlorophyll-a analysis, one-liter
of water was taken. The water quality analytical method is presented in Table 2.
Figure 1. Sampling location map.
Table 2
Water quality parameter analytical method
Parameter Unit Method
o
Temperature C In site, using thermometer
pH - In site, using pH meter
DO mg L-1 In site, using DO meter
Turbidity NTU In site, using turbidity meter
Transparency cm In site, using Secchi disk
TDS mg Gravimetry
TSS mg L-1 Gravimetry
BOD mg L-1 Titration
COD mg L-1 Titration
NH3 mg L-1 Spectrophotometry
Free NH3 mg L-1 Spectrophotometry
NO3 mg L-1 Spectrophotometry
NO2 mg L-1 Spectrophotometry
Total phosphorus mg L-1 Spectrophotometry
Total nitrogen mg L-1 Kjeldhal
Chlorophyll-a mg L-1 Spectrophotometry
Data analyses. Water quality data were analysed using Storet (Storage and Retrievel
of Water Quality Data System) method, Carlson Trophic State Index (TSI), and carrying
capacity approach.
AACL Bioflux, 2021, Volume 14, Issue 1.
http://www.bioflux.com.ro/aacl
390Storet method was employed to determine the water quality status referred to
the value system issued by the United States Environmental Protection Agency (US-
EPA). Storet method is one of the methods recommended by the Government of
Indonesia Republic to determine the water quality status through the decree of Living
Environmental Minister numbered 115/2003 concerning the guide to water quality
status determination. The Storet analysis steps are as follows:
1. Water quality data utilized time series data;
2. The water quality data were then compared with standard quality as class category;
3. If the measurements meet the standard water quality, it is scored 0;
4. If the measurements do not meet the standard quality, the score foll ows the
requi rements i n Table 3;
5. Negative scores of all parameters were summed. The total value was compared
with the criteria as listed in Table 4.
Table 3
Value system for water quality status determination
Parameters
No. samples* Value
Physical Chemical Biological
< 10 Maximum -1 -2 -3
Minimum -1 -2 -3
Mean -3 -6 -9
≥ 10 Maximum -2 -4 -6
Minimum -2 -4 -6
Mean -6 -12 -18
Notes: *) No. water quality parameters (Canter 1997 in Living Environment Minister's decree numbered
115/2003 concerning the guide to water quality status determination 2003).
Table 4
Water quality classification
Class Condition Score Remarks
Class A Very good 0 Meet the quality standard
Class B Good -1 s/d -10 Lightly polluted
Class C Moderate -11 s/d -30 Moderately polluted
Class D Poor ≥ -31 Heavily polluted
Source: US-EPA in Living Environment Minister's decree numbered 115/2003 concerning the guide to water
quality status determination 2003).
Carlson TSI method (Carlson 1977) was used to determine the aquatic trophic status.
Some researchers have also utilized this method for the same purpose (Jarosiewicz et al
2011; Samudro et al 2012; El-Serehy et al 2018; Ghashghaie et al 2018). Water quality,
such as water transparency, chlorophyll-a, and total phosphorus, was estimated as
follows:
TSI (SD) = 60 – 14.41 ln (SD)
TSI (CHL) = 30.6 + 9.81 ln (CHL)
TSI (TP) = 4.15 + 14.42 ln (TP)
TSI (SD) + TSI (CHL) + TSI (TP)
TSI =
3
where: TSI = Tropic State Index;
SD = Secchi disk (m);
CHL = Chlorophyll-a (μg L-1);
TP = total phophorus (μg L-1).
AACL Bioflux, 2021, Volume 14, Issue 1.
http://www.bioflux.com.ro/aacl
391The value of TSI analysis was then compared with the aquatic trophic criteria
(Table 5) to determine the trophic status of the reservoir.
Table 5
Aquatic trophic status category based on TSI index
Trophic status TSI value
Olygotrophic 0 -Table 7
Water quality measurements
Standard Measurements
Parameter Unit
water quality* Minimum Maximum Mean
o
Temperature C Dev 3 27.32 30.22 28.51
Transparency m - 0.77 2.00 1.31
Turbidity NTU - 4.39 18.35 7.14
TDS mg L-1 1000 60.00 98.00 76.48
TSS mg L-1 50 nd 27.00 2.86
pH 6-9 5.07** 6.78 6.02
DO mg L-1 6 3.77** 7.17 6.06
Total phosphorus mg L-1 0.2 0.002 0.434** 0.050
Total nitrogen mg L-1 - 0.666 9.862 2.140
NH3-N mg L-1 0.5 nd 0.17 0.02
Free NH3 mg L-1 - nd 0.08 0,01
BOD mg L-1 2 1.40 32.80** 8.50**
COD mg L-1 10 18.10** 224.00** 69.10**
NO3 mg L-1 10 nd 0,.92 0.263
NO2 mg L-1 0.06 nd 0.02 0.005
Chl-a µg L-1 - 0.1392 7.50 0.974
Notes: * = class-one water quality standard based on Governent’s regulation of south Kalimantan No. 5/2007;
** = does not meet the quality standard requirements; - = not regulated; nd = not detected.
Based on the measurements in the study stations, water pH, BOD, and COD did not fulfill
the water quality standard, in which DO did not meet the standard quality in station 1, 2,
3, 4, 6, and 7, while TP did not meet the standard requirements in stations 1, 2, and 5
(Table 8).
Table 8
Storet index-based water quality status
Parameters that do not meet
Station Index Status
the standard water quality
1 pH, DO, TP, BOD, COD -32 Heavily polluted
2 pH, DO, TP, BOD, COD -38 Heavily polluted
3 pH, DO, BOD, COD -24 Moderately polluted
4 pH, DO, BOD, COD -22 Moderately polluted
5 pH, TP, BOD, COD -30 Moderately polluted
6 pH, DO, BOD, COD -28 Moderately polluted
7 pH, DO, BOD, COD -24 Moderately polluted
Riam Kanan Reservoir pH, DO, TP, BOD, COD -24 Moderately polluted
Storet analysis revealed that the water quality status of Riam Kanan was categorized as
moderately polluted with mean index of -24. With station, the water quality status of
stations 1 and 2 was in heavily polluted category with index value of -32 and -38,
respectively, whereas stations 3, 4, 5, 6, and 7 were categorized as moderately polluted
with index range of -22 to -30.
The recommended water quality standard based on the regulations of South
Kalimantan Governor numbered 05/2007 concerning river water designation and
standard 2007 was 6-9 for water pH and minimum 6 mg L-1 for DO. In pH of 4-5, fish do
not reproduce, and most fish species die at pH below 4.0 and above 11 (Lawson 1995).
Suitable DO ranges from 5 to 15 mg L-1 (Boyd & Tucker 1998). DO is critical for tropical
cultured fish if it is less than 4 mg L-1 (Mallasen et al 2012).
Water fertility analysis showed that Riam Kanan Reservoir belonged to
mesotrophic with mean TSI of 46.58 (Table 9). The tropic status varied with station from
AACL Bioflux, 2021, Volume 14, Issue 1.
http://www.bioflux.com.ro/aacl
393mesotrophic to acute mesotrophic with the lowest TSI in station 4, 41.62, and the
highest in station 2, 50.18.
Table 9
Trophic status analysis
Station May July September Mean Tropis status
1 48.70 40.26 49.53 46.16 Mesotrophic
2 48.93 49.39 52.20 50.18 Acute mesotrophic
3 46.32 43.33 51.69 47.11 Mesotrophic
4 41.34 40.70 42.81 41.62 Mesotrophic
5 44.43 47.54 45.65 45.87 Mesotrophic
6 47.73 47.29 42.45 45.82 Mesotrophic
7 49.46 46.05 52.32 49.28 Mesotrophic
Mean 46.70 44.94 48.09 46.58 Mesotrophic
High BOD, COD, and TP indicate that Riam Kanan Reservoir water has been polluted by
organic matters. The organic matters entering the reservoir particularly came from
domestic activities, such as animal husbandary, agriculture, and floating fish cage
culture. The highest mean BOD, COD, and TP was recorded in station 2, 14.83 mg L-1,
110.07 mg L-1, and 0.1573 mg L-1, respectively. Station 2 is the floating fish cage culture
activity with the highest density, 5.96 plots Ha-1 (Nur et al 2020b). Montanhini Neto &
Ostrensky (2015) stated that percent of fish feed nutrients released into the floating fish
cage culture environment consisted of 78% organic matter, 65% N and 72% P. High
BOD, COD, and TP in the floating fish cage culture area indicate that fish culture activities
play jmportant role in raising the three water quality parameters.
The trophic status of Riam Kanan Reservoir in the present study is higher than
that in previous study indicating that the trophic status changes from olygotrophic to
mesotrophic status (Brahmana & Achmad 2012). Increased water fertility could result
from addition of organic matters into the reservoir from the floating fish cage culture.
Furthermore, with observational period, the trophic status was categorized as
mesotrophic with the lowest mean TSI in July and the highest in September, 44.94 and
48.09, respectively. In May and July, the trophic status in all stations belonged to
mesotrophic category, whereas in September it varied from mesotrophic to mesotrophic
acute. Variations in TSI value could be related with the water volume of the reservoir. In
July, water volume of the reservoir was higher than that in May, so that organic matter
concentration dilution, including TP and chlorophyll-a, whereas in September, water
volume and input declined so that the wastes in the reservoir were accummulated and its
concentration rose.
The capacity of TP load, 137.3 ton yr-1, and the existing TP load existing, 226.6
-1
ton yr demonstrated that Riam Kanan Reservoir has got excessive load of TP, 89.3 ton
yr-1, that is equivalent to excessive fish production of the floating fish cage, 5,030 ton yr-
1
or excessive floating net units as many as 2,394 plots. The fish culture poduction in
Riam Kanan Reservoir was estimated as 8,955 ton yr-1. The carrying capacity of fish
production is the difference between total production and the total excess production,
3,925 tons yr-1 or equivalent to 1,869 units of floating fish cage (Table 10).
Although Riam Kanan Reservoir has had water quality degradation into
moderately polluted, this condition is still better than several large lakes or reservoirs in
Indonesia that are in heavily polluted condition with eutrophic or hypertrophic fertility
status, such as Cirata Reservoir and Jatiluhur Reservoir in West Java (Jubaedah et al
2014; Komarawidjaja et al 2005; Hamzah et al 2017), Koto Panjang Reservoir in Riau
(Hasibuan et al 2017), and Maninjau Lake in West Sumatera (Syandri et al 2017, 2020).
AACL Bioflux, 2021, Volume 14, Issue 1.
http://www.bioflux.com.ro/aacl
394Table 10
Fish culture carrying capacity analysis
Parameters Value Unit Source
Morphometry
Volume 621.7 million m3UL PLTA/D Gunung
Bamega (2019)
Area 54.4 million m2 UL PLTA/D Gunung
Bamega (2019)
Mean depth 11.42 m Data analysis
Water outflow 1.157.2 million m3 yr-1 UL PLTA/D Gunung
Bamega (2019)
Water replacement rate 1.86 times yr-1 Data analysis
The capacity of water pollution load from total phosphorus
Standard TP (mesotrophic) 30.00 mg P m-3 MLE (2009)
TP monitoring data 49.52 mg P m-3 Data analysis
Allocation of TP load -19.52 mg P m-3 Data analysis
TP load capacity 137.3 ton P yr-1 Data analysis
Existing TP load 226.6 ton P yr-1 Data analysis
Excess of TP load 89.3 ton P yr-1 Data analysis
Carrying capacity based on number of fish production
FCR 1.85 Survey data of 2019
TP of feed 13 kg P ton-1 feed Widyastuti et al (2009)
TP of fish 3.4 kg P ton-1 fish Montanhini Neto &
Ostrensky (2015)
-1
TP of fish wastes 17.76 kg P ton fish Data analysis
Existing FFC production 8.955 ton fish yr-1 Data analysis
Excess of FFC production 5.030 ton fish yr-1 Data analysis
FFC production as carrying 3.925 ton fish yr-1 Data analysis
capacity
Carrying capacity based on number of FFC
No. existing FFC units 4.263 plot Nur et al (2020b)
No. FFC unit excess 2.394 plot Data analysis
No. FFC units as carrying capacity 1.869 plot Data analysis
Based on the potential analysis of TP pollution in this study, it was found that 70% of TP
pollution load in Riam Kanan Reservoir was caused by the floating fish cage culture
activity (Table 11). Water quality decline is in general caused by uncontrolled floating fish
cage culture development that exceed its carrying capacity (Komarawidjaja et al 2005;
Pribadi 2005; Machbub 2010; Sutjinurani & Suharyanto 2016; Hamzah et al 2017;
Hasibuan et al 2017; Syandri et al 2020), so that this finding reconfirms the previous
studyhe cause of the degradation of water quality condition.
Table 11
Potency of water pollution load from total phosphorus in Riam Kanan reservoir
Source TP load (ton yr-1) %
Human population 3.06 1.35
Agriculture 3.13 1.38
Animal husbandary 39.75 17.54
Other source 21.62 9.54
Fish culture 159.04 70.19
Total 226.59 100.00
AACL Bioflux, 2021, Volume 14, Issue 1.
http://www.bioflux.com.ro/aacl
395Conclusions. Water quality status of Riam Kanan Reservoir was categorized as
moderately polluted with Storet index of -24. The water quality parameters that did not
fulfil the quality standard were pH, DO, TP, BOD, and COD. The trophic status of Riam
Kanan Reservoir belonged to mesotrophic category with mean TSI of 46.58. The use of
Riam Kanan Reservoir for fish culture has exceeded the aquatic carrying capacity with
mesotrophic status. To overcome the water quality degradation and increased fertility, it
is necessary to reduce the number of floating fish cage as much as 56% of the recent
condition. Since this study was carried out in dry season, April-September, other
measurements need to be done in rainy season, October-March, in order to obtain core
complete condition of the reservoir water.
Acknowledgements. We would like to greatly appreciate the Regional Government of
South Kalimantan Province for the research grant and the Head of Soil Laboratory, the
Faculty of Agriculture, Lambung Mangkurat University, the Head of Industrial
Standardization and Acreditation Office of Banjarbaru, and the Head of Environmental
Health Technical Board of Banjarbaru who have facilitated the sample analysis in the
laboratory. Our special appreciation is also addressed to the Head of Water Quality
Laboratory, Faculty of Fisheries and Marine Sciences, Lambung Mangkurat University for
consultation, equipment, field assistants for water sampling and measurements.
References
Astuti L. P., Nurfiarini A., Sugianti Y., Warsa A., Rahman A., Hendrawan A. L. S., 2016
[Sustainable fisheries governance in Jatiluhur Reservoir]. Penerbit Deepublish,
Yogyakarta, 260 pp. [in Indonesian]
Boyd C. E., Tucker C. S., 1998 Pond aquaculture water quality management. Kluwer
Academic, Boston, 700 pp
Brahmana S. S., Achmad F., 2012 [The potentials of nitrogen and phosphate pollution,
water quality, trophic status, and stratification of Riam Kanan Reservoir]. Jurnal
Sumber Daya Air 8(1):53-66. [in Indonesian]
Carlson R. E., 1977 A trophic state index for lakes. Limnology and Oceanography
22(2):361-369.
El-Serehy H. A., Abdallah H. S., Al-Misned F. A., Al-Farraj S. A., Al-Rasheid K. A., 2018
Assessing water quality and classifying trophic status for scientifically based
managing the water resources of the Lake Timsah, the lake with salinity
stratification along the Suez Canal. Saudi Journal of Biological Sciences 25(7):1247-
1256.
Fakhrudin M., 2010 [Hydroclimatological study as early warning system development of
fish massive mortality disaster in Maninjau lake, Sumbar]. Pusat Penelitian
Limnologi LIPI, Bogor, 50 pp. [in Indonesian]
Ghashghaie M., Maralan M. R. S., Ostad-Ali-Askari K., Eslamian S., Singh V. P., 2018
Determining the eutrophication state of Ecbatan Reservoir using Carlson index.
American Journal of Engineering and Applied Sciences 11(2):491-500.
Government of South Kalimantan, 2007 [Government’s regulation of south Kalimantan
numbered 05/2007 concerning river water designation and standard]. 17 pp. [in
Indonesian]
Hamzah, Maarif M. S., Marimin, Riani E., 2016 [The water quality status of Jatiluhur
Reservoir and threats to vital business process]. Jurnal Sumber Daya Air 12(1):47-
60. [in Indonesian]
Hasibuan I. F., Hariyadi S., Adiwilaga E. M., 2018 [Water quality state and trophic of
PLTA Koto Panjang Reservoir, Riau Province]. Jurnal Ilmu Pertanian Indonesia
22(3):147-155. [in Indonesian]
Jarosiewicz A., Ficek D., Zapadka T., 2011 Eutrophication parameters and Carlson-type
trophic state indices in selected Pomeranian lakes. Limnological Review 11(1):15-
23.
AACL Bioflux, 2021, Volume 14, Issue 1.
http://www.bioflux.com.ro/aacl
396Jubaedah I., Sudinno D., Anas P., 2014 [Analysis of water quality conditions and
aquaculture productivity of floating net cages in Cirata Reservoir, Cianjur Regency,
West Java Province]. Jurnal Penyuluhan Perikanan dan Kelautan 8(1):9-22. [in
Indonesian]
Komarawidjaja W., Sukimin S., Arman E., 2005 [Status of water quality in Cirata
Reservoir and its impact on the growth of cultivated fish]. Jurnal Teknik Lingkungan
P3TL-BPPT 6(1):268-273. [in Indonesian]
Lawson T. B., 1995 Fundamentals of aquaculture engineering. Chapman and Hall, New
York, 355 pp
Lukman, Setyobudiandi I., Muchsin I., Hariyadi S., 2015 Impact of cage aquaculture on
water quality condition in Lake Maninjau, West Sumatera Indonesia. International
Journal of Sciences: Basic and Applied Research 23(1):120-137.
Machbub B., 2010 [Calculation model of lake and reservoir water pollution load carrying
capacity]. Jurnal Sumber Daya Air 6(2):129-144. [in Indonesian]
Mallasen M., Carmo C. F., Tucci A., Barros H. P., Rojas N. E. T., Fonseca F. S.,
Yamashita E. Y., 2012 Water quality in cage system fish farm in Ilha Solteira
Reservoir, SP. Boletim Do Instituto de Pesca 38(1):15-30.
Ministry of Living Environment, 2003 [Decree numbered 115/2003 concerning the guide
to water quality status determination]. 15 pp. [in Indonesian]
Ministry of Living Environment, 2009 [Decree numbered 28/2009 concerning
lake/reservoir water pollution load carrying capacity]. 11 pp. [in Indonesian]
Montanhini Neto R., Ostrensky A., 2015 Nutrient load estimation in the waste of Nile
tilapia Oreochromis niloticus (L.) reared in cages in tropical climate conditions.
Aquaculture Research 46(6):1309-1322.
Nur M., Rifa’i M. A., Yunita R., Sofia L. A., 2020a Feasibility of floating cage culture based
on business scale in Riam Kanan Reservoir, South Kalimantan Province. AACL
Bioflux 13(5):2868-2877.
Nur M., Rifa’i M. A., Yunita R., Sofia L. A., 2020b [Mapping of floating net cage
distribution base on zone and business scale level on Riam Kanan Reservoir
Kalimantan Selatan Province]. EnviroScienteae 16(2):276-286. [in Indonesian]
Pribadi T. H., 2005 [Sustainable fish culture management in the reservoir (case study in
Cirata Reservoir, West Java)]. PhD Thesis, Institut Pertanian Bogor, 222 pp. [in
Indonesian]
Research and Development Board of Public Works (RDBPW), 1995 [Large reservoir in
Indonesia]. Badan Penerbitan PU, Jakarta, 374 pp. [in Indonesian]
Samudro S., Sasongko S. B., Susanti I. T., 2012 [Trophic status of Manggar reservoir,
Balikpapan, and its management strategy]. Jurnal Presipitasi: Media Komunikasi
dan Pengembangan Teknik Lingkungan 9(2):72-78. [in Indonesian]
Shakouri M., 2003 Impact of cage culture on sediment chemistry, a case study in
Mjoifjordur. Fisheries Training Programme, The United Nations University, 44 pp.
Soendjoto M. A., Suyanto, Nuryadin M. R., 2009 [Fisheries-based economic value of
Sultan Adam Forest Park, South Kalimantan]. Seminar Nasional Perikanan
Indonesia 2009, 3-4 Desember, Sekolah Tinggi Perikanan, pp. 481-486. [in
Indonesian]
Statistic Center of Banjar Regency (SCBR), 2007 Banjar regency in figure 2006/2007.
BPS Kabupaten Banjar, Martapura, 386 pp.
Statistic Center of Banjar Regency (SCBR), 2009 Banjar regency in figure 2009. BPS
Kabupaten Banjar, Martapura, 380 pp.
Statistic Center of Banjar Regency (SCBR), 2016a Banjar regency in figure 2016. BPS
Kabupaten Banjar, Martapura, 442 pp.
Statistic Center of Banjar Regency (SCBR), 2016b Statistic of Aranio district 2016. BPS
Kabupaten Banjar, Martapura, 28 pp.
Statistic Center of Banjar Regency (SCBR), 2016c Statistic of Banjar regency
development 2016, BPS Kabupaten Banjar, Martapura, 332 pp.
Statistic Center of Banjar Regency (SCBR), 2019a Aranio District in Figure 2019. BPS
Kabupaten Banjar, Martapura, 101 pp.
AACL Bioflux, 2021, Volume 14, Issue 1.
http://www.bioflux.com.ro/aacl
397Statistic Center of Banjar Regency (SCBR), 2019b Banjar regency in figure 2019. BPS
Kabupaten Banjar, Martapura, 419 pp.
Sutjinurani T., Suharyanto, 2016 [Total maximum daily load (TMDL) analysis in the
intensive fish farming management (case study: floating cage aquaculture Cirata
Reservoir]. Jurnal Teknik Lingkungan 22(1):93-103. [in Indonesian]
Syandri H., Azrita, Junaidi, Mardiah A., 2017 Levels of available nitrogen-phosphorus
before and after fish mass mortality in Maninjau Lake of Indonesia. Journal of
Fisheries and Aquatic Science 12(4):191-196.
Syandri H., Azrita A., Mardiah A., 2020 Water quality status and pollution waste load
from floating net cages at Maninjau Lake, West Sumatera Indonesia. IOP
Conference Series: Earth and Environmental Science 430(1):1-9.
UL PLTA/D Gunung Bamega, 2019 [Report on turbine water use from October 2018 -
September 2019. Unit Layanan PLTA/D Gunung Bamega, PT PLN (Persero). Aranio,
12 pp. [in Indonesian]
Widyastuti E., Piransti A. S., Rahayu D. R. U. S., 2009 [Monitoring of carrying capacity
status of Wadaslintang Reservoir on cage net]. Jurnal Manusia dan Lingkungan
16(3):133-140. [in Indonesian]
Yang J., Yu X., Liu L., Zhang W., Guo P., 2012 Algae community and trophic state of
subtropical reservoirs in southeast Fujian, China. Environmental Science and
Pollution Research 19(5):1432-1442.
Yusuf Y., Zuki Z., Lukman U., Rahmi F., 2011 [Sediment analysis around the floating fish
cage in Maninjau lake focusing on heavy metals of Fe, Cu, Pb, and Cd]. Jurnal Riset
Kimia 5(1):95-100. [in Indonesian]
Zhou H., Jiang C., Zhu L., Wang X., 2011 Impact of pond and fence aquaculture on
reservoir environment. Water Science and Engineering 4(1):92-100.
Received: 21 January 2021. Accepted: 19 February 2021. Published online: 26 February 2021.
Authors:
Muhammad Nur, Doctorate Program of Agricultural Science, Lambung Mangkurat University, Jl. Jend. Ahmad
Yani KM 36 Banjarbaru, South Kalimantan, Indonesia, e-mail: nur@mhs.ulm.ac.id
Muhammad Ahsin Rifa’i, Faculty of Fisheries and Marine Science, Lambung Mangkurat University, Jl. Jend.
Ahmad Yani KM 36 Banjarbaru, South Kalimantan, Indonesia, e-mail: m.ahsinrifai@ulm.ac.id
Rizmi Yunita, Faculty of Fisheries and Marine Science, Lambung Mangkurat University, Jl. Jend. Ahmad Yani KM
36 Banjarbaru, South Kalimantan, Indonesia, e-mail: rizmiyunita@ulm.ac.id
Leila Ariyani Sofia, Faculty of Fisheries and Marine Science, Lambung Mangkurat University, Jl. Jend. Ahmad
Yani KM 36 Banjarbaru, South Kalimantan, Indonesia, e-mail: leila.ariyani@ulm.ac.id
This is an open-access article distributed under the terms of the Creative Commons Attribution License, which
permits unrestricted use, distribution and reproduction in any medium, provided the original author and source
are credited.
How to cite this article:
Nur M., Rifa’i M. A., Yunita R., Sofia L. A., 2021 Water quality, fertility, fish culture carrying capacity of Riam
Kanan Reservoir, South Kalimantan Province. AACL Bioflux 14(1):388-398.
AACL Bioflux, 2021, Volume 14, Issue 1.
http://www.bioflux.com.ro/aacl
398You can also read