DROUGHT CRISIS UPDATE - Sub Council 16 February 2018

Page created by Kristen Lynch
 
CONTINUE READING
DROUGHT CRISIS UPDATE - Sub Council 16 February 2018
DROUGHT CRISIS UPDATE
          Sub Council 16
           February 2018
DROUGHT CRISIS UPDATE - Sub Council 16 February 2018
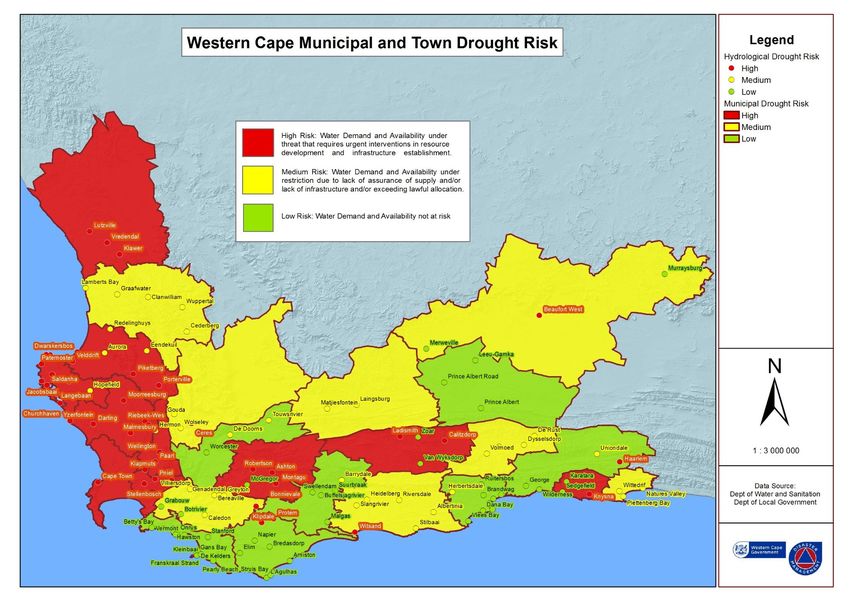
BETWEEN 2010 AND 2015,
130 MEGACITIES WERE HIT BY
DROUGHT DISASTERS

Source: Institute of Water Policy at Lee Kuan Yew School of Public Policy, Singapore
DROUGHT CRISIS UPDATE - Sub Council 16 February 2018
ANNUAL MAJOR DAM LEVELS
 All figures are for 25 September for each year
DROUGHT CRISIS UPDATE - Sub Council 16 February 2018
The current
drought is an
unprecedented
situation.

Getting through
it in 2018
requires that
water use be
greatly reduced
by households,
agriculture,
commerce and
industry alike.
DROUGHT CRISIS UPDATE - Sub Council 16 February 2018
DAM LEVELS – 5 FEBRUARY 2018

Download the Water Dashboard Report at
www.capetown.gov.za/damlevels
DROUGHT CRISIS UPDATE - Sub Council 16 February 2018
DAY ZERO DASHBOARD – 5 FEBRUARY 2018

Updated weekly – usually every Tuesday
DROUGHT CRISIS UPDATE - Sub Council 16 February 2018
CAPE TOWN’S WATER INTEGRATED SYSTEM
DROUGHT CRISIS UPDATE - Sub Council 16 February 2018
LONG – TERM RAINFALL
DROUGHT CRISIS UPDATE - Sub Council 16 February 2018
DAM STORAGE
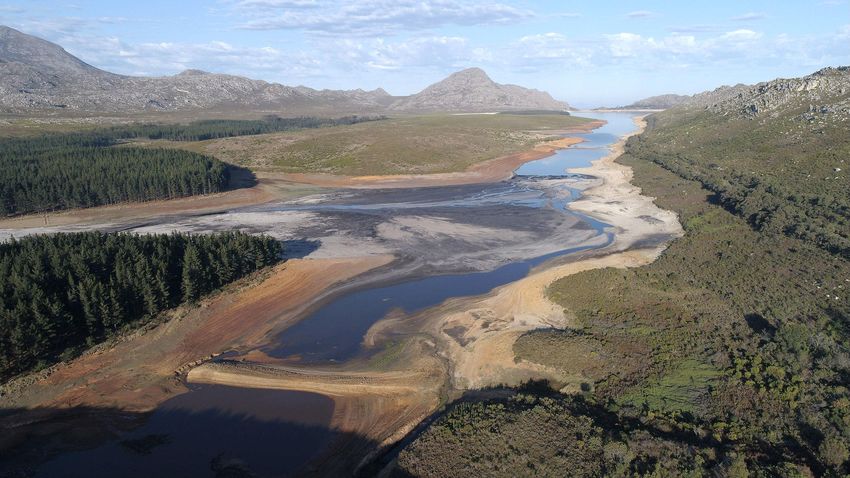
DROPPING WATER LEVELS
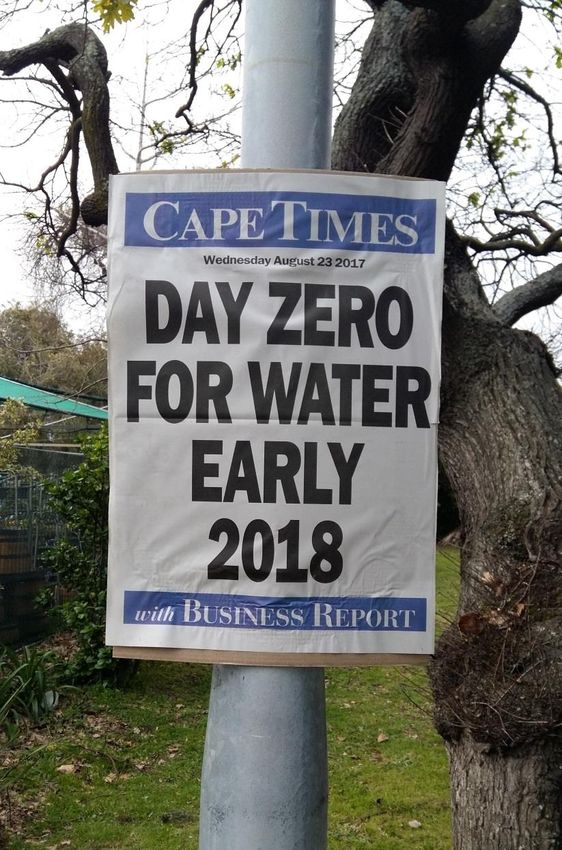
                        Western Cape Drought - 2018   11
MOST SEVERE DROUGHT IN OVER 100 YEARS

                         Rainfall at CT Airport
FUTURE MODELLING
BULK WATER USAGE
DAY ZERO PREDICTIONS
NEW SUPPLY AUGMENTATION
When was additional water required?
TYPE                         LOCATION           MLD       FIRST WATER      FULL PRODUCTION

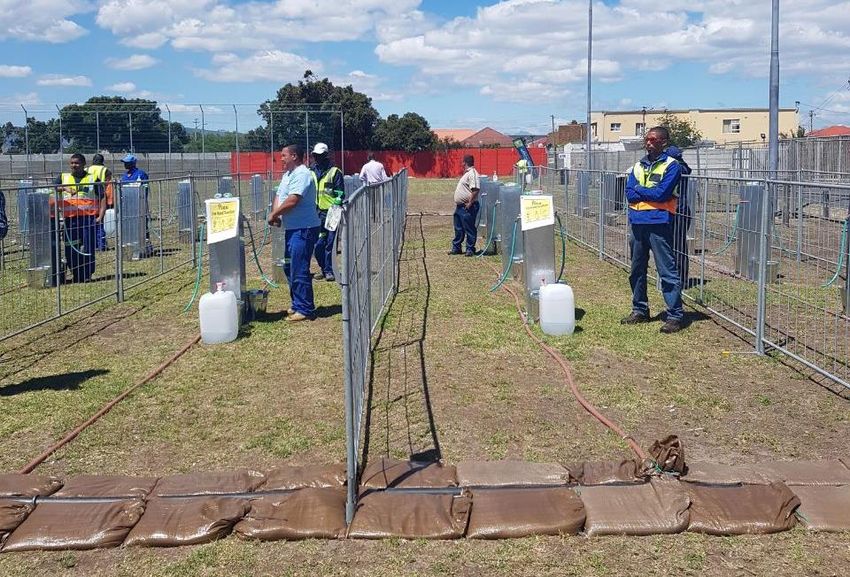
Short-term, temporary desalination       Strandfontein         7        March 2018          May 2018

                                          Monwabisi            7        March 2018          May 2018

                                        V&A Waterfront         12       March 2018          May 2018

    Groundwater abstraction            Cape Flats aquifer      80        May 2018           June 2018

                                        Atlantis aquifer       20        May 2018         October 2018

                                          TMG aquifer          40      February 2018        June 2019

             Springs                 Newlands Albion spring    3        In operation

                                          Oranjezicht          1        In operation

          Water re-use                     Zandvliet          10-50      June 2018       December 2021

                                          Cape Flats          10-75      June 2018       December 2021

                                           Macassar            20        June 2019

                                           Potsdam             10        June 2019

                                                                      December 2021
                                            Ahtlone            75

     Permanent desalination                Koeberg                    (pilot underway)
WRP EMERGENCY PROGRAMME ROADMAP – DEC 2017
COMPARATIVE COSTS OF NEW SOURCES OF WATER
AUGMENTATION – ANTICIPATED YIELDS, TBC

                                                 Augmentation 2018 MLD
200

180

160

140

120

100

80

60

40

20

 0
      Feb-18   Mar-18       Apr-18      May-18      Jun-18     Jul-18   Aug-18      Sep-18     Oct-18      Nov-18   Dec-18

               Temporary transfers                Springs                        Ground Water Abstraction (sandy)
               Ground Water Abstraction (TMG)     Water Reclamation              Emergency desalination
               Permanent desalination
IMPACT OF NEW SUPPLY NEXT SUMMER

            60%
                                                                                                                                                                                                              But are very
                                                                                            New supplies
                                                                                                                                                                                                             important for
                                                                                            have a small
                                                                                                                                                                                                                 2019
            50%                                                                              impact this
                                                                                                                                                                                                          if winter rainfall is
                                                                                              summer.
                                                                                                                                                                                                                  low
            40%
                  35.1%

                                                                                                                                                                                                                                                            with

                                                                                                                         31.4%
                           30.5%

                                                                                                                                                                                                                                                        augmentation

                                                                                                                                                                                                                                      29.7%
DAM LEVEL

                                                                                                                                  28.8%
                                                                                                              27.2%

                                                                                                                                                                                                                                               27.1%
            30%

                                                                                                                                                                                                                             25.4%
                                     25.4%

                                                                                                                                           25.1%
                                              20.8%

                                                                                                                                                    20.8%
                                                                                                     19.3%
                                                                                                                                                                                                                                                            very

                                                                                                                                                                                                                   17.6%
                                                                                                                                                             16.9%
            20%
                                                       16.3%

                                                                                                                                                                                                                                                        conservative
                                                                                            13.3%
                                                                13.2%

                                                                                                                                                                      13.1%
                                                                         11.8%

                                                                                                                                                                                                           11.6%
                                                                                   11.2%

                                                                                                                                                                               10.6%
                                                                                                                                                                                                                                                         scenarios

                                                                                                                                                                                        9.7%

                                                                                                                                                                                                 9.4%
            10%

            0%
                                                                                            Jul-18

                                                                                                                         Oct-18

                                                                                                                                                                                                          Jul-19

                                                                                                                                                                                                                                      Oct-19
                                     Jan-18

                                                                         May-18

                                                                                   Jun-18

                                                                                                                                                    Jan-19

                                                                                                                                                                                        May-19

                                                                                                                                                                                                 Jun-19
                                              Feb-18

                                                       Mar-18

                                                                                                                                                             Feb-19

                                                                                                                                                                      Mar-19
                  Nov-17

                           Dec-17

                                                                                                     Aug-18

                                                                                                              Sep-18

                                                                                                                                  Nov-18

                                                                                                                                           Dec-18

                                                                                                                                                                                                                   Aug-19

                                                                                                                                                                                                                             Sep-19

                                                                                                                                                                                                                                               Nov-19
                                                                Apr-18

                                                                                                                                                                               Apr-19
                                    Status quo                                    +CFA60                               With water trading                               With return effluent                                Ph1 236
                                    (no additional)

New water supplies are important for water security going forward but these
will have little impact this summer
DEMAND MANAGEMENT
CITY & AGRICULTURE MUST BOTH RESTRICT USAGE
WATER CONSUMPTION 2016/17

          Formal homes use 65% of Cape Town’s water.
POPULATION GROWTH & WATER USE
                                       700                                                                                        6.0
Water Treated per year (million m3)

                                       600
                                                                                                                                  5.0

                                       500

                                                                                                                                        Population (millions)
                                                                                                                                  4.0

                                       400

                                                                                                                                  3.0

                                       300

                                                                                                                                  2.0
                                       200
                                                                                             City’s demand-side
                                                                                             programme has ‘flat
                                       100
                                                                                             lined’ consumption                   1.0
                                                                                             since 2000

                                        0                                                                                         0.0
                                         1950          1960     1970   1980           1990       2000        2010             2020

                                                Water Treated            Population                     Expon. (Population)
Water
CITY &Allocations
      AGRICULTURE andMUST
                      Actual Demand
                          BOTH RESTRICT USAGE

                                                   Proposed COCT Augmentation Schemes
                                                   Accelerated Programme
                                                   (Additional 15 Mm3)

                                                   Allocation from Berg
                                                   River Dam (84 Mm3)
                                                   Fully Financed by CCT

                                                     20 % Saving
                                                           280- 260 Mm3

      Combined allocations from Voelvlei,
      Wemmershoek, Theewaterskloof and Steenbras
      Dams plus Palmiet Transfer (320 Mm3)
DEMAND MANAGEMENT

To manage daily demand requires that each person should no more than the defined
volume per day, whether they are at home, at work or elsewhere. Reaching the overall
demand target is only possible if individual use is curtailed.
•   Water restrictions and punitive tariffs: Level 6b will be in effect from 1 February with a
    target of 450 MLD, with a maximum of 50 litres pp/day.
•   Water conservation
     – Leak management: response times & repair, including repair for indigent households
     – Pipe replacement
•   District metering and zoning
•   Pressure reduction
•   Water Management Devices and meter management
•   Household & business adaptation
•   Education, awareness and behaviour change
•   Communication campaigns
                                                             Awarded C40 Award for
                                                             Adaptation in 2015 for Water
                                                             Conservation and Demand
                                                             Management
RESTRICTIONS
LEVEL      DATE               RESTRICTION                                              TARGET

Level 1    2005               •   No irrigation 10:00-16:00                            10% savings
                              •   Spray nozzles for hosepipes
                              •   No hosing down hard surfaces
                              •   No dampening of building sand

Level 2    1January 2016      •   Irrigation for 1 hour on Tue, Wed, Thurs             20% savings
                              •   No irrigation 9:00-16:00

Level 3    1 November 2016    •   Buckets only for watering gardens                    30% savings
                              •   Pool covers

Level 3B   1 February 2017    •   No private car washing                               30% savings

Level 4    1 June 2017        •   No irrigation                                        100 Litres pp/day
                              •   No topping up of private pools

Level 4B   1 July 2017        •   No topping up of public pools                        87   Litres pp/day

Level 5    3 September 2017   Fines:                                                   87   Litres pp/day
                              •    Residential > 20kl/m
                              •    Commercial: 20% less than same month previous
                                   year

Level 6    1 January 2018     •   Households consuming more 10.5kl/m prioritised for   87   Litres unless targets continue
                                  WMD                                                       to be missed in which case this
                              •   Non-residential properties reduce by 45% less than        will be reduced
                                  pre-drought consumption (2015)
                              •   Agriculture to reduce by 60%

Level 6b   1 February 2018    •   Households consuming more than 6 kl/m prioritised    50 Litres pp/day
                                  for WMD
                              •   Punitive tariffs for >10.5kl/m
HOUSEHOLD WATER USAGE GUIDE
50 FOR 150
    If we all use 50 litres for 150 days, we have a
   chance of making it to the next rainy season,
         without having to turn off the taps.

Don’t wait for Level 6b water restrictions, to reduce your use.
RESOURCES

Available from www.capetown.gov.za/thinkwater

Resources include:
•   Posters & videos
•   Print ready material for Day Zero & Save Like a Local
    e.g. posters, stickers, tent cards
      • 50 litre life*
      • Water saving checklist*
      • How to safely use greywater
      • How to find and fix leaks
      • Permission cubicle for toilets

•   Extensive FAQs: How the City manages leaks, Disaster and
    Demand (Day Zero)

•   Guides: e.g. installation of alternative water systems

•   Day Zero Dashboard
    www.capetown.gov.za/dayzerodashboard
•   Dam Levels www.capetown.gov.za/damlevels

•   Cape Town Water Map www.capetown.gov.za/watermap

      Resource packs are updated as new material is being made available.
City and other campaigns:

www.capetown.gov.za/thinkwater

www.wwf.org.za – campaigns & info
for residents and businesses

www.greencape.co.za – drought
support to business

https://www.westerncape.gov.za/11
0green/reduce-water-consumption
- 110% Green website, including list
of reputable suppliers
Calculate your daily water usage
http ://bi t.l y/ThinkWaterCalculatorCT
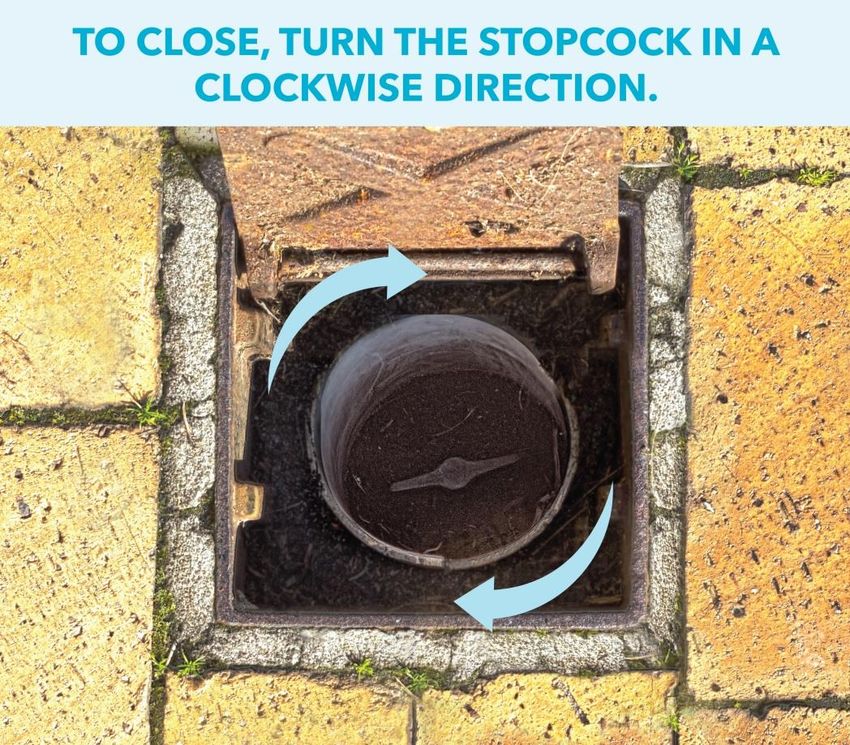
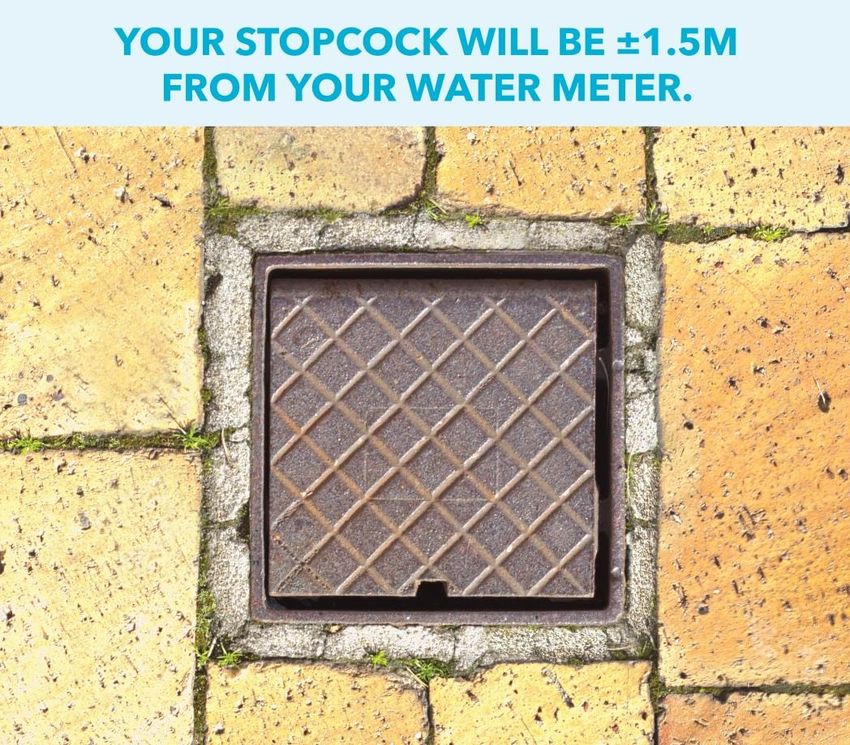
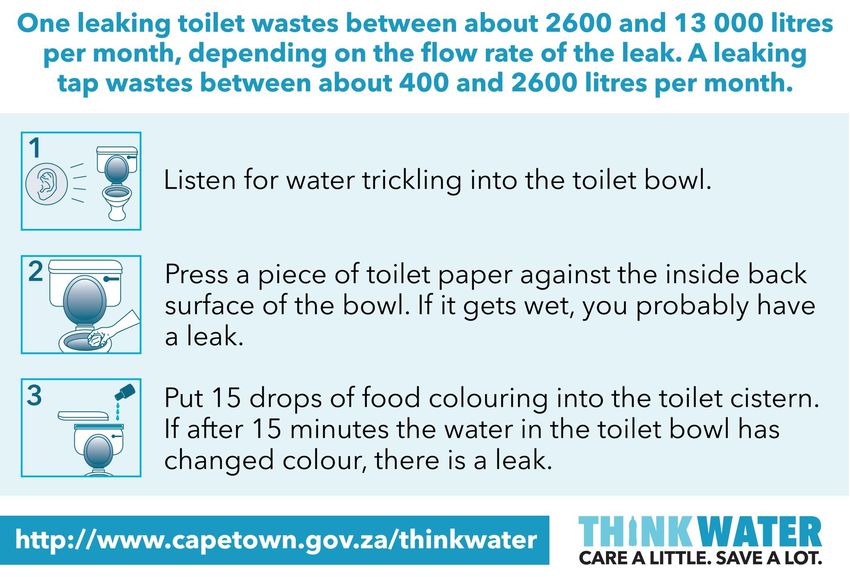
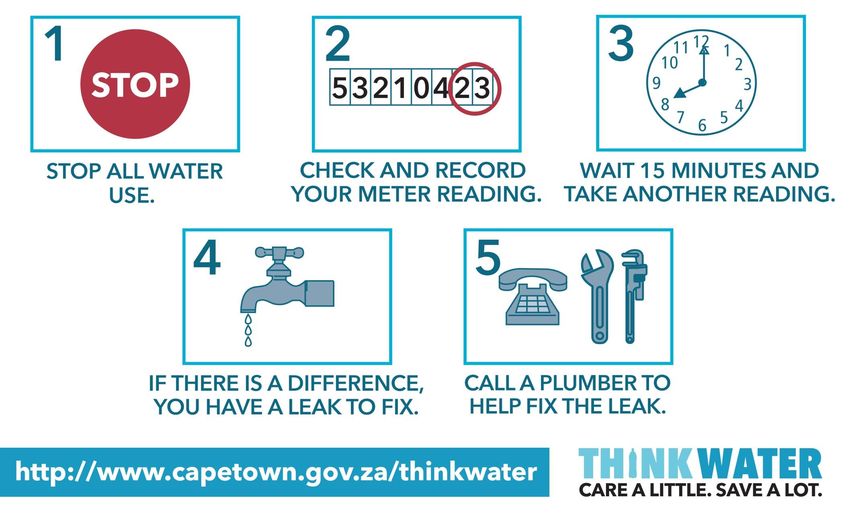
HOW TO CHECK FOR LEAKS ON
      YOUR PROPERTY
3 SIMPLE TESTS FOR A TOILET LEAK
Reduce your water flow.
Please SAVE where you can.

   The stopcock on your property
CITY WATER MAP

•   The water map indicates water use for free-
    standing households only (no complexes, flats
    etc. are indicated)
•   The data is for the previous month and might not
    correspond to your billing period.
•   If there is no dot for your free-standing
    household, it means that your water use is more
    than 10 500 litres per month. This could be due
    to:
       – Undetected leaks
       – High number of occupants
       – Business run from the home
       – Recently completed building work
       – Etc.

Full FAQs available online

www.capetown.gov.za/watermap
WATER AND SANITATION TARIFFS – 1 FEBRUARY 2018

Residential Water Tariffs (Domestic Full and Domestic Cluster)
Water Steps (1kl = 1 000 litres)          Level 4 (2017/18)                         Level 6 (2017/18)
                                          Until 31/1/2018 Rands (incl VAT)          From 1/2/2018 Rands (incl VAT)

Step 1 (>0 ≤ 6kl)                         R4, 56                                    R29, 93
                                          (free for indigent households)            (free for indigent households)

Step 2 (>6 ≤ 10.5kl)                      R17, 75                                   R52, 44
                                                                                    (R 17, 75 for indigent households)

Step 3 (>10.5 ≤ 20kl)                     R25, 97                                   R114

Step 4 (>20 ≤ 35kl)                       R43, 69                                   R342

Step 5 (>35 ≤ 50kl)                       R113, 99                                  R912

Step 6 (>50kl)                            R302, 24                                  R912

*Sanitation charged to a maximum of 35kl

Domestic Full = Stand-alone houses
Domestic Cluster = Flats, sectional title units, cluster developments and gated villages
WATER AND SANITATION TARIFFS – 1 FEBRUARY 2018

Residential Sanitation Tariffs (Domestic Full and Domestic Cluster)
Water Steps (1kl = 1 000 litres)   Level 4 (2017/18)                  Level 6 (2017/18)
                                   Until 31/1/2018 Rands (incl VAT)   From 1/2/2018 Rands (incl VAT)

Step 1 (>0 ≤ 4,2 kl)               R4, 39                             R 25, 65
                                   (free for indigent households)     (free for indigent households)

Step 2 (>4.2 ≤ 7.3 kl)             R14, 98                            R44, 46
                                                                      (R14, 98 for indigent households)

Step 3 (>7.35 ≤ 14 kl)             R30, 31                            R98, 04

Step 4 (>14 ≤ 24.5 kl)             R49, 04                            R119, 70

Step 5 (>24.5 ≤ 35 kl)             R59, 30                            R119, 70

*Sanitation charged to a maximum of 35kl

Domestic Full = Stand-alone houses
Domestic Cluster = Flats, sectional title units, cluster developments and gated villages
WATER AND SANITATION TARIFFS – 1 FEBRUARY 2018

                              Commercial / Industrial Tariffs
Water Steps (1kl = 1 000 litres)   Level 4 (2017/18)                  Level 6 (2017/18)
                                   Until 31/1/2018 Rands (incl VAT)   From 1/2/2018 Rands (incl VAT)

Water                              R27, 97                            R57

Sanitation (standard)              R21, 50                            R44, 18

*Sanitation charged to a maximum of 35kl

Domestic Full = Stand-alone houses
Domestic Cluster = Flats, sectional title units, cluster developments and gated villages
WATER AND SANITATION TARIFFS – 1 FEBRUARY 2018

        Schools / Sport Bodies / Religious Institutions / Charities Tariffs
Water Steps (1kl = 1 000 litres)   Level 4 (2017/18)                  Level 6 (2017/18)
                                   Until 31/1/2018 Rands (incl VAT)   From 1/2/2018 Rands (incl VAT)

Water                              R24, 72                            R57

Sanitation (standard)              R21, 50                            R44, 18

*Sanitation charged to a maximum of 35kl

Domestic Full = Stand-alone houses
Domestic Cluster = Flats, sectional title units, cluster developments and gated villages
WATER RETICULATION SYSTEM
              • 9,300km of sewer pipeline
              • 11,000km of water pipeline
              • 650,000 service connections

              • 821 staff fixing leaks daily
              • 800+ service requests daily
ACTIVE DETECTION & REPAIRS

 •   Dedicated leak detection team (Includes EPWP and Rand Water graduates)
 •   Creation of 75 new positions to reduce response times to burst pipes and meter faults /
     leaks.
 •   Injection of R22m into this programme this year to improve response time

      Vandalized hydrants and             Leak Detection in progress
      dumping in chambers
COMPARATIVE WATER LOSSES

 METRO                                  DWS REPORT (2013)              SALGA’s MBI (2015)
                             Water Loss %                   Water Loss %
 City of Cape Town               16 *                           14.7
 City of Johannesburg            36.5                           24.8
 eThekwini                       35.3                           38.2
 Ekurhuleni                      31.8                           33.9
 Tshwane                         22.9                           22.4
 Nelson Mandela Bay              32.4                           38.2
 Buffalo City                    37.1                           38
 Mangaung                        35.7                           28.3
 Msunduzi                                                       32.9
 Average of above                30.9                           30.2
 DWS & MBI Average               29.7                           27.9

National average for water losses as per the DWS “Strategic Overview of the Water Sector in
South Africa 2017” puts national average for water loss across municipalities at 36%.

*Cape Town water loss currently at 16%
Number of Bursts per Months

                           0
                                     200
                                           300
                                                  400
                                                             500
                                                                    600
                                                                           700
                                                                                       900

                               100
                                                                                 800
                  Jul-06
                  Nov-06
                  Mar-07
                  Jul-07
                  Nov-07
                  Mar-08
                  Jul-08
                  Nov-08
                  Mar-09
                  Jul-09
                  Nov-09
                  Mar-10
                                                                                                                 PIPE BURST STATISTICS

                  Jul-10
                  Nov-10
                  Mar-11
                  Jul-11
                  Nov-11

Burst per month
                  Mar-12
                  Jul-12
                  Nov-12
                  Mar-13
                                                                                             BURST WATER MAINS

                  Jul-13
                  Nov-13
                  Mar-14
Bursts/100km

                  Jul-14
                  Nov-14
                  Mar-15
                  Jul-15
                  Nov-15
                  Mar-16
                  Jul-16
                  Nov-16
                  Mar-17
                  Jul-17
                  Nov-17
                           0
                               10
                                      20
                                             30
                                                        40
                                                                   50
                                                                                 70
                                                                                       80

                                                                          60

                                      Bursts / 100km / year
PRESSURE MANAGEMENT
                                             -   Decreasing water pressure slows the rate at which
                                                 water runs from taps, protects the system from
                                                 pipe bursts, and reduces water losses due to
                                                 leaks
                                             -   The City has gradually been reducing water
                                                 pressure in a synchronised manner over the past
                                                 few months
                                             -   Switching water on and off is not an easy task, as
                                                 when the pipes are empty it takes time to fill them
                                                 up again and the risks of pipe bursts increases

•    More than 116 pressure management zones have been created

•    Design underway for further 29 pressures management zones

•    Throttling of bulk water valves is being done where benefits are identified

•    These zones are being optimised during this current drought

•    They are spread throughout the City and no specific areas are targeted

•    High lying areas likely to experience most reduced pressure
WATER MANAGEMENT DEVICES

A WMD replaces a standard water meter
and is programmed to provide a daily
allocation to use on your property.

•   Switches on at a fixed time each morning
    e.g. 4 am.
•   Restricts to 350 litres a day (10.5 kilolitres a
    month) – although a different amount can
    be agreed with City.
•   Switches off when the household has used its
    daily water quota.
•   Resets next morning to release daily amount.
•   Any amount not used is carried over to the
    next day during that calendar month.

Currently being installed on a mass scale
WATER MANAGEMENT DEVICES
• Up until end of 2016/2017 220 000 WMDs had been installed
• Approximately 22 000 WMDs installed since mid-September 2017
  focused on high water users
• Now being installed at rate of more than 2000 per week
• As of January all domestic properties using more than 10500kl/m to
  be fitted

                                                                       52
ENFORCEMENT

The water inspectorate continues
to issue fines for all water
restriction contraventions
Most common contraventions:
        Washing of vehicles
        Wasting of water
        Hosing down of paved
        surfaces
        Dampening of building
        materials

                                   18 permanent water inspectors
                                   20 EPWP law enforcement officers
                                   Additional staff being recruited
TREATED EFFLUENT RE-USE FOR INDUSTRY

•   More than 200 users have permanent
    connections
•   More than 70 Industries are collecting
    treated effluent
      at WWTW and standpipe points
•   Mostly used for irrigation and industrial
    purposes
      – Golf courses
      – City Parks
      – Schools
      – Farmers
      – Industries etc.
      – City Departments
Percentage

                    3.0%
                           4.0%
                                  5.0%
                                          6.0%
                                                 7.0%
                                                        8.0%
                                                               9.0%
           Jun-12
           Sep-12
           Dec-12
           Mar-13
           Jun-13
           Sep-13
           Dec-13
           Mar-14
           Jun-14
                                                                                                  TREATED EFFLUENT RE-USE

           Sep-14
           Dec-14
           Mar-15
           Jun-15

% Reused
           Sep-15
                                                                      % Treated Effluent Reused

           Dec-15
           Mar-16
           Jun-16
           Sep-16
           Dec-16
           Mar-17
           Jun-17
           Sep-17
           Dec-17
           Mar-18
           Jun-18
ALTERNATIVE WATER PRINCIPLES
•   Quality required for different uses – as per 1996 national guidelines.
•   Applications & licensing required for groundwater, surface water & treated effluent.
•   Imperative to prevent potentially dangerous alternative water from contaminating
    drinking water system on the premises and surrounding area. Reduced Pressure
    Zone (RPZ) valve back-flow preventer is mandatory.
•   Discharge to correct place – overflow to stormwater or to sewer if harmful
    chemicals or substances
•   Colour code the pipes
•   Put up the official ‘Do not drink’ warning signage – on City’s website

See Summary Guidelines for Installing Alternative Water Systems on City’s website for
more detailed information.
INSTITUTIONAL STRUCTURES
WATER RESILIENCE: SECTION 80 COMMITTEE

•   Mandate for creation by Council in May 2017
•   Mandate is to provide advisory services to the City’s Water Resilience
    Programme
•   Includes co-opted external experts
•   17 members
     – Reps from 4 Western Cape universities
     – Rep from DWS
     – Reps from Western Cape Provincial Government
     – Reps from business
     – Reps from civil society
     – Reps from neighbouring municipalities
     – Reps from and COSATU and FEDUSA
•   Meets once a month
NATIONAL DEPARTMENT WATER & SANITATION (DWS)

•   Continued engagements between City and DWS through Western Cape
    Water Supply System (WCWSS) to ensure consumption within restriction
    boundaries, and associated monitoring of usage.

•   DWS rep. serves on Section 80 Water Resilience Advisory Committee

•   Request to fast track Water Use Licenses and review of system allocations

•   Assistance with land management in catchment areas

•   Request to fast track Berg River to Voëlvlei augmentation scheme

•   Received funding of R8m from DWS and R20.8m from COGTA
FINANCIAL CONSIDERATIONS

                           60
FINANCIAL CONSIDERATIONS

•   Minister of Finance, as of 27 October 2017, has granted an exemption to the City from:
     – the provisions of regulation 72 ( c) of the Municipal Budget and Reporting Regulations (MBRR), and;
     – section 28(6) of the MFMA

•   Considerable efforts have been made in recent months to secure the required funding for the City’s
    Water Resilience Programme and to perform modelling exercises for future tariffs.
•   Sources identified include:
     – Cash
     – Existing Water Department budget, including reprioritization therein.
     – Concessionary funding, bonds and other finance options
     – Reprioritization of capital projects elsewhere in the City

•   The operational model of water as a trading service will be considerably impacted upon by a number
    of considerations related to the WRP actions, including:
      – loss of revenue from decreased water sales and
      – inability to cover new operational spend, particularly from 2018/19 onwards
•   There will inevitably need to be an entirely new approach to the water service going forward, with
    consequence for tariffs in future years, and consequently collection rates from consumers. Ongoing
    modelling required.
PREPARING FOR DAY ZERO
PHASES OF DISASTER PLAN

      PHASE 1                           PHASE 2                           PHASE 3
   Preservation                        Disaster                         Full-scale
   Restrictions                       Restrictions                       disaster
    (rationing)                       “Day Zero”                     implementation

 We are currently in Phase 1 with Level 6b in effect from 1 February 2018.
 Day Zero is set for 12 April 2018, unless water use drastically reduces across the City.
WHAT WE WANT TO AVOID

               See City’s website for
               updated FAQs and
               media releases for latest
               information
WHAT WE WANT TO AVOID
TOGETHER WE CAN
 AVOID DAY ZERO

    Let’s push it out further,
    together.
THANK YOU
You can also read