From crisis to resilience - how Cape town averted #DayZero - Presented at the City Resilience Conference Bangkok, Thailand
←
→
Page content transcription
If your browser does not render page correctly, please read the page content below
From crisis to resilience – how
Cape town averted #DayZero

Presented at the City Resilience Conference
Bangkok, Thailand

                                      11 July 2018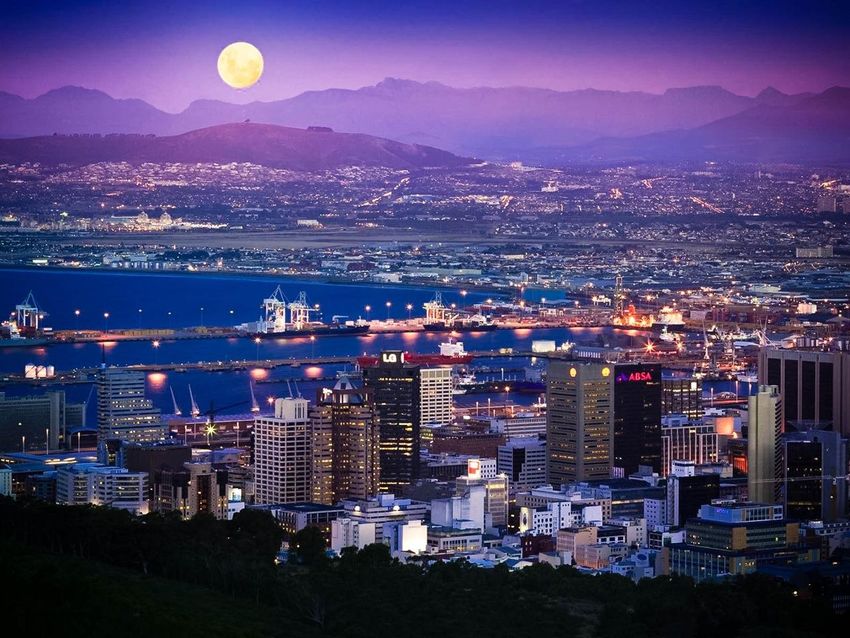
Disclaimer

This presentation is provided solely in connection with our support to the World Bank on the Cities Resilience Program.
Any liability PwC Polska Sp. z o.o. (PwC) will be governed by a contract agreed between IBRD and PwC. In the meantime,
this presentation is provided on the basis that PwC accepts no liability – whether in contract, tort (including negligence),
or otherwise – to the World Bank or to any other person in respect of the Cities Resilience Program.
This presentation must not be made available or copied in whole or in part to any other person without our express
written permission.

PwC
Contact information

      Agnieszka Gajewska                       Lukasz Stanecki                          Oliver Redrup
      Partner                                  Project Manager for World Bank City      Director
      Engagement Partner for World Bank City   Resilience Program                       PwC Asia Hub for World Bank City
      Resilience Program                       T: + 48 519 506 572                      Resilience Program
      T: + 48 517 140 537                      E: lukasz.stanecki@pwc.com               T: +65 8876 5274
      E: agnieszka.gajewska@pwc.com                                                     E: oliver.jw.redrup@sg.pwc.com

      Yogan Reddy                              Piotr Brysik                             Akshay Kumar
      Partner                                  Senior Associate, CDT member for World   Senior Manager
      PwC Africa Hub for World Bank City       Bank City Resilience Program             PwC Asia Hub for World Bank City
      Resilience Program                       T: + 48 519 507 194                      Resilience Program
      T: +27 83 276 3279                       E: piotr.y.brysik@pwc.com                T: +65 8876 7726
      E: yogan.reddy@pwc.com                                                            E: akshay.s.kumar@sg.pwc.com

      Jorge Seré
      Partner
      PwC Latin America Hub for World Bank
      City Resilience Program
      T: +598 988 84 015
      E: jorge.sere@uy.pwc.com

PwC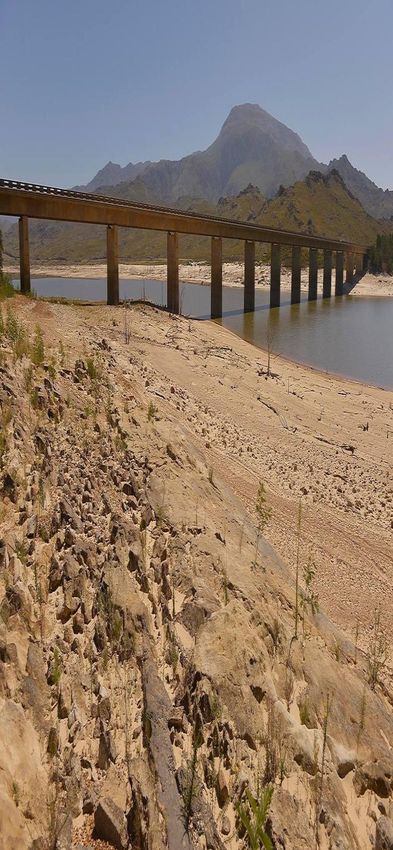
Presentation Overview

Section

    1     Cape Town: A World Class City
    2     Drought
    3     Dealing with the srisis
    4     Partnering in crisis
    5     Building resilience
    6     Critical lessons

                                          4
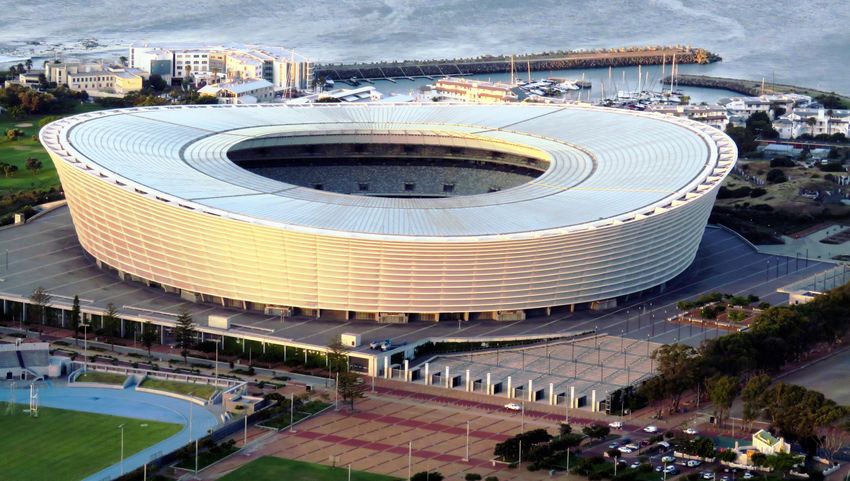
Cape Town: A World Class City

PwC                             5
South Africa’s mother city - Cape Town

                                                                     A top 100 livable City in
                                  Population 4.0 million
                                                                     the world and a top 10 City
                                                                     to visit
                                               Contributes 14% to
                                               South Africa’s GDP.

                                                    Piped water in 75% of
                                                    households. Average
                                                    consumption of 250 l/c/d

                                                                 6 major dams with a
                                                                 yield of 840 Mm3

                                                                                               6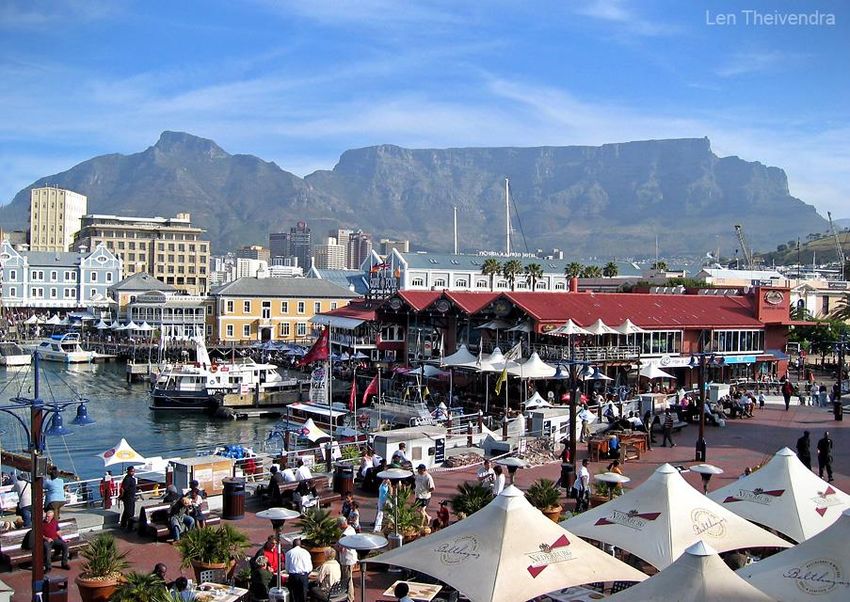
7
8
9
10
What’s driving cape town?

                            •    Population growing at almost 3% p.a
                            •    2000000 people added to the
        Accelerating
        urbanisation             population in the last 5 years
                            •    Preferred destination for internal
                                 migration as a result of perceptions
                                 about living standards

                        •       70 % of the population of working age
                        •       Unemployment level of 22% is lower
        Demographic
                                than national average
        shifts
                        •       Gini coefficient of 0.62 – high levels of
                                income inequality                                       ACTUAL DEMAND (MM3/YR)
                                                                            400
                                                                            350
                        •       Winter rainfall                             300
         Climate        •       500 mm of annual average rainfall           250
         change and     •       No descernable trends in variation
         resource                                                           200                                              23%
         scarcity
                                of weather, temperature or other                                                            growth
                                patterns                                    150
                                                                            100
                                                                             50

                        The time it takes to go from breakthrough             0
                        technology to mass market application is                  2004 2005 2006 2007 2008 2009 2010 2011 2012 2013 2014
        Technological   collapsing, re-shaping the economy at the same
        breakthroughs   time. Cities need to become smarter or they risk
PwC                     being left behind.                                                                            4
Western Cape Water Supply System
DAM Capacity
(mil m3)
Theewaterskloof Dam 432
Voelvlei Dam 158
Wemmershoek Dam 58
Upper Steenbras Dam 30
Lower Steenbras Dam 34
Berg River Dam 127
Total 839
PwCA well managed water supply system • Member of C40, Resilient Cities • Robust system of 6 dams supplying 99% of Cape Town’s water demand – system yield of 840Mm3 • Sufficient capacity in the systems to meet medium term water requirements until 2023 – under moderate growth scenario - 73% system utilization in 2014 • Berg River Dam completed in 2008 and feasibility studies for the next phase of augmentation completed in 2014 (TMG aquifer and 100 – 120 Ml/d desalination) • Compares favourably to international non revenue water benchmarks – 21% PwC
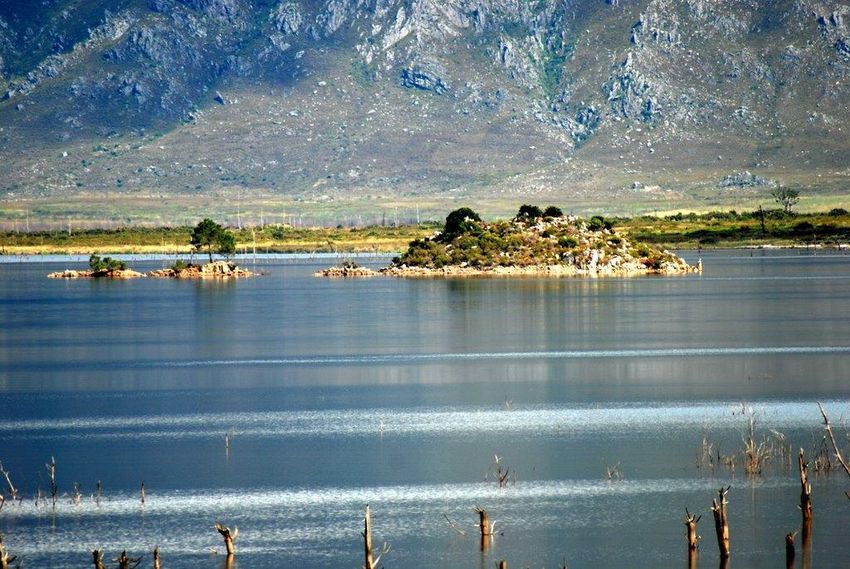
Drought

PwC       14
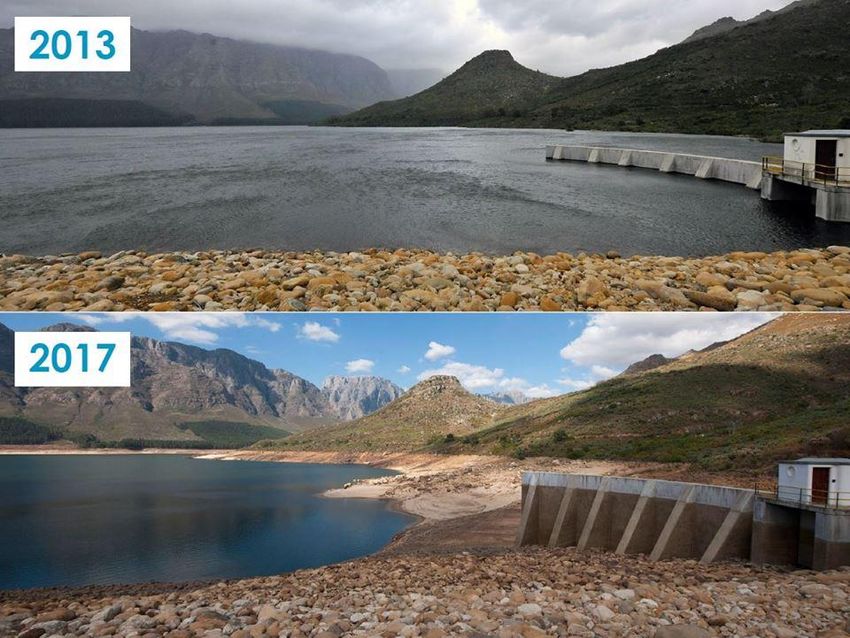
Droughts are difficult to predict

•   Above average rainfall in 2014
    and 2015 and 2017 were lowest
    recorded levels
•   3 consecutive years of below
    average rainfall represents a 1 in
    400 year event
•   Could the drought have been
    predicted the drought and
    responded quicker?

                                         15
16
17
18
Economic and Social Impact
$100 million 15%
Potential lost water sales revenue for the Drop in hotel bookings and
City accommodation
1% Revenue from wastewater
Impact on Western Cape economic treatment
growth rate
20% Declining wastewater quality
Drop in annual wine production – increased concentration of
contaminants
50 000 Pipe bursts in water system
Seasonal agricultural jobs lost as a result and increased blockages in
of the drought wastewater system
25% Small scale hydro generation
Proposed water tariff increase to fund outputs
drought
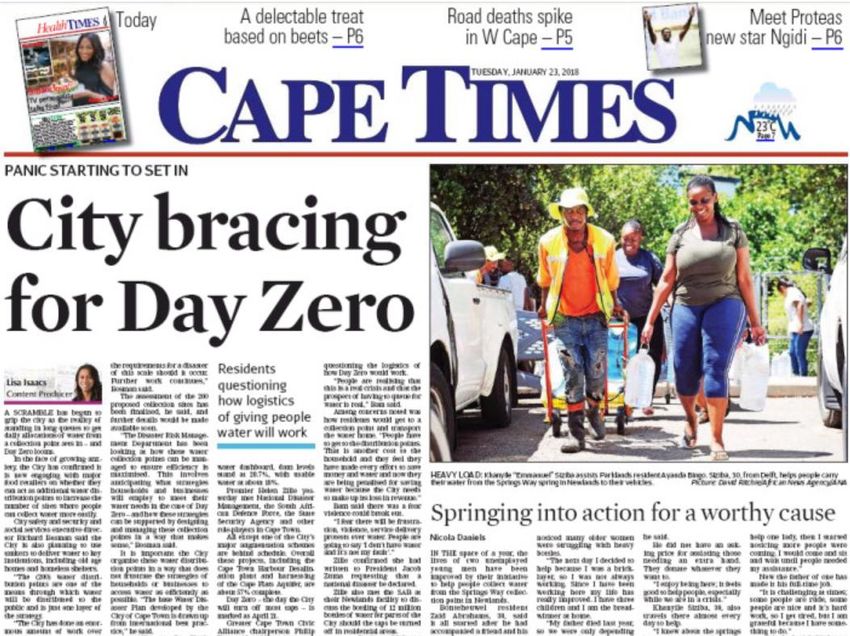
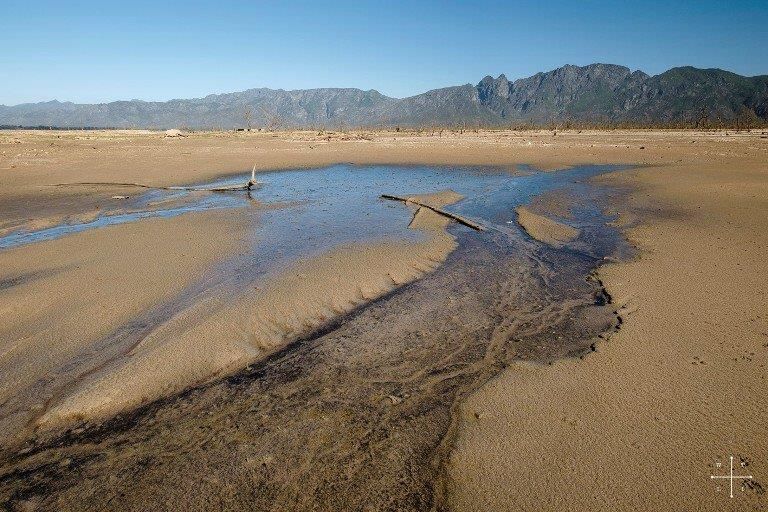
PwCMaking the drought real… PwC
Day Zero projections

PwC
Dealing with the crisis

PwC                       22
A comprehensive approach..

      • Leadership driven response. Executive Mayor
        took ownership of the drought programme
      • Developed a clear strategy – manage what is in
        our control.
      • Set up governance and implementation
        structures.
      • Coordinating committee chaired by the City
        Manager
      • Integrated City response – not just driven by
        water department
      • Augmented capacity with technical, financial,
        social, environmental expertise

PwC
Manage Demand
Reduce water demand
from above 1000 Ml/d
to 450 Ml/d to delay
Day Zero
24Restrictions
• Ramped up restrictions to level 6B - households
restricted to 35o l/day – equivalent of 87 l/c/d
• Average per capita consumption in Cape Town prior to
the drought – 270 l/c/d – 30% higher than the
international average
• What did this mean?
No watering garden, washing cars, use of hose pipes
No filling swimming pools
• Installation of flow restriction devices for non compliant
households
• Commercial and industrial consumers were required to
reduce usage by 40% from baseline
Hotels – removed bath plugs, water efficient behaviors
Employed more efficient practices, sunk boreholes, etc.
DWS restrictions on agriculture in WCWSS
PwCLeveraging technology
• Installed pressure management valves in 25
water supply zones
• Reduced flow in the network – reducing
consumption. minimized physical losses and
night flows
• Estimated savings of 30 Ml/d
• Installing water metering devices (WMDs) to
manage quota and facilitate more efficient
meter reading
• Leak detection and early response to issues on
the bulk system
• Used social media platforms for leak reporting
• Leak repairs and flow control in indigent
households
PwCStricter Enforcement
• Strengthened city bylaws to implement tighter
restrictions
• Issuing of significant fines for consumers
exceeding quotas. Admission of guilt set at
R1500 and fines adjusted based on
transgressions
• Empowered city law enforcement officers to
deal with water transgressions
• Installation of flow restriction devices for non
compliant households
• Improved response times to reported bursts
• Registering of boreholes
• Use of self and peer regulation
PwCPunitive tariffs
Residential Water Tariffs
• Drought tariffs to assist recover
Water Steps Level 6 (2018/19) Level 4
revenue shortfalls Rands (incl VAT) per (2017/18)
kl
• Set punitive tariffs for high
consumption – approximately $70/m3 Step 1 (>0 ≤ 6 kl) R33.24 R4.56
(free for indigent
for consumption over 30 m3/month households)
• Fixed and variable components to the Step 2 (>6 ≤ 10.5 R52.90 R17.75
kl) (free for indigent
tariffs – charge dependent on the size households)
of the meter Step 3 (>10.5 ≤ 20 R115.00 R25.97
kl)
Step 4 (>20 ≤ R345.00 R43.69
35kl)
Step 5 (>35 ≤ R920.00 R113.99
50kl)
Step 6 (>50kl) R920.00 R302.24
PwCPlacing water at the top of mind
• One of the most effective drought
campaigns
• Scaled up from education and awareness
to focusing on day-zero
• National awareness campaign
• Multiplier effect - integrated into business
communication strategy
• Water conservation became part of daily
conversation
• Use of social media
PwCIntense focus on Day Zero PwC
What can be achieved when people work together

 Results
 • Reduced demand
   to approximately
   480 Ml/day – 50%
   of 2014 demand
   levels
 • Helped push out
   Day Zero beyond
   2018

PwC
Augmenting supply

                    Introduce 350 Ml/d of
                    new water into the
                    system

                                            32
Ground Water
• Potential 150 Mld from variable and
permanent augmentation
Cape Flats Aquifer 80 Ml/d
Atlantis Aquifer 20 Ml/d
Table Mountain Group Aquifer 50
Ml/d – deep abstraction +/- 900 m
• Risk of over abstraction and saline
intrusion
• Environmental impacts – TMG in
environmentally sensitive area. Process
delayed as a result of EIA – drilling
footprint, widening of road, run off to river
• Potential 10 Ml/d from springs and rivers
(Newlands, Oranjezicht and Lourensriver)
PwCWater reuse
• Temporary 10 Ml/day reuse plant –
supplying industrial quality water to
industries – at reduced prices
• Potential permanent reuse potential of
60 Ml/d
• Industrial use
• Recharge aquifers to prevent saline
intrusion
• Diverting upstream of the dams
PwCDesalination
• 7 potential short term sites – 3 commissioned and
contributing 14 Ml/d into the system (Strandfontein,
Monwabisi and V&A)
• PPPs – build, own operate and transfer – 3 year.
Short term solution was not cost effective –
economies of scale, contracting period constraints
• Longer term 100 -120 Ml/d desalination capacity
planned for 2021
• Key requirements for locating the desalination
plant/s
• Availability of electricity capacity
• Connecting infrastructure for bulk water supply
• Abstraction and brine injection points
(environmental impact – salinity, temperature,
etc.)
PwCImplementation timeframes PwC
Contingency Planning
What if the taps run
dry?
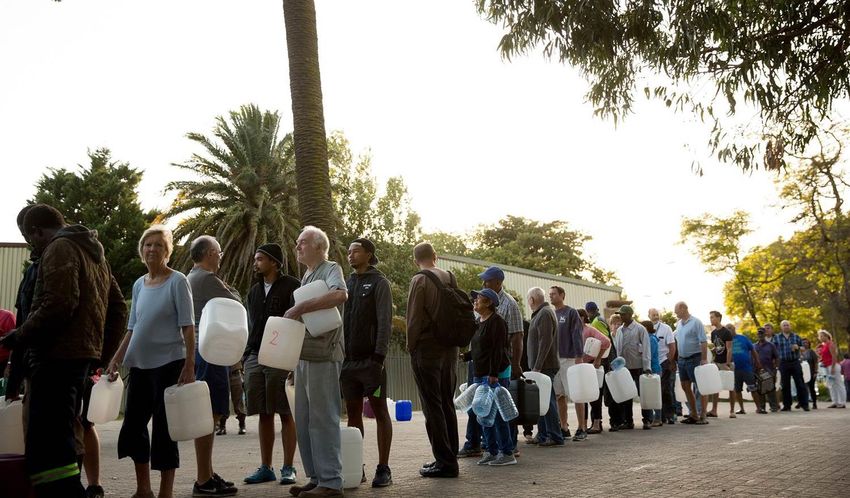
37Planning for disaster
• At 13.5. % of dam capacity –
abstraction is no longer possible and
the taps would run dry
• Day zero – a moving target
• Households will be disconnected
from the system and supplied
through 200 POD sites throughout
the city
• Citizens collect 50 l/p/d
• Risks to socio economic stability –
civil unrest, disease, sanitation
system shutdown
PwCPwC
Challenges in dealing with the response
• Fragmented institutional landscape – who is responsible for the drought response?
• Keeping the City running while dealing with the drought.
• Procurement frameworks are relatively rigid
Insufficient provision for emergency procurement
Constrained to the medium term expenditure framework
• Working within environmental constraints
• Time consuming – little relaxation on requirements
• No provision to relax standards in the case of an emergency (desalination abstraction and
discharge, drilling in sensitive areas, etc.)
• Public pressure – intense scrutiny from all spheres, desire to see something happening, separating self
interests from genuine offers of support
PwCPartnering in crisis PwC 41
A coordinated response

 General Public
                                     Business Response
   • Installed water tanks for
                                     • Platforms and structures to work with the
     rainwater harvesting
                                       City
   • Grey water systems to reuse
                                     • Reduced water usage - water efficient
     water
                                       practices, relocating operations, water reuse
   • Swimming pool evaporation
                                     • Off grid solutions – drilled boreholes and
     covers
                                       deployed desalination plants – supplied
   • Switch to indigenous              surplus to neighbouring communities
     gardening
                                     • Built WCWDM in their business
                                       communication e.g airlines landing in cape
                                       town
     Civil Society                   • Technology innovation and solutions to deal
       • Funding of infrastructure     with the water crisis
       • Supporting research         • Funding facilities for infrastructure
                                       development
       • Communication and
         awareness                   • Crop switching – more water resilient crops

                                                                                       42
Partnership with agriculture
• Generally an adversarial relationship between the farmers who
use 60% of the country’s water and other water users. In this
case:
• 150 farmers in Grabouw and Elgin regions built Eikenhof Dam
on the Palmiet River with private financing. The dam is not
linked to the Western Cape Supply System
• They operate the dam and associated systems through the
Groenland Water Users Association to manage stable irrigation
systems for the fruit farmers in the area (who create tens of
thousands of jobs).
• Infrastructure is well maintained and operated efficiently
allowing them to free up 10 Mm3 of their own allocation – to be
transferred into the Western Cape Supply System.
• Reallocation was pivotal in deferring day zero – postponing it
by a further 20 days.
43Building resilience PwC 44
Building Resilience

• Redefining the water supply mix - minimizing reliance on surface
   water . Potentially 30% of water could come from groundwater,
   desalination and reuse in the future
• Incorporating resilience into design standards and specifications.
   Old infrastructure designed for a 1 in 50 year drought. Investigation
   of implications revising standards to 1 in 200 years
• Building resilience into city planning
  • Building a compact city – 2017 Spatial Plan - promoting
     development around transit routes – Blue Zone. Strict
     requirements in other areas
  • Building standards – water efficient fittings, garden size, etc.
• Off grid solutions – a growing proportion of houses are installing
   rainwater tanks and grey water systems
• Living the new normal – citizens are now water wise and efficient
   practices and behaviors are likely to be entrenched.
                                                                           45
Critical lessons PwC 46
Critical lessons
• Keep your eye on the long term plan. Don’t let the crisis solutions derail long terms sustainable plans.
• Find solutions to the immediate crisis but not at all costs:
Have a clear, well considered and robust plan to deal with the crisis. Consult and socialize the plan.
Stick to the plan.
Don’t compromise on environmental sustainability
Don’t burden citizens with future costs because of poor choices or unsustainable solutions
Don’t breach governance – policies and legislation – no matter how desperate the situation gets. These
are general robust enough and are there for a purpose.
Don’t bow to public pressure. Everyone becomes an expert in crisis.
47When is the right time to plant
a tree?
“The best time to plant a tree was 20
years ago. The second best time is
now.” – Chinese Proverb
THANK YOU!
48You can also read