Guide to ICT Carbon Footprint measurement tool
←
→
Page content transcription
If your browser does not render page correctly, please read the page content below
Guide to ICT Carbon Footprint measurement tool
                 Contents

    Introduction .......................................................................................... 1
    Approach .............................................................................................. 1
    In Summary ........................................................................................... 2
    7-step guide to measuring carbon footprint of ICT ............................................. 2
    Gathering the ICT carbon footprint data......................................................... 3
    Next steps ............................................................................................ 5
    Visualising ICT Carbon Footprint data ............................................................ 6
    Case Study: Linkoping public administration, Sweden ......................................... 8
    Annex A .............................................................................................. 11
    Annex B .............................................................................................. 12

Introduction
The aim of this ICT Footprint measurement tool is to develop a method and technique which is flexible
and complementary to existing methods that cities already use. It draws on existing international
                                                                                1
standards and methodologies (such as the ITU‘s L.1400 recommendations , GHG protocol, the
Carbon Disclosure Project, as well as standards from International Bodies such as ISO14064) to
enable cities to measure, compare and report on ICT’s direct carbon footprint at a city level.

This tool is complimented by an online visualization tool to allow comparison of metrics across a
specified time period, thereby supporting cities to evaluate their status in meeting the Green Digital
Charter target of 30% reduction of CO2 emissions on ICT equipment over 10 years.

This ICT carbon measurement process provided in this document can be used by anyone. The
visualization tool described can only be used by signatories of the Green Digital Charter
(www.greendigitalcharter.eu) who have login access to the Green Digital Toolkit.

Approach
By following the 7-steps guide below, a City / Municipality can measure aspects of their ICT Footprint
and analyse the results. The ICT Carbon Footprint measurement tool should be viewed as an
iterative process, added to, or refined as local ICT records, relating to both equipment owned, or used
(eg. outsourced services; 3rd parties who may attach their own ICT devices) by a City are identified,
and/or authoritative data on energy usage for all ICT devices are published.

It is therefore recommended that a City’s first attempt at measuring their ICT Footprint should be
based on a self-contained Department which has a good record of their ICT assets. Once they have
an ICT Footprint ‘score’, this should also identify where there are gaps and how they might refine the
process. Especially in relation to equipment where there is no published energy rating, or possibly
where on the first pass an estimated figure was used and subsequently an Agency (such as the ITU
or Energy Star) has updated/expanded their energy / CO² database for ICT equipment.

1
   The L.1400 series of recommendations published by the International Telecommunications Union (ITU) presents general principles on
assessing the environmental impact of information and communication technologies (ICT) and outlines the different methodologies that are being
developed, namely:
L.1410 Environmental impact of ICT goods, networks and services
L.1420 Environmental impact of ICT in organisations
L.1440 Environmental impact of ICT in cities (expected in 2012-2013)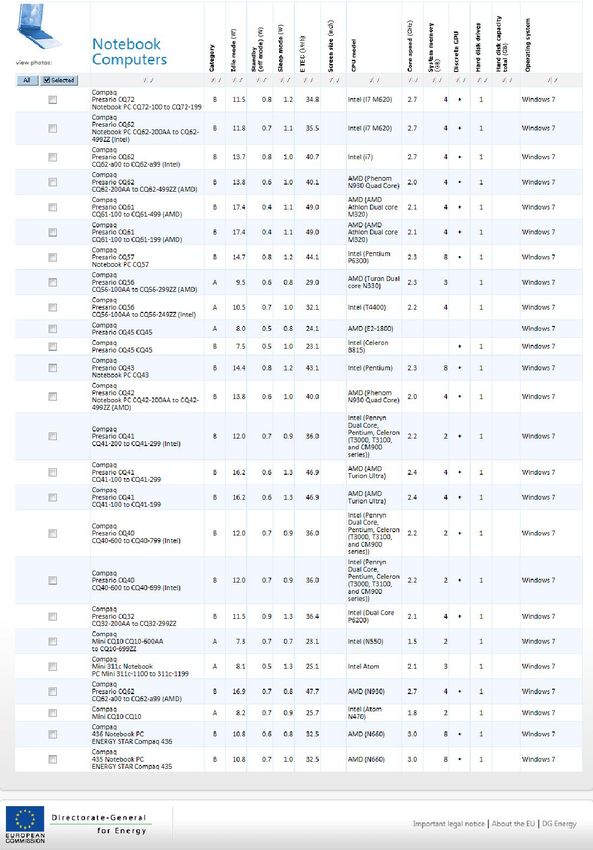
In Summary
7-step guide to measuring carbon footprint of ICT
This guide describes a process for cities to capture their energy data. This data can be
collected in table format for city analysis. An example table is provided below.
ICT Carbon Footprint measurement tool v.1
Power Total power CO₂
usage Annual unit Number consumption emissions
Organisational Scope Operational Scope Time in Use Time on Standby Switched off (watts) consumption of units pa. Total Cost (%)
Pence per
Detail City Depts. Categorise ICT Assets (hours per year) (hours per year) (hours per year) in-use standby switched off (kWh) (kWh) (kgCO2e)
kWh
Device Type 12.5 0.5246
Example - Finance HP LaserJet printer 350 8410 0 550 7 0.4 251.37 6 1508.22 £ 188.53 131.87
Example - Finance Laptop - type 1 1840 460 6460 65 18 0 127.88 24 3069.12 £ 383.64 67.09
Example - Finance Desk top - type a 1840 1380 5540 60 5 0.5 120.07 10 1200.70 £ 150.09 62.99
Example - HR HP LaserJet printer 320 160 8280 550 7 0.4 180.43 3 541.30 £ 67.66 94.65
Your city details here £ - -
£ - -
£ - -
£ - -
£ - -
£ - -
£ - -
£ - -
£ - -
£ - -
£ - -
£ - -
Totals £ - £ -
Figure 1: An example table for gathering ICT carbon footprint data
Key outputs from this data can be uploaded into a visualization tool on the Green Digital
Toolkit using the spreadsheet provided
(http://www.greendigitalcharter.eu/nice_toolkit/documents/Template.csv).
This spreadsheet captures the essential data for tracking the ICT carbon usage over time
namely:
Asset
Number of unit
Uptime (hours)
Standby (hours)
Downtime (hours)
Consumption (kWh)
CO2 emissions (kgCO2e)
Total Cost (your preferred currency or Euros)
The data is plotted into a graph and provided in summary as a snapshot for analysis.
Figure 2: App for Visualizing ICT carbon footprint data over time
Gathering the ICT carbon footprint data
Step 1 – Organisational Scope – as stated in Recommendation ITU-T L.1420, “the organizational
boundaries define which parts of the organisation to include in the energy consumption or emissions
assessment (eg. main units, subsidiaries, joint ventures etc)”, adding that irrespective of the approach
chosen, ICT organisations should take into account all facilities used for the operation of the
organisation, whether owned or rented.

Therefore at the outset of any ICT Footprint Reporting task, a City must firstly define / agree the
                             2
boundaries of the departments that are to be included (and excluded) from the City/Municipality’s ICT
Footprint.

Note: the data is best captured at a departmental level; thereby encouraging greater accountability for
departmental footprints as well as ownership and accountability for a reduction plan manageable
within a defined area of responsibility.
                                                                 3               4
Step 2 – Define the Assets - gather data on the type and number of ICT devices to be included
(NB. initial estimates can be refined with further ICT devices, improved analysis of device types, or
other factors such as a cooling for high end devices).

Step 3 – Estimate – how much time in hours, on average, an asset is in use and is on standby, on an
annual basis.

Step 4 – Count / Calculate – how much energy, in terms of kilowatt hours (kWh) each asset type
uses, both when in use and on standby.

Energy use as duration
Calculating energy usage of ICT equipment can be either estimated as a rough guess or carefully
measured based on the resources available to the city. At the very least, a city can use its energy
bills and an estimation of working hours to calculate the period of time used by ICT equipment,
categorized by when in use, on standby and off. Tools are also available to monitor equipment on an
IP network to establish their on/off/standby status. One such tool (EasyArp) has been developed for
the Green Digital Charter and is available from the Linkoping administration in Sweden in the Green
Digital Toolkit.

Energy use by asset type
Currently there is no single source of trusted data on actual usage of energy by the wide range of ICT
equipment used in cities. Cities are therefore developing their own methods for calculating energy
usage (see Linkoping case study in this document). Products are available which will calculate the
energy of equipment using ‘plug in’ monitors. Cities are encouraged to share the data they are
capturing on energy use of ICT equipment with each other.

There is a European version of the Energy Star database (www.eu-energystar.org/en/database.shtml)
where energy consumption data for office and related ICT equipment can be used. This is mainly
restricted to office ICT equipment e.g. desktop and notebook computers; workstations; small-scale
servers; monitors and imaging equipment. There are two ways in which the Energy Star database
can be deployed. The more time consuming, but accurate way is to extract the number of devices of

2 In the context of ICT Footprint Reporting, a “department” can be any function from a unit within the City council, to
a mainstream function, such as education (eg. schools) or health (eg. hospitals).
3 A list of equipment categories together with their energy use, energy cost and CO₂ Emissions complement the list

contained in the Annex of L.1420, and are reproduced in this document as Annex A.
4 The number of each type of device can be derived from an inventory list / asset register or an equipment audit

provided by a City / Department.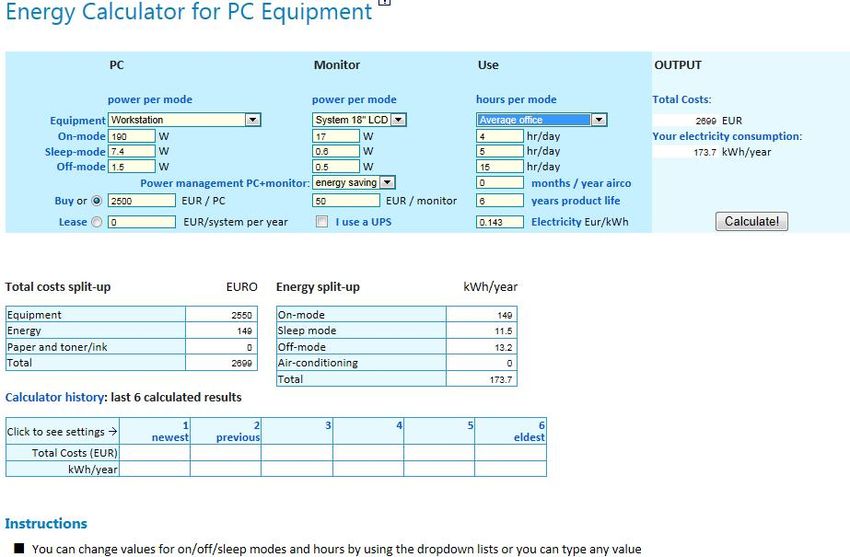
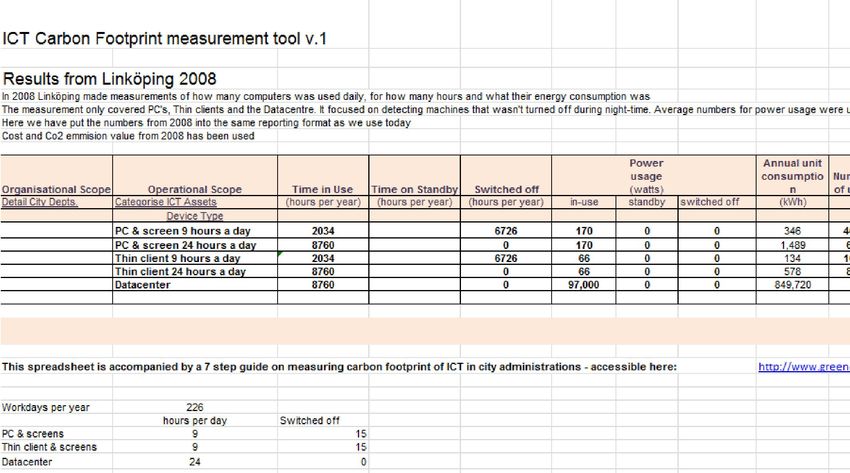
a specific make, type and configuration (eg. Compaq laptop with Windows 7), and ‘Search Database’
– see examples in Figures 3 and 4, below:

                          Figure 3: Energy Star database – Refine search

                          Figure 4: Energy Star database – Search results

Alternatively an approximation method can be deployed using the ‘Energy Calculator’ interface on the
EU energy-star website (see Figure 5, below). This enables a user (eg. a City) to assess the energy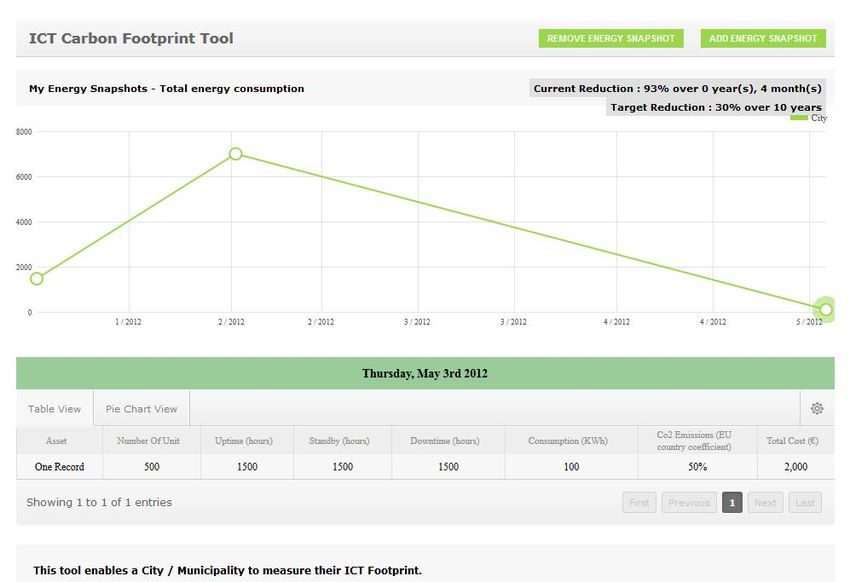
usage of a device by denoting equipment type (eg. Workstation, Multi-media PC, Imaging Equipment)
and its Usage profile (eg. “Average office”, “Never switched off” etc),

                               Figure 5: Energy Star database – Energy calculator

Step 5 – Convert the kWh units into a CO₂ rating (ie. kgCO2e) based on the energy conversion
factor for grid electricity published at a regional or country level (in the UK this conversion factor is
        5
0.5246 ). NB. this figure could also influenced by the energy source (eg. this can be ‘top-down’
average for a City, or alternatively a ‘bottom-up’ approach based on knowledge of energy sources).

Note : to convert watts (ie. electrical power) into kilowatt-hour (kWh), the formula is “Energy (E) in
kilowatt-hour (kWh) is equal to the power (p) in watts, multiplied by the time period (t) in hours divided
         6
by 1000” (for example: what is the energy consumption in watt-hour when the power consumption is
5000 watts for time duration of 3 hours?). Answer : E = 5000W × 3h / 1000 = 15 kWh.

Step 6 – Summarise – the findings by Department and City, as appropriate.

Step 7 – Action Plan – detail the actions planned, or need to be undertaken and what effect these
will have, and by when, on the City’s ICT Footprint.

Next steps
Cities are advised to repeat the 7-step plan across departments until an overall assessment of the city
administration’s ICT carbon footprint can be made. It is recommended that the 7-step plan is refined,
developed and repeated as the action plans are rolled out.

5
    Based on UK government (ie. Department of Energy and Climate Change) GHG conversion factors.
6   http://www.rapidtables.com/calc/electric/watt-to-kwh-calculator.htm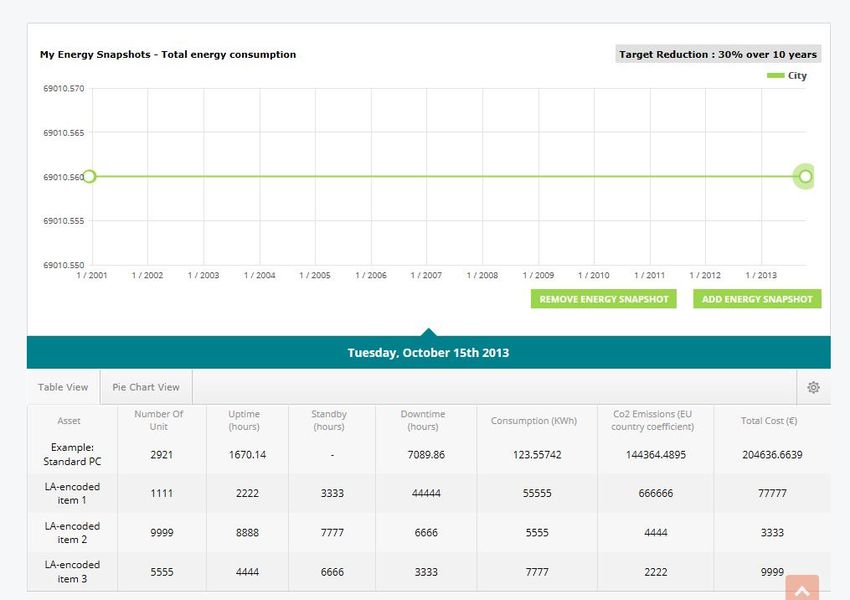
Visualising ICT Carbon Footprint data
Cities are advised to repeat the 7-step plan across departments until an overall assessment of the city
administration’s ICT carbon footprint can be made. When the data has been captured to a satisfactory
level, it can be uploaded into the Green Digital ICT Carbon Footprint Visualisation tool available on
the NiCE toolkit.

The data is shared via a simple spreadsheet.

Asset                  Number Of Unit Uptime         Standby   Downtime       Consumption     Co2 Emissions    Total Cost
Example: Standard PC              2921       1670.14 -                7089.86       123.55742      144364.4895      204636.6639

This spreadsheet should be saved in CSV format and uploaded via the online tool (NB: if not saved in
as a .csv file, the spreadsheet will not upload correctly).

                 Figure 6: Green Digital ICT Carbon Footprint visualisation tool – data upload

Once uploaded, the CSV spreadsheet data will be presented in graphical format.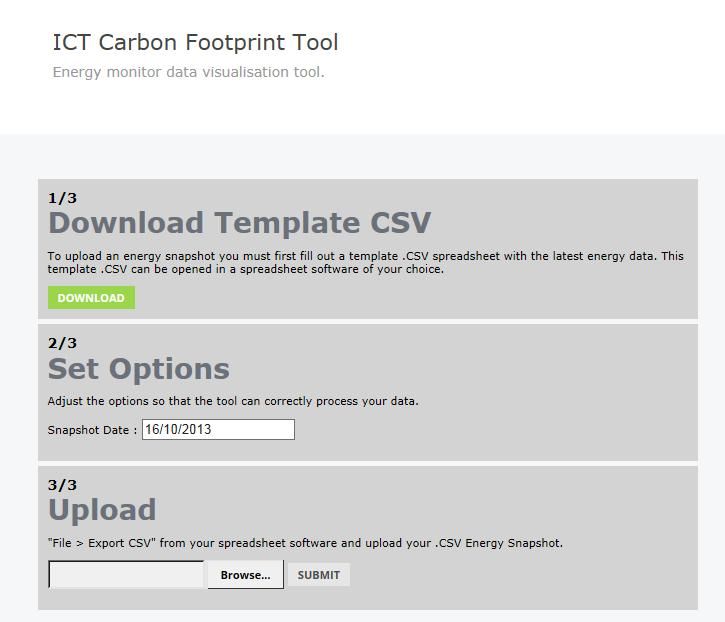
Figure 7: Green Digital ICT Carbon Footprint visualisation tool – data visualisation

The tool works best with 2 or more data uploads across time, to show the changing trajectory of ICT
carbon footprint data over time. The tool calculates the % reduction over a 10 year period so cities
can see how well they are progressing towards their target 30% reduction.

This visualisation tool should be returned to again and again by cities. It can be used both for
analysis and as a visual guide for presentations and political engagement.
Case Study: Linkoping public administration, Sweden
The Green Digital Charter team worked with the ICT Strategy team within Linkoping public
administration in Sweden to develop this ICT Carbon Measurement tool.

Linkoping used the 7 step guide and the spreadsheet provided to capture ICT asset data. This is an
account of their process.

Step 1 – Organisational Scope:
Linkoping already have an asset register in their city so they were able to cover all departments and
organisations that are served by their ICT department in the city and which use the city-wide IP
network.

Step 2 – Define the Assets:
Linkoping were able identify ICT equipment across the different departments including the data centre
itself. Since Linkoping manage ICT for all their schools, this included all PCs, laptops and tablets
used by students and teachers.

Step 3 – Estimate:
Linkoping tried to identify the energy usage of ICT equipment using Symantec utilities but there was a
bug in the software so they needed to try another method. They then looked at open source software
available on the internet, but no tools suited their purposes. They could identify what ICT equipment
was on via their IP network, but they could not work out how long the equipment was on for nor when
it was on standby and when it was off. Eventually they wrote a quick software tool themselves, called
EasyArp (now available as open source software), which uses ARP tables to identify what equipment
is on the IP network. ARP table is read every 30 min and the information stored in a database, on
which they could run queries. Since Linkoping use a strict naming convention for host names, they
were able to identify the type of equipment being used from the ARP tables and cross-reference it
with their asset register. The equipment was grouped into categories rather than by brand/make to
make the counting process faster and easier.

Step 4 – Count / Calculate:
Linkoping used the spreadsheet provided to capture the details of the ICT equipment and their time
on and off. They added rows and columns to improve their calculations as required. While there is
no standardized measure of the actual energy use of ICT equipment, Linkoping identified supplier
estimations of energy use and cross-checked this with their own measurements using physical ‘off the
shelf’ plug in monitors. They identified energy use factors for each category of ICT equipment.

Step 5 – Convert:
Linkoping have energy provision from renewable sources so they identified an energy conversion
factor in discussion with their national energy metrics team. This metric was included in the
spreadsheet to calculate CO2 emissions of the different categories of ICT equipment. The energy
use of the data centre was added in as a final item on the spreadsheet based on its energy usage per
quarter, found in its energy bills.

Step 6 – Summarise
Linkoping came to some interesting conclusions from looking at their data. Compared to a similar
measurement 2008 (Fig 5), they found that their CO2 emissions by 2013 (Fig 6) had dropped even
though the number of ICT assets they owned increased in the same period. They attributed this to
the more efficient ICT equipment, but also questioned the industry estimates on which they had based
their calculations.

Step 7 – Action Plan

Linkoping continue to refine their energy measurement data and are developing action strategies
based on their findings.
Figure 7: Linköping calculation of 2008 ICT carbon footprint measurements

.
Figure 8: Linköping calculation of 2013 ICT carbon footprint measurements

                                                                            Page 10
Annex A
List of goods to be considered when assessing the impact of ICT activities in organisations
(This annex forms an integral part of ITU-T L.1420 Recommendation, and has been reproduced from
the ITU-T document)
When emissions due to goods used by the organisation are concerned, the emissions from the
following types of goods may be considered. The following list is not exhaustive and shows typical
examples:
Desktops;
Laptops;
Cathode Ray Tube (CRT) screens;
Flat screens;
Individual printers;
Cables;
Network printers and copies;
Servers, switches and routers;
Fax machines;
Scanners;
Fixed phones;
Mobile phones;
Personal Digital Assistants (PDA) and tablets;
Projectors;
Videoconference installations;
Televisions;
Cooling systems for ICT goods;
Other small ICT goods;
Outsourced ICT goods, in particular outsourced datacentres;
Power supply back-up generators.
It should be noted that these generators systems have to be dedicated to the ICT goods in this list.
Otherwise an allocation approach would need to be used if the generators system is used for more
than the ICT goods. The same remark applied for the cooling systems for ICT good mentioned above.
Page 11Annex B
EU ENERGY STAR qualified office equipment
EU database description
This EU Energy Star database (www.eu-energystar.org) contains only products that are available in
the EU. It is based on the US EPA database (for products available in the EU) plus products that are
directly registered with the EU, managed by the European Commission. For (legal) disputes the lists of
qualified products downloadable from the above website (for the EC) and from www.energystar.gov
(for the US) are applicable. The database is intended to make the registered products more
accessible.
The database shows energy consumption and main performance data as supplied by the
manufacturers. Pictures (100 x 100 pixels) and brand-specific websites (if available) for the most
recent models of ENERGY STAR qualified equipment are added.
How to Use
Click on one of the main categories in the right menu or in the dropdown-menu above.
A selection form for the category will appear, allowing you to select various product features.
You can also limit your query by choosing product-specific ATTRIBUTES and specific
BRANDS. If none are selected, then all models will be shown. The total number of models in
your selection is indicated in the Results line.
After pressing the Search Database button a table containing the models in your selection will
appear. The data-rows in this table can be sorted in ascending or descending order on a
maximum parameters in the headers by clicking red (first sort order) and blue (second sort
order) triangular buttons.
To view Pictures and website-URLs of selected models (only recent EU), use the checkboxes
at the beginning of each row and then click the View button at the top of the first table-column.
You will then see the new table with just the selection and the pictures.
To return to previous tables use the Back button at the top of the page.
End
Page 12You can also read