REAL-TIME MACHINE HEALTH MONITORING SYSTEM USING MACHINE LEARNING WITH IOT TECHNOLOGY
←
→
Page content transcription
If your browser does not render page correctly, please read the page content below
MATEC Web of Conferences 335, 02005 (2021)                            https://doi.org/10.1051/matecconf/202133502005
14th EURECA 2020

      Real-time Machine Health Monitoring System
      using Machine Learning with IoT Technology
      Tzen Ket Wong1, Hou Kit Mun1,*, Swee King Phang1, Kai Lok Lum1 and Wei Qiang Tan2
      1Taylor’s University, 1, Jalan Taylors, 47500 Subang Jaya, Selangor, Malaysia
      2GoAutomate   Sdn Bhd, 33, Jalan Pentadbir U1/30, Taman Perindustrian Batu 3, 40150 Shah Alam,
      Selangor, Malaysia

                    Abstract. Machine health monitoring is the main focal point for now as
                    many industries are evolving to industry 4.0. Industry 4.0 is the revolution
                    in industrial that involve the Internet of Things (IoT) and artificial
                    intelligence toward automation and data sharing for production efficiency
                    improvement. The existing established methods for machine health
                    monitoring were not in real-time and there was no real-time correction of
                    data from the load and processing of data on the computer. In tracking
                    machine health efficiency this approach wasn't very successful. Real-time
                    machine health monitoring can improve overall equipment effectiveness
                    (OEE), reduce electricity consumption, minimize unplanned downtime,
                    and extend machine lifetime. In this research paper, we propose to design a
                    real-time machine health monitoring system using machine learning with
                    IoT technology that can analyze the supply balancing condition on a 3-
                    phase system. This system is built with compact physical hardware and can
                    capture the electrical data from the load then send it to the server. The
                    server will progress data and train the data using machine learning. The
                    system was installed on a blender machine in a factory. In this research, a
                    system which is able to monitor the machine operation and classify the
                    operation stages of the machine was developed. Besides that, the system
                    also capable to monitor the load balancing condition of the machine.

      1 Introduction
      Most of the industry nowadays is evolving to industry 4.0 and need to adopt the internet of
      thing (IoT) technology to keep competitive. Industry 4.0 is the movement towards
      automation and data sharing in industrial technology and processes that include the IoT, the
      Industrial Internet of Things (IIOT), cloud computing, and artificial intelligence. Artificial
      intelligence is capable of performing tasks that substitute human intelligence, which can be
      known as machine learning. Last decade, machine health inspection is highly relying on
      human power. Consequently, there will be more automation technology in the factory for
      machine health inspection to reduce human power.
          Based on the research by G.K. Singh and S. A. S. Al Kazzaz [1], they had developed an
      intelligent diagnostic system using the C++ programming language and MATLAB for

      *
          Corresponding author: houkit.mun@taylors.edu.my

© The Authors, published by EDP Sciences. This is an open access article distributed under the terms of the Creative Commons
Attribution License 4.0 (http://creativecommons.org/licenses/by/4.0/).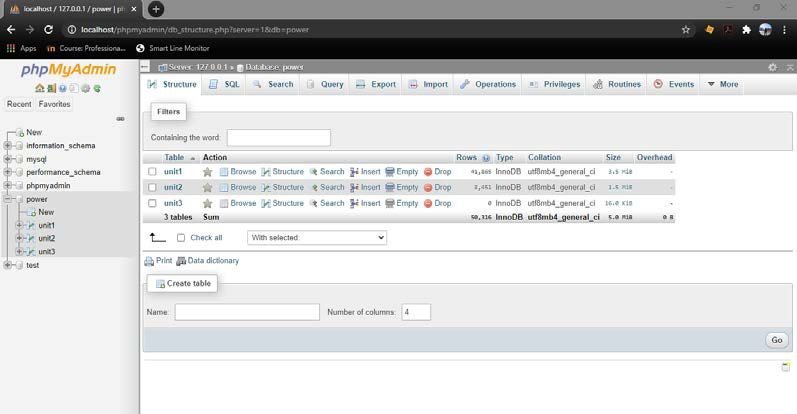
MATEC Web of Conferences 335, 02005 (2021)                  https://doi.org/10.1051/matecconf/202133502005
14th EURECA 2020

     induction machine health monitoring in 2008. This intelligent diagnostic system unable to
     perform real-time monitoring. The architecture of this machine learning is a multi-layer
     feed-forward neural network, which needs many machine’s input parameters for model
     training. That paper introduces 17 different models to diagnose the health of the machine
     and the final system able to detect the machine’s fault with efficiency range from 81.8% to
     100% for different types of faults and conditions as shown in Table 1. In the current times,
     most of the high cost industrial motors have pre-installed with some sensors such as
     vibration and temperature sensors inside the machine to monitor the motor behavior and
     trigger a warning signals or shutting down the system for preventing any catastrophic
     failure [2].

     Table 1. Diagnostic efficiency of different machine conditions. [1]
                                    Phenomena                                   Diagnostic
                                                                                Efficiency
           Condition detection      Supply condition                              100%
                                    Supply harmonics                              100%
                                    Machine health                                100%
           Fault classification     Supply unbalanced                             100%
                                    Bearing faults                                 95%
                                    Mechanical unbalances and coupling faults      95%
                                    Over/under voltage                             95%
           Fault level estimation   Supply condition                              87.5%
                                    Supply harmonic                               92.3%
                                    Dry bearing fault                             81.8%

         Other than that, voltage unbalanced at motor stator terminals leads to a shorter life span
     of the system and deterioration of its output due to increased losses, unbalanced line
     currents, and excessive heating [3]. For larger three-phase motors, they will draw
     equivalent power from each phase of the three phases in the main supply, however, this
     situation will not happen frequently. Unbalanced supply and harmonics can lead to
     instability of the motor in which will reduces its efficiency and lifespan. Unbalanced in
     single-phase loads may also cause malfunctions [4]. Therefore, the system in the research
     was designed with the feature that able to detect the unbalanced supply.
         The 3-phase system is separated into balanced and unbalanced systems. In an ideal
     balanced system, the waveform is perfectly sinusoidal, the magnitude and phase shift of
     120 $ or T/3 is different, as shown in Figure 1. Besides, the current flowing through each
     phase is the same and no current flows through the neutral. Furthermore, the power loss is
     very low or has no presence in an ideal case. However, most of the system or loads are
     unbalanced systems and it is easy to achieve an unbalanced system where either phase A,
     phase B, or phase C have different loads on each other’s phase. Two main factors cause an
     unbalanced system. The first is unbalanced in the winding of 3-phases equipment like a 3-
     phase induction motor. The reason for this is that if the reactance of the three windings is
     different then it will draw unequal current from the system. The second factor is the
     unequal load on the system. This will cause more current to flow through one particular
     phase. Both factors will cause the 3-phase machine to overheat and decrease its overall
     lifespan. Other than that, this will also cause power loss as known I 2 R [5].
         Furthermore, the machine health monitoring system is very popular now and has
     attracted many researchers to research in this field. Most of the methods that were used for
     machine health monitoring system mainly focused on the motor fault, such as stator [6],
     rotor bars [7], static and dynamic air gap [8], bent shaft, misalignment, bearing and gearbox
     failures [9]. All these faults needed a specific sensor or calculation to detect it or some
     needed humans to analyze. Other than that, the vibration sensor also known as

                                                    2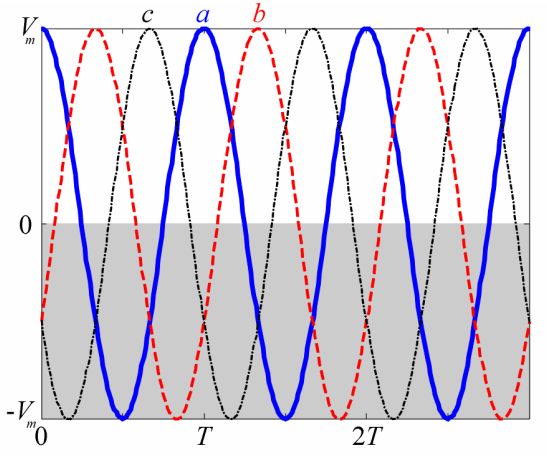
MATEC Web of Conferences 335, 02005 (2021)                https://doi.org/10.1051/matecconf/202133502005
14th EURECA 2020

     accelerometer was a common sensor for most of the researchers to use to detect the
     vibration signal to analyze the fault of the motor [10]. Micro Electromechanical Systems
     (MEMS) is an accelerometer that has merits of low-cost, high reliability, and low power
     consumption where compare to another accelerometer [11]. The limitation of this work was
     the data input was limited to one which was the MEMS accelerometer. Only using one
     input data to detect the electrical fault was not very reliable, although the result was very
     close to the actual result. Other than that, this method only can diagnose a 3-phase
     induction motor which market usable to all industry. In addition, all the aforementioned
     machine health monitoring system were lack of wireless monitoring capability.

     Fig. 1. 3-phase sinusoid waveform.

        R. Udayakumar and V. Khanaa [12] developed a health monitoring system of electrical
     machines based on the wireless network (ZigBee/ IEEE 802.15.4). The limitation of the
     ZigBee is only a Wi-Fi transmission platform, it needs a transmitter and a receiver to
     complete the data transfer thought Wi-Fi. Other than that, the data still needs to be
     processed under a computer. The system still needs the physical wire to connect to the
     computer to progress the data. In this study, a completely wireless system is developed, and
     the machine health condition could be monitored anywhere as long as we have internet
     access with any electronic devices. Real-time data is important in order to make strategic
     business decisions. Instead of just weeks or months, product trends may need to be
     measured over days or hours.

     2 Methodology
     The whole research methodology was stated in the flow chart as shown in Figure 2, there
     have 4 different stages to follow the timeline of the entire project. In the first stage, the
     machine fault and machine learning were carried out to do more research work and more
     understand the structure. Come to the second stage, the circuit construction of the physical
     hardware was carried out. The final electronic components that were selected for this
     research were the ESP 01 as the Wi-Fi module and PZEM-004T V3 as the sensor to capture
     the electrical data. At stage three, the accuracy of the sensor was carried out and the
     accuracy was up to 95% accurate compare to multi-meter. Lastly, stage four was machine
     learning development and present all the outcome of this research project. The result was
     present on the webpage and can monitor the machine data in real-time.

                                                   3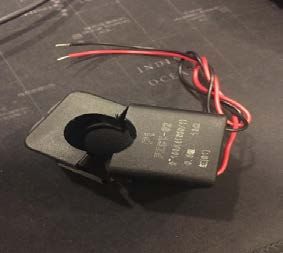
MATEC Web of Conferences 335, 02005 (2021) https://doi.org/10.1051/matecconf/202133502005
14th EURECA 2020
Fig. 2. Flow chart of the research methodology.
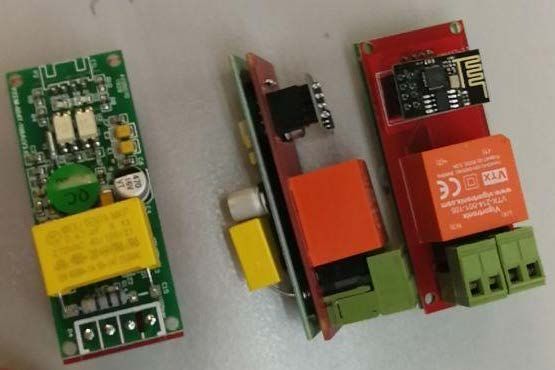
2.1 Setup for hardware
The setup of this research was only two modules which were the sensor and the current
transformer (CT). First, connect the line and neutral line to the sensor then the CT clip on
the life wire of the load. Second, wait for the sensor to power up then connected to the Wi-
Fi. The complete physical model of the sensor was completely constructed as shown in
Figure 3.
(a) (b)
Fig. 3. The complete circuit of the physical hardware (a); Current transformer of this system (b)
4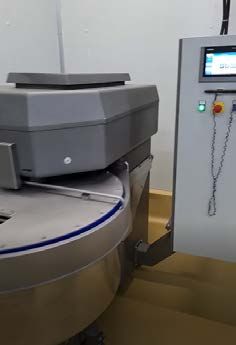
MATEC Web of Conferences 335, 02005 (2021)                    https://doi.org/10.1051/matecconf/202133502005
14th EURECA 2020

         The actual machine set for this paper was the three-phase blender machine as shown in
     Fig 4, the machine was in the factory provided by GoAutomate Sdn. Bhd. Three sensor
     already installed inside the blender machine due to the blender is three-phases supply and
     the data cable to capture in the visual machine. The data captured every 2 seconds and save
     in the database. The visual machine is also provided by GoAutomate Sdn. Bhd.

     Fig. 4. Three-phase blender machine

     2.1 Artificial neutral network

         The neural network for load classification was created using Tensor-flow, by attempting
     to classify the stages based on the monitored data reading of several parameters, namely,
     the current, power, voltage and power factor of the stages during operation. The neural
     network is able to ‘learn’ by iterating across the training dataset to adjust the weights and
     biases in the neural network to achieve the desired output, an optimization function to
     define the cost or loss function as the network iterates. During the ‘training’ of the network,
     the network will have a loss or cost function to give a ‘score’ for itself in terms of the
     accuracy of the network. The ‘score’ or loss, is calculated by using the cross-entropy [13]
     of the known probabilistic distribution of a class and the generated probabilistic distribution
     output due to the soft-max function by the neural network. The overall visualisation of the
     neural network shape as shown in Figure 5.

     Fig. 5. Visualisation of the neural network shape.

                                                          5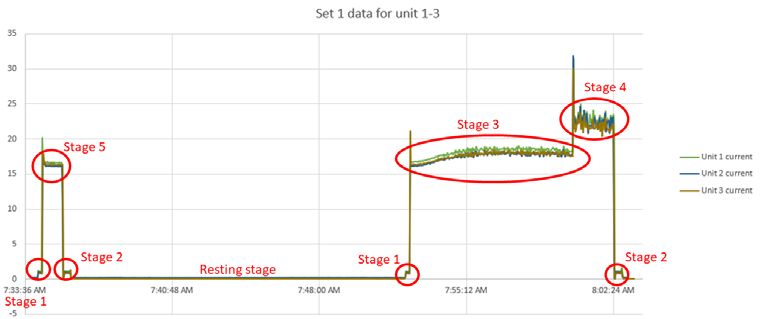
MATEC Web of Conferences 335, 02005 (2021)                https://doi.org/10.1051/matecconf/202133502005
14th EURECA 2020

     2.2 Virtual machine

     A Virtual Machine (VM) is a computing resource that runs programs and deploys apps
     using software rather than a physical computer. This VM is provided by the university-
     industry partner and the use of the VM is to store the data in the database. Other than that,
     VM is treated as the server for handling the data from the system and store the data into the
     database. The VM provided by the university-industry partner is running Linus operating
     systems where have a bit different user interface from the normal window operating
     system. XAMPP was chosen to use as my database apps as shown in Figure 6, because it is
     a free and open-source cross-platform and it is consisting mainly of the Apache HTTP
     Server, and MariaDB database. Furthermore, the Visual Studio Code was chosen as the
     back-end server and web-based apps as a development platform. It is a free source-code
     editor made by Microsoft for Windows, Linux, and macOS.

     Fig. 6. Database user interface using XAMPP.

     3 RESULTS AND DISCUSSION
     The supply voltage of the three-phase blender machine was captured as shown in Figure 7.
     The data was captured during working time. The three-phase supply voltage were measured
     by three measurement units are presented in the graph where unit 1 represented phase 1 and
     unit 2 represent phase 2 and so on. Phase 1 and phase 2 were under the same range where
     between 226V to 232V. For phase 2 was higher than phase 1 and phase 2, the voltage range
     is between 232V to 238V. It was slightly higher than another two phases.
         Voltage imbalance can be estimated as the maximum deviation, expressed in percent,
     from the mean of the three-phase voltages divided by the mean of the three-phase voltages
     [14]. The formula shows in below,

                                max deviation from average voltage                  (1)
         voltage unbalance =
                                         average voltage

                                                    6
MATEC Web of Conferences 335, 02005 (2021) https://doi.org/10.1051/matecconf/202133502005
14th EURECA 2020
Fig. 7. Supply voltage of the three-phase blender machine.
The unbalance voltage of the machine was as shown in Table 2 below. It shows that the
voltage unbalances of the blender machine is 0.86%. By following the standard, the limit of
the maximum of the voltage unbalance was 3% [15]. This shows that the blender machine
had a good supply voltage as the voltage unbalance was 0.86% lower than 3%.
Table 2. Unbalance voltage of the blender machine.
Phase 1 Phase 2 Phase 3
Voltage reading (V) 230 236 230
Average voltage (V) 232
Maximum Deviation 2
from Average Voltage
(V)
Voltage Unbalance 0.86
(%)
As shown in Figure 8, all the three-phase RMS-current of the blender machine were
recorded and compared with other data from the actual machine runtime. The first step in
the operating process of the blender machine is to open the cover of the blender machine as
the graph of small current spiked about 1A. The second stage is the dry mix, as the current
rises to 15A above, the motor is running at a slow speed. After the dry mix, the blender
machine cover is open. Then the coming stage is the resting stage as the current was around
0A and the mixing mode is showing stop mode. The blender machine will close the cover
and then operate the low-speed motor in the third stage. The motor was operating at a slow
speed of around 10 minutes, then the blender machine shifted to a high motor where the
current rise from 18A to 23A. The blender machine's motor stops working at the last stage,
and the cover is open.
Six data types, dough temperature, the motor in fast or slow mode, the motor in run or
stop mode, and RMS current of unit 1,2,3, were represented in the graph. When the blender
machine was operating at a high speed, the current unexpectedly increased from 20 to 25A.
It also has the same pattern compared to set 2 results as shown in Figure 9, which means
that the health of the machine was in normal condition when the blender machine was
7MATEC Web of Conferences 335, 02005 (2021) https://doi.org/10.1051/matecconf/202133502005
14th EURECA 2020
running. The value of current was about 15-20A, equivalent to the engine when it was
running at slow speed, and both set 1 and set 2 data were the same.
Fig. 8. Set 1 data for blender machine with the current value.
Fig. 9. Set 2 data for blender machine with the current value.
The average power factor of the blender machine during operation is shown in Table 3
below. From stage 1 to stage 5, five different stages represent different operating processes
of the blender unit.
Table 3. The average power factor of the blender machine during operation.
Stage 1 Stage 2 Stage 3 Stage 4 Stage 5
Open Close Slow Speed High Speed Dry mix
Cover Cover
Average Power 0.68 0.75 0.87 0.52 0.96
Factor
The operational process of the blender machine and during the corresponding current
profile were clearly shown in Figure 10. The power factor graph combines with other data
of the blender machine was represent in Figure 11.
8MATEC Web of Conferences 335, 02005 (2021) https://doi.org/10.1051/matecconf/202133502005
14th EURECA 2020
Fig. 10. Different stages of the blender machine during operation and corresponding current profile.
Fig. 11. Set 1 data for blender machine with power factor value.
4 Conclusions
This developed system can monitor a machine’s health in real-time and able to identify the
supply unbalanced fault in a 3-phases system. The first objective of this research was
achieved as this system has compact physical hardware that can fit in most of the machines
that are currently used in industries and the electrical data measurements is within with
95% - 98% average accuracy. The second objective was also be achieved with an web-
based interface was developed in which the user can monitor the machine condition through
the website. The designed system is able to monitor the supplied voltage, current and power
factor for different operation stages of the blender machine in real-time. Besides, the
various operation process stages of the blender machine and supply unbalanced conditioned
could also be identified by the system. The limitation of this system is it needs three
measurement units to measure a 3-phase system.
Acknowledgement: The authors would like to acknowledge Taylor’s University for support for this
project. Other than that, authors would like to acknowledge GoAutomate Sdn Bhd. for providing all
the testing resources and financial support for this research.
9MATEC Web of Conferences 335, 02005 (2021) https://doi.org/10.1051/matecconf/202133502005
14th EURECA 2020
References
1. G. K. Singh, S. Ahmed Saleh Al Kazzaz, IEEE Syst. J. 2, 273 (2008).
2. B. Lu, T. G. Habetler, R. G. Harley, 2005 IEEE Int. Conf. Electr. Mach. Drive. 1365
(2005).
3. S.M. Ahmed, H. Abu-Rub, S.S. Refaat, A. Iqbal, Int. J. Elect. Comp. Eng. 3, 129
(2013).
4. N. Lashkari, J. Poshtan, H. F. Azgomi, ISA Trans. 59, 334 (2015).
5. J.E. Williams, AIEE Trans. pt. III-A, Power Appar. Syst. 73, 125 (1954).
6. A. Siddique, G. S. Yadava, B. Singh, IEEE Trans. Energy Convers. 20, 106 (2005).
7. B. Bessam, A. Menacer, M. Boumehraz, H. Cherif, ISA Trans. 64, 241 (2016).
8. G. Mirzaeva, K. I. Saad, M. G. Jahromi, IEEE Trans. Ind. Appl. 53, 2657 (2017).
9. N. G. Lo, A. Soualhi, M. Frini, H. Razik, Proc. 13th IEEE Conf. Ind. Electron. Appl.
900 (2018).
10. S. B. Chaudhury, M. Sengupta, K. Mukherjee, Int. J. Sci. Eng. Res. 2347 (2014).
11. G. S. Maruthi, K. Panduranga Vittal, Proc. Int. Conf. Power Electron. Drive Syst. 2,
838 (2005).
12. R. Udayakumar, V. Khanaa, Int. J. Eng. Comp. Sci. 2, 1117 (2013).
13. K. Janocha, W. M. Czarnecki, On Loss Functions for Deep Neural Networks in
Classification. arXiv preprint arXiv:1702.05659, (2017).
14. P. Pillay and M. Manyage, IEEE Power Eng. Rev. 21, 50 (2001).
15. Tenaga Nasional Berhad, “Electricity Supply Application Handbook,” Distribution
Network Division & Retail Division. vol. 3.1, 2019.
10You can also read