Forecast Analysis of Hydro-climatic Data of Nouhao Sub-basin in East-Central of Burkina Faso
←
→
Page content transcription
If your browser does not render page correctly, please read the page content below
International Journal of Environmental Monitoring and Analysis
2020; 8(2): 27-32
http://www.sciencepublishinggroup.com/j/ijema
doi: 10.11648/j.ijema.20200802.12
ISSN: 2328-7659 (Print); ISSN: 2328-7667 (Online)

Forecast Analysis of Hydro-climatic Data of Nouhao
Sub-basin in East-Central of Burkina Faso
Lucien Damiba1, 3, Ali Doumounia1, 2, *, Aminata Zeba1, Tiéba Nissi Traoré3,
Cheick Oumar Sawadogo3, François Zougmoré1
1
    Department of Physic, Materials and Environment Laboratory (LA.M.E.), University Joseph KI-ZERBO, Ouagadougou, Burkina Faso
2
    Institut of Science (IDS), Department of Sciences Physics, Ouagadougou, Burkina Faso
3
    WaterAid, International Program Department, West Africa Regional Learning Centre for Water Resources Management (RLC-WRM),
    Ouagadougou, Burkina Faso

Email address:
*
    Corresponding author

To cite this article:
Lucien Damiba, Ali Doumounia, Aminata Zeba, Tiéba Nissi Traoré, Cheick Oumar Sawadogo, François Zougmoré. Forecast Analysis of
Hydro-climatic Data of Nouhao Sub-basin in East-Central of Burkina Faso. International Journal of Environmental Monitoring and
Analysis. Vol. 8, No. 2, 2020, pp. 27-32. doi: 10.11648/j.ijema.20200802.12

Received: April 15, 2020; Accepted: May 7, 2020; Published: May 27, 2020

Abstract: Forecast analysis of hydro-climatics data of Nouhao Sub-Basin shows how useful local rain gauges data collected
by population during 4 to 7 years in three (03) villages on the experimental site for the local planning and forecasting. The first
results show that i) the breakdown of the series determines the seasonality and occurrence of "casual" rains; ii) the auto-
correlation detection test showed that casual rains are not self-correlated and validates the model; iii) the dry/rainy season cycle
is from mid-October to April and from mid-April to mid-October for this experimental site, iv) the forecasts for N+1 years in
2016, 2017 and 2018, compared to the collected data, clearly show that the statistical forecast model is robust. The level of
correlation is satisfactory with a positive correlation coefficient close to unity. The deficit of cumulative rainfall average
around to 14%. The 2019 forecast shows a deficit compared to the previous year (2018). It is a dry year compared to the
average index for the period 2012-2018. However, the 2019 forecast for the experimental area corroborates well with the
Permanent Interstate Committee for Drought Control in the Sahel (ICDS/CILSS) forecasts indicating a normal to surplus year
with pockets of drought in the second part of the season for part of Burkina Faso. Longer monitoring in the basin would
contribute to seasonal forecasting efforts in Burkina Faso.
Keywords: Rural Community, Sahel, Climate Change, Resilience, Forecast

                                                                         including unfavourable precipitation patterns in terms of
1. Introduction                                                          location and timing, extended periods of drought and heavy
   West African countries, particularly those in the Sahel               rains. It is imperative to find adapted solutions and make
region, are suffering the adverse effects of climate change,             these vulnerable communities more resilient to climate
marked by extreme events [1] with long-term reduction in                 change. Several sources [5, 7–9] report a decrease in rainfall
rainfall intensity in semi-arid regions [2]; these countries             between 1960 and the early 1970s with a rainfall deficit
experienced during the period 1968-1995, the significant                 reaching 22% [1]. In the Nouaho basin, in central-eastern
deficit of the 20th century in terms of duration, intensity and          Burkina Faso, in particular, disruptions were observed in the
scope [3–6]. Burkina Faso is severely threatened by climate              stations of Sangha and Tenkodogo in 2000, and in those of
change. Inappropriate land use methods and increasing                    Tenkodogo as well as Ouargaye in 2005. Thus,
pressure on natural resources have led to the degradation of             predominantly, rural communities are increasingly feeling
agricultural land. This degradation is further exacerbated by            the negative effects of climate change. These effects are
the impacts of climate change and extreme weather events,                marked by a high variability of interannual rainfall [7, 10],
28 Lucien Damiba et al.: Forecast Analysis of Hydro-climatic Data of Nouhao Sub-basin in East-Central of Burkina Faso
extreme weather conditions in terms of drought and/or 2. Materials and Methods
recurrent floods, violent winds, and rising temperatures
making these communities more vulnerable. This makes the 2.1. Materials
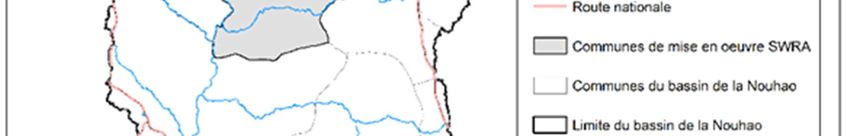
planning of social, economic or cultural activities more and The data used are daily rainfall collected by community
more challenging. It is becoming increasingly imperative to readers recruited and trained by the West African Water
find adaptation ways to reinforce the resilience of these Resources Security Project with the support of Burkina
communities to the effects of climate change. In the Faso's National Meteorological Agency). They consist of a
literature, several authors have made resilience a sine-qua- series of data collected from 2012 to 2018 in three villages in
num condition for climate change adaptation [11, 12]. the Nouaho basin. Data are collected using a peasant rain
Among these adaptation measures, climate forecast seems to gauge of the SPIEA type manufactured by SIMPLAST SA in
us to play an essential role, particularly for agriculture and Mali and distributed by Mali Météo in the ECOWAS zone.
the management of water resources. This seasonal forecast Figure 1 shows the study area and the location of the rain
used as an early warning would be very useful for Sahel gauges installed in the communities where the measurements
producers and makes it possible to anticipate crisis situations were made. This study covers the community of Basbedo,
based on observations and rainfall forecasts in the coming Loungo located in the department of Tenkodogo and Sablogo
months [13, 14] These forecasts allow communities to adapt –department of Lalgaye in the central-eastern region of
their seed choices and plan water resource use according to Burkina Faso. This region is in the Sudanese climatic zone
future rainfall trends. The purpose of this study is to where rainfall ranges are between 700 and 900 mm. The sub-
demonstrate how useful are data collected by local basin straddles the North Sudanese climatic zone and the
population for local planning, water use plans and in building Sudanese zone with annual rainfall of 700 to 800 mm and
community resilience in the Sahel. 800 mm and above.
Figure 1. Location of the Nouaho basin and basin and rain gauges stations.
[∑ [ ] a (x ]
All data were collected and stored in a computer database
− xi )
n 2
(MS ACCESS 2016), after extraction they were processed by 2
( n − i+1)
= i =1 i
∑ (x )
the statistical analysis software R. W 2 (1)
i − x
i
2.2. Methods
Data analysis consisted, on the one hand, in breaking down xi corresponds to the series of data sorted, n is the
2
the data series into trend and seasonal components. The
assumptions of the Ordinary Least Squares (OLS) were used n,
for forecasting model validation. Two standard statistical
entire part of the quotient ai are constants generated
2
tests were used: from the average and the covariance matrix of the quantiles
-Residue normality test with Shapiro-Wilk test which is of a sample of size n according to the normal distribution.
based on the W statistic. This tests are powerful for small -Autocorrelation of the residues is verified using the
data (n ≤ 50) [15], and is written as: Ljung–Box test [16]. It’s a type of statistical test of whether
any of a group of autocorrelations of a time series are
International Journal of Environmental Monitoring and Analysis 2020; 8(2): 27-32                                            29

different from zero. The test allows to formulate a model to                     evaluation of the previous values of rain over same variable.
represent a chronicle with the aim of predicting future values.                  Figure 2 shows the evolution of the rain forecasts and the
The p-value is less than 5%, from which we deduce the                            rain data collected by the communities during the study
absence of autocorrelation of the residues.                                      period in the observation village. The data for 2016, 2017
                                                                                 and 2018 were used to predict the precipitation for the year
3. Results and Discussion                                                        2019. It shows a good consistency between forecast data and
                                                                                 data collected by the population with a correlation of 0.94 for
3.1. Results                                                                     2016, 0.93 for 2017 and 0.91 for 2018. The bias is around 5%
                                                                                 for 2016, 24% for 2017 and 14% for 2018. Table 1,
  The results obtained from the tests give W = 0.9918, and
                                                                                 summarizes the cumulated rainfall, the correlation
W_critic = 0.9258. We have W> Wcritic with a risk of 5%.
                                                                                 coefficients and the bias for each year. All these results have
For the Ljung-Box test, X-squared = 18.9558, df = 10, p-
                                                                                 satisfactory shown the potential of this method to forecast
value = 0.04083, with p-value less than 5%. Normality
                                                                                 rainfall data, in one hand, and on the other one the advantage
assumption is compatible with our data [15]. We deduce that
                                                                                 of having reliable forecast data by populations directly
our model is conform to reality. It allows estimating the
                                                                                 concerned by adaptation measures.
precipitation for the experimental area over the period 2019.
The forecast is an average estimate of rain on the basis of the
                               Table 1. Cumulated rain and forecasting cumul, correlation and bias for 2016, 2017 and 2018.

 Year of forecasting             Yearly observed cumulation (mm)          Year-to-date forecast (mm)               Correlation               Biais
 2016                            884,26                                   935,13                                0,9412                       5%
 2017                            778                                      1020                                  0,9290                       24%
 2018                            906,87                                   1055                                  0,9114                       14%

Figure 2. a) Observed and forecasted rainfall and b) Differential graph of the monthly cumulative rainfall forecast and observed in 2016, 2017, and 2018.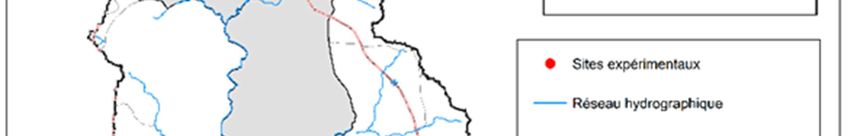
30        Lucien Damiba et al.: Forecast Analysis of Hydro-climatic Data of Nouhao Sub-basin in East-Central of Burkina Faso

   Figure 4 shows the distribution of the rainfall forecast for            Compared to year 2018, 2019 will reach a deficit of 6.5%
2019. It also reveals that the rainy season from May to                    according to the rainfall deficit formula (2):
October and the dry season from October to April. For the
monthly totals, it should be noted that July, August and                                             Dp =
                                                                                                            [M 2 − M 1 ] × 100
                                                                                                                                       (2)
September will be the rainiest months with a peak of 198.91                                                      M1
mm in August. The annual total will be 746.31 mm compared
to 794.66 mm average rainfall over the 2012-2018 period as                   Dp: Rainfall deficit; M1: Year-end average of the year-to-
shows Figure 3 that illustrates the timeline of the rainfall               date period; M2: Average of the projected year.
series for the study period. This illustrates that 2019 will be a
deficit year compared to the average in the past period.

                               Figure 3. Timeline of the rainfall series for the 2012-2019 in the experimental area.

                                        Figure 4. Diagram of the 2019 forecast in the experimental area.

                                                                           deficit compared to the previous year 2018 and at the same
3.2. Discussion                                                            time is a dry year compared to the average index for the
   Breaking down the series allowed us to determine the                    2012-2018 period. The result compared to the Permanent
seasonality and occurrence of "accidental" rains throughout                Interstate Committee for Drought Control in the Sahel
the series. The dry-rainy season cycle is from November to                 (ICDS/CILSS) published in April 2019 indicated that the
April and from May to mid-October, in the study area.                      2019 will be in deficit compared to 2018 rainfall in the
Autocorrelation detection tests show that accidental rains are             climate zone where is located the project [17]. The year 2019
not self-correlated and validate the model. The forecasts for              rainfall is in deficit compared to the Normal period 1981-
2016, 2017 and 2018 showed a positive correlation close to                 2010 in Burkina Faso [18, 19].
the unit, which clearly shows the robustness of the model.                    It is the first time that we use some data collected by local
Also, the calculation of the cumulative rainfall deficit shows             communities for seasonal forecasting in the Nouaho sub-basin.
a variation between 5% and 24%. The 2019 forecast shows a                  Burkina Faso. This study reveals the need to act on the climate
International Journal of Environmental Monitoring and Analysis 2020; 8(2): 27-32                               31

crisis by involving local communities in the collection of data       [3]   L. DESCROIX, Y. S. Aïda DIONGUE NIANG, Gérémy
which, after all, makes it possible to have data in quantity and            PANTHOU, Ansoumana BODIAN, D. Honoré, and G. Q.
                                                                            Moussa MALAM ABDOU, Jean-Pierre VANDERVAERE,
quality and also to make local predictions of precipitation. In             “Évolution récente de la pluviométrie en Afrique de l ’ ouest à
this climatic zone, a forcast based on data collected locally               travers deux régions: la Sénégambie et le Bassin du Niger
could help local authorities to better understand the local rain            Moyen”      Climatologie,      vol.     12,    2015,       doi:
behavior. However, since the duration of the series is less than            10.4267/climatologie.1105.
10 years, the rainfall index compared to the calculated average       [4]   A. Dai, K. E. Trenberth, and T. R. Karl, “Global Variations in
is insufficient. Nonetheless, it gives a trend that could be                Droughts and Wet Spells: 1900-1995,” Geophys. Res. Lett.,
clarified at the end of the period. These preliminary results               vol. 25, no. 17, pp. 3367–3370, 1998, doi: 98GL52511 0094-
confirm the robustness of the model if we have a good                       8534/98/98GL-52511$05.0.
coverage of the basin in rainfall stations through a network of       [5]   Servat E., Paturel J.-E., Kouamé B., Travaglio M., Ouédraogo
selected sites in the basin.                                                M., Boyer J.-F., Lubes-Niel H., Fritsh J.-M., Masson J.-M. et
                                                                            Marieu., 1998 “Identification, caracterisation et consequences
                                                                            d’une variabilite hydrologique en Afrique de l’ouest et
4. Conclusion                                                               centrale,” in Wafer Resources Variability in Africa during Ihe
                                                                            XXth CenJury (Proceedings, 1998).
   These preliminary results allowed us to verify the
robustness of the model used for seasonal forecasts and to            [6]   S. Ardoin-Bardin, “Variabilité hydroclimatique et impacts sur
confirm it with the forecasts made by AGRYMET which is                      les ressources en eau de grands bassins hydrographiques en
CILLS’ body in charge of managing forecasts. Beyond the                     zone soudano-sahélienne,” Thèse l’Université Montpellier II
                                                                            Sci. Tech. du Languedoc, Montpellier, Fr., p. 608, 2004, doi:
model, the study reveals the need to strengthen data                        10.1038/ni.2208.
collection at the local level, which could make it possible not
only to have a better knowledge of climate variability in the         [7]   B. Ibrahim, “Caractérisation des saisons de pluies au Burkina
sub-basin but also to support the government's efforts to                   Faso dans un contexte de changement climatique et évaluation
                                                                            des impacts hydrologiques sur le bassin du Nakanbé.,”
strengthen knowledge of climate events in the region. These                 Doctorat ès Sciences de l’Université Pierre et Marie Curie et
results allow us to strengthen community resilience without                 de l’Institut International d’Ingénierie de l’Eau et de
which the development of society would be compromised by                    l’Environnement (2ie) à Ouagadougou, 2012.
the adverse effects of climate variability and change. The
                                                                      [8]   J. E. Paturel, E. Servat, M. O. Delattre, and H. Lubes-niel,
availability of local data throughout the basin would provide               “Analyse de séries pluviométriques de longue durée en
a database to be used for further research on knowledge of                  Afrique de l’Ouest et Centrale non sahélienne dans un
both climate factors and hydrological and hydrogeological                   contexte de variabilité climatique,” Hydrol. Sci. J., vol. 43, no.
factors. However, support through training and ownership of                 6, pp. 937–946, 1998, doi: 10.1080/02626669809492188.
the tools and methods used by the selected readers could              [9]   É. Servat, J. E. Paturel, B. Kouamé, J. M. Masson, M.
make it possible to better organize collection over territories             Travaglio, and B. Marieu, “De différents aspects de la
larger than the Nouaho basin.                                               variabilité de la pluviométrie en Afrique de l ’ Ouest et
                                                                            Centrale non sahélienne,” Rev. des Sci. l ’ eau/journal Water
                                                                            Sci., vol. 12, no. 2, pp. 363–387, 1999, doi:
Acknowledgements                                                            https://doi.org/10.7202/705356ar.
   We gratefully acknowledge WaterAid, for supporting this            [10] M. Ouedraogo, “Impact des changements climatiques sur les
research. We also gratefully, the National Meteorological                  revenus agricoles au Burkina Faso,” J. Agric. Environ. Int.
Agency of Burkina Faso for providing the reference rain                    Dev. -, vol. 106, no. 1, pp. 3–21, 2012.
gauge data.                                                           [11] G. C. Gallopın, “Linkages between vulnerability, resilience,
                                                                           and adaptive capacity,” Glob. Environ. Chang., vol. 16, no.
                                                                           July,        pp.        293–303,         2006,          doi:
Conflicts of Interest                                                       10.1016/j.gloenvcha.2006.02.004.
  The authors declare that they have no competing interests.          [12] C. Cantoni and B. Lallau, “The Resilience of Turkanas. A
                                                                           Community of Kenyan Herdsmen Experiencing Climatic and
                                                                           Political Uncertainties,” Développement durable Territ., vol.
                                                                           1, no. 2, pp. 0–23, 2016, doi:
References                                                                 10.4000/developpementdurable.8497 ISSN.
[1]   P. N. Kabore, A. Ouedraogo, and M. Sanon,                       [13] L. De Montera et al (A COMPLETER)., “Etude de la
      “CARACTÉRISATION             DE       LA      VARIABILITÉ            variabilité micro-échelle des précipitations: Application à la
      CLIMATIQUE DANS LA RÉGION DU CENTRE-NORD                             propagation des ondes millimétriques en SATCOM,” 2008.
      DU BURKINA FASO ENTRE 1961 ET 2015,” Climatologie,
      vol. 14, no. December, 2017, doi: 10.4267/climatologie.1268.    [14] P. Roudier, “Climat et agriculture en Afrique de l ’ Ouest:
                                                                           Quantification de l ’ impact du changement climatique sur les
[2]   Sharon E. Nicholson, “Climatic and environmental change in           rendements et évaluation de l ’ utilité des prévisions
      Africa during the last two centuries” CLIMATE RESEARCH               saisonnières To cite this version: HAL Id: tel-00874724,”
      Clim Res, Vol. 17: 123–144, 2001                                     Ecole des Hautes Etudes en Sciences Sociales (EHESS), 2013.
32        Lucien Damiba et al.: Forecast Analysis of Hydro-climatic Data of Nouhao Sub-basin in East-Central of Burkina Faso

[15] Ricco Rakotomalala, “Tests de normalité Techniques empiriques        des pluies 2019 pour les pays du Golfe de Guinée,” Niger;
     et tests statistiques,” Université Lumière Lyon 2, 2011.             Niamey, 2019.
[16] G. M. LJUNG and G. E. P. BOX, “On a measure of lack of fit      [18] ANAM-BF, “Bulletin Agrometeorologique            Decadaire,”
     in time series models,” Biometrika, vol. 65, no. 2, pp. 297–         BURKINA FASO, Ouagadougou, 2019.
     303, Aug. 1978, doi: 10.1093/biomet/65.2.297.
                                                                     [19] AGRHYMET, “Bulletin De SuiVi De lA CAMPAGne
[17] AGRHYMET, “Bulletin spécial de prévision saisonnière des             AGROPAStORAle en AFRiQue De l’OueSt Bulletin,”
     caractéristiques Agro- Hydro-Climatiques de la grande saison         Niamey (Niger), 2016.


You can also read