Prediction Studies of Electricity Use of Global Computing in 2030 - International Journal of Science and ...
←
→
Page content transcription
If your browser does not render page correctly, please read the page content below
International Journal of
Science and Engineering Investigations vol. 8, issue 86, March 2019
Received on February 28, 2019 ISSN: 2251-8843
Prediction Studies of Electricity Use of Global Computing in 2030
Anders S. G. Andrae
Huawei Technologies Sweden AB, Skalholtsgatan 9, 16494 Kista, Sweden
(anders.andrae@huawei.com)
Abstract-The electricity use of the information technology (IT)
sector - consisting of demand from computing, transmission
and production - is of large interest. Here a theoretical
framework describing how the total global electricity demand -
associated with the computing instructions done in servers and
computers - is used to estimate the electricity use in 2030. The
proposed theoretical framework is based on the following
parameters: instructions per second, joules per transistor, and
transistors per instruction as well as a distinction between
general and special purpose computing. The potential
predictions - made possible with the proposed equations -
include the electricity used by the data centres based on
utilization of the processors therein and estimations of the
electricity use of the processors used in fixed and mobile
networks and end-user devices. Production of IT
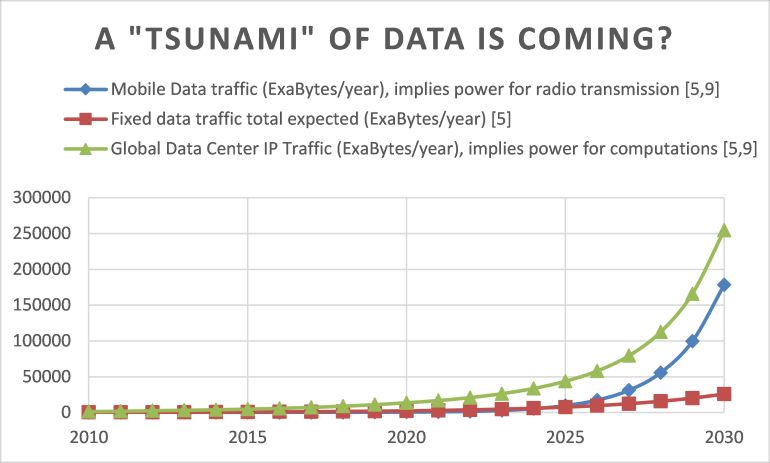
equipment/hardware is excluded as well as transmission in Figure 1. Possible evolution of total global data traffic toward 2030 [5,9].
mobile and core networks use stage. Predictions for computing
2030 vary a lot from 1 to 4487 TWh depending on which
transistor technology will be dominant handling the An earlier prediction model for the entire information
instructions. Two other prediction techniques - based on technology (IT) sector [5] includes the fact that energy efficient
instructions per joule and joules per operation - give similar smartphones and tablets might be used instead of desktops and
results. laptops for streaming videos. It is suspected therefore that total
Keywords- Computing, Computations, Data centres, E-factor, consumer devices use stage power declines until 2030 despite
Electricity, Instructions, Operations, Power use, Processing, being affected by the same transistor technology problems as
Servers, Switching, Transistors the rest of the computing sector. There is also a lot of logical
reasoning/speculation around “Smart IT” which can optimize
the energy efficiency (e.g. in buildings) and save perhaps more
per year than IT uses itself. So far the total global electricity
use is increasing [6], however slower than ITs own electricity
I. INTRODUCTION use [5,7]. Electricity saving is happening, but also more
demand and consumption for e.g. the IT infrastructure. Some
The World is demanding more and more energy and argue that the cloud services are being responsible for a
especially electrical energy will be used in many more rebound effect [8] and that can play a role in this dilemma. It is
applications tomorrow than today. For instance, electric important to find better ways of estimating and forecasting the
vehicles [1,2] and sustainable hydrogen production [3] for fuel global electricity use by computing as the next decade will
cell vehicles - or reformed internal combustion engines - means present itself with many challenges. Although trend analyses
extra demand of electric power [4]. [5,9] might be reasonable enough, it is worthwhile checking
The digitalization of most businesses will also require other approaches estimating computing power. The IT Sector is
additional amounts [5]. Some [9] argue that a “tsunami” of data divided into computing, transmission and production. The
is about to be unleashed according to Fig. 1. present study refines the computing share as far as electric
power predictions.
27II. PROBLEM FORMULATION ( ) , the switching electricity in year of for
In the present prediction a new methodological framework “dark silicon” transistors is given by (3).
[10] is used for estimating a major share of the global power
use of IT. In the present estimate the hypothesis is that ( )
computing instructions done in servers will - in around 2030 -
under certain circumstances use several thousands of TWh, (3)
unless breakthroughs in semiconductor technologies are where
reached in the next decade. The result (order of magnitude) is
thought to be comparable to previous estimations such as [7]. = Boltzmann’s constant [J/K].
To the authors knowledge the global electricity use of
= Temperature at which the transistor is operating [K].
computing instructions – based on instructions per joule and
instructions per second, and General Purpose Computing = energy/enthropy factor (e-factor) in year .
(GPC) and Special Purpose Computing (SPC) – has yet to be
estimated for 2030. = energy/enthropy factor (e-factor) for “dark silicon”
transistors in year .
is assumed to be 313.73 Kelvin to be consistent with 11] and
III. PROBLEM SOLUTION International Technology Roadmap for Semiconductors
In this prediction an approach – (1)-(5) - is used for Roadmap ITRS) [11] for ( )
extrapolating the potential electricity use of current and future
computing instructions, ( ) . 1) Parameter estimations
Table I lists the evolution of e-factors and switching
energies from 1989 to 2018 and predictions for 2030 based on
() roadmaps from [11], [12], [13], [14] and [15].
( ) (( ) ( ) ( ) ( ) )
(1)
where
TABLE I. EVOLUTION AND EXTRAPOLATION OF E-FACTORS AND
() = potential electricity use of computing instructions in SWITCHING ELECTRICITIES FROM 1989 TO 2030 FOR FIVE DIFFERENT
ROADMAPS
data centres and computers in year .
( ) (zeptoJoule = ( )
( ) = transistors per instruction in year . Year
dark
10 (-21
)) silicon, zeptoJoule
( ) = instructions per second for GPC in year (average 1989 9932000[16] 41137803 [11]
global traffic). 2003 78500 [16] 325143 [11]
2006 67700 [16] 560819 [11]
( ) = Joules per transistor for GPC in year . 2007 57483 [11] 250000 [11]
2008 18900 [16] 82200 (2) 156566 [11]
( ) = instructions per second for SPC in year (average 2012 4500 [16] 19600 (2) 74555 [11]
global traffic). 2014 1750 [16] 7610 (2) 28994 [11]
2015 1500 [16] 6520 (2) 24852 [11]
( ) = Joules per transistor for SPC in year . 2017 13889 [11]
2018 10256 [11]
= the average share of a data centre’s - or a
2030 ITRS
computers - total power use that is used by the Central roadmap [11]
230 (2) 1000 [11] 3330
Processing Units (CPUs) – and Graphical Processing Units
2030 Frank
(GPUs) - in year . roadmap [12]
100 [16] 435 1448
2030 Bennett
Values for each parameter needed to quantify ( ) will be roadmap [13]
40 [16] 174 579
estimated for chosen years between = 2007 and = 2030. 2030
Landuaer
A. Electricity per instruction – switching electricity Roadmap
0.7 (2) 3 [11] 9.99
[14]
( ) , the switching electricity [11] in year of special
2030,
purpose computing, is given by (2). Reversible
0.04 [16] 0.17 (2) 0.67
Computing
( ) (2) roadmap [15]
International Journal of Science and Engineering Investigations, Volume 8, Issue 86, March 2019 28
www.IJSEI.com ISSN: 2251-8843 Paper ID: 88619-04A slow-down of the improvement of is obvious from ( )
2008. Between 1989 and 2007 ( ) improved around ( )
25% per year, and from 2008 to 2015 by 30% per year. (( ) ( ) ( ) ( ) )
( ) only improved around 23% per year from 2008 (6)
to 2015. With such a deceleration it is questionable if even the
ITRS roadmap, being the least optimistic, can be realized. ( )
Based on the average ratio (3.33) between ( )
( ) and ( ) – the “dark silicon effect” - (( ) ( ) ( ) ( ) )
for 2008, 2012, 2014 and 2015, ( ) for 2030 can be (7)
estimated for different roadmaps.
As shown by (6)-(7), ( ) is not constant over the
B. Instructions per second
years. For the baseline it is assumed that ( ) is
The only source found mentioning a roadmap for global
traffic expressed as ( ) is [17]. constant until 2030. As shown in Table I, the decrease of
started to slow down from 2008, and including this fact
( ) will affect ( ) tremendously. Table II shows the between 2008 and 2012 will affect the value of ( ) . Table
evolution of ( ) for selected years. III shows the assumed evolution of ( ) .
TABLE II. EVOLUTION OF INSTRUCTIONS PER SECOND TABLE III. ASSUMED EVOLUTION OF TRANSISTORS PER
INSTRUCTION 2007 TO 2030.
Year GPC, (Zetta( )=1021 ( ) SPC, (Zetta( )=1021 ( )
-7 -7 Year ( )
1986 2.86×10 [17] 4.19×10 [17]
-3
2007 6.24×10 [17] 0.185 [17] 2007 38994
2012 0.035 1.47 2012 32331
2030 18 [17] 2570 [17] 2030 32331
( ) and ( ) in Table II are obtained from D. Other methods by which computing power can be
estimated
extrapolation between 2007 and 2030.
Next follows two additional approaches by which
C. Transistors per instruction computing power use can be determined and predicted.
( ) in (4) refers to the transistors in a chip which are 1) Operations Per Second per Watt and Joules per
Operation
involved in doing an instruction. ( ) is the most difficult Yet another way to estimate the global electricity use of
parameter to estimate in the present prediction model. computation operations is according to (8) which can employ
available Operation Per Second per milliwatt and Joules per
( ) Operation roadmaps [19].
( ) (4)
(( ) ( ) ( ) ( ) )
( ) ( ) ( ) (8)
( )
The assumed difference between GPC and SPC as far as ( )
( )
switching electricity is given by (5).
( ) ( ) (5) where
( ) = Average electricity use in year of computing
It has been estimated that servers globally in 2007 used 82
TWh [18], i.e. ( ) and 105 TWh in instructions.
2012 [18], i.e. ( ) . Hence ( ) ( ) = Operations performed - in the typical
average chip - per second in year .
and ( ) can be estimated as shown in (6) and (7) from
values in Tables I and II:
International Journal of Science and Engineering Investigations, Volume 8, Issue 86, March 2019 29
www.IJSEI.com ISSN: 2251-8843 Paper ID: 88619-04() = Power consumption of typical average chip Equations (9) to (12) show how the electricity use of
computing can be estimated.
in year .
( )
( ) (9)
( )= Average seconds per year.
( )
( ) = Operations per second (global average traffic) in year ( ) (10)
, assumed identical to ( ) +( ) . ( )
() (11)
( )
( ) is absent from (8) which is an advantage. In section
( ) ( )
V.A some results will be presented using (8).
() (12)
( ) ( )
2) Combine instructions per joule with instructions per
second where
Data centre estimations – such as [5,7,9] - for 2030 can be
“tested” with an approach based on instructions per second ( ) = IPJ for General Purpose Computing in year
(IPS) [17] and instructions per joule (IPJ) [20].
As shown in Table IV, if Koomey’s Law (9) [20] for ( ) = IPJ for Special Purpose Computing in year
electricity efficiency improvement - 55% per year since 2000 -
holds to 2030, and we have 3.0×1024 IPS by then - we still will
( ) = Instructions per kWh for Computing in year .
have several thousands of TWh needed for computing. This is
true even if the CPU share of the electricity use of the data
The electricity use will be estimated for the year 2030 for
centres and computers would be 100% (i.e. no extra electric
SPC and GPC and compared to the values for 2030 in [5] and
power needed for cooling, fans, uninterruptable power supply
the present method based on switching electricity roadmaps.
etc.) and if no split – regarding energy efficiency - is made
Table IV results only refers to computing related electricity in
between SPC and GPC. Nowadays the CPU share of the
the data centre and computers, which is far from reality. This
electricity use of the data centres might be just 20% for some
means that the consumption would be higher if other sources of
smaller data centres [21] however much higher - like 70% - for
power use than computing would be included.
professional hyperscale data centres [22].
TABLE IV. 2030 ELECTRICITY USE OF COMPUTING BASED ON INSTRUCTIONS PER KILOWATTHOUR AND INSTRUCTIONS PER SECOND
( ) ( ) ( ) ( ) ( ) ( )
= 2030 2.12×10²² [17] 3.03×1024 [17] 1.98×10¹⁹ (9) 5.5×10¹⁰ (5) 5.5×10¹² (10) 9.42×10¹¹ (12) 8253
Here follows the calculation for the Bennett Roadmap [13]
IV. RESULTS
– with ( ) according to (1):
Here follows the calculation for the ITRS Roadmap [11] –
with ( ) according to (1): ()
( )
( )
()
.
.
Here follows the calculation for the Landauer Roadmap
Here follows the calculation for the Frank Roadmap [12] –
[14] – with ( ) according to (1):
with ( ) according to (1):
()
()
( )
( )
.
.
International Journal of Science and Engineering Investigations, Volume 8, Issue 86, March 2019 30
www.IJSEI.com ISSN: 2251-8843 Paper ID: 88619-04Here follows the calculation for the Reversible Computing Three trends which strengthen the hypothesis of more
Roadmap [15] – with ( ) power consumption from IT are: the exponential data (no
matter how data is defined) demand of existing services such as
according to (1): video streaming [9], long change cycles in fundamental
technologies, and new unforeseen demands of data. If the
() surging data demand is a foregone conclusion – which it
( ) probably is – then there could be other users of power which
will have less access to it. Pricing of power and data will
. anyway probably solve the power issues if they become severe.
The uncertainty range is huge for all parameters. For the Moreover, it is not evident whether Artificial Intelligence
Landauer and Reversible Computing Roadmaps the electricity (AI) will drive or reduce electricity use globally overall.
use will be insignificant. However, AI deep neural networks will probably generate
more data – and instructions - and thereby drive more
Fig. 2 shows the main results for the roadmaps [12-15]
electricity consumption.
compared to previous estimations for ( ) and ( )
Specifically for the present predictions there are several
expressed as TWh. The results for all roadmaps assumes sources of important uncertainties. Two of the most important
which might be a little overoptimistic.
are for ( ) and global data traffic ( ) as there are no
real roadmaps for those parameters. ( ) is based on the
number of cores in chips used globally so it has potential to be
forecasted. If there will be 2.5 Yotta instructions per second
(average global traffic) in 2030 – as predicted [17] and the
ITRS roadmap [11] will be followed - there will be several
thousands TWh extra electricity consumption, even with
. Less than 100% utilization will of
course mean more electricity use.
Anyway, 100% utilization is perhaps plausible – especially
in some parts of the World - as the most efficient run data
centres have already set a tone for those less efficient and that
has saved - and will save - power overall. There is an
awareness in the industry which has helped slow-down the
electricity use along the “best case scenario” as described in [5]
so far.
A. A breakthrough is necessary
Figure 2. Comparison of roadmaps prediction results for 2030 with other There needs to be a massive breakthrough for chips if the
predictions for data centres electricity should not rise in ICT. The Bennett roadmap [13]
represents such a breakthrough, let alone the Landuaer [14] and
Reversible Computing Roadmaps [15,16].
Fig. 2 shows some similarities between earlier predictions The presently excluded production of IT hardware is in
[5,7,9] for data center computing power and the present 2030 expected to require several hundred TWhrs [5], adding to
roadmap prediction. those factors which underestimate the present results. Mobile
data transmission is another driver for overall IT power
demand [5,9].
V. DISCUSSION With current trends - and what seems possible in the next
The present projections about global electricity usage of decade – technical research is necessary but not enough to
computing are still in line with the current situation. However, prevent a high rise in the next decade.
the absolute TWhrs are probably lower for 2015 TWhrs but There also need to be sharp implementations if the rapid
same order of magnitude. We are in an optimistic trajectory rise is to be prevented.
along the “best case scenario” as outlined in [5] until around
2023 where the TWhrs will start to rise more or less rapidly. The Bennett roadmap is similar to a prediction [19] listing
We are depending ourselves so much on the digitalization that two orders of magnitude improvements for energy per
– in one scenario – other electricity consuming sectors will operation between 2000 and 2020. Energy per operation is
have to stand back so data centres and networks can have the likely similar to the inverse of instructions per joule [16].
available power. Using (8) from section II.D.1, two examples are derived using
data from [16] and [19]:
International Journal of Science and Engineering Investigations, Volume 8, Issue 86, March 2019 31
www.IJSEI.com ISSN: 2251-8843 Paper ID: 88619-04( ) be delayed into the 2030s thanks to quantum energy efficient
( ) nanochips [24]. Moreover, it need to be investigated what is the
power consumption of current commercial quantum computers
[25]. In a nutshell, the e-factor for quantum computing should
be estimated. The verification of possible contradictions
This example means that if a “traditional” 180 W processor between total number of operations and total number of
chip using 5 nm node [16] – 3.1 pJ/operation - would process instructions would be worthwhile. The electric power use (e.g.
the anticipated operations in 2030 with current transistor TWhrs) obtained - from operations per year multiplied with
technology, an absurd amount of electricity will be used for energy per operation - should be compared more carefully to
computing. the present estimates.
The same chip using reversible computing [16] would use
only 0.08 W and 1.39 fJ/operation:
REFERENCES
( )
( ) [1] H. Moon, S.Y. Park, C. Jeong, and J. Lee. “Forecasting electricity
demand of electric vehicles by analyzing consumers ’ charging
patterns,” Transportation Research Part D: Transport and Environment,
Vol. 62, pp. 64-79, 2018. DOI: https://doi.org/10.1016/j.trd.2018.02.009
Moreover, using other data from Table 1.2 in [19] for [2] P. Ryan. “Electricity Demand and Implications of Electric Vehicle and
nanoelectronics with 1 fJ/operation: Battery Storage Adoption”. In Transition Towards 100% Renewable
Energy, Springer, Cham. 2018, pp. 391-398. DOI:
https://doi.org/10.1007/978-3-319-69844-1_35
( )
( ) [3] I. Vincent and D. Bessarabov. “Low cost hydrogen production by anion
exchange membrane electrolysis: a review,” Renewable and Sustainable
Energy Reviews, Vol. 81, No. 2, pp. 1690-1704, 2018. DOI:
https://doi.org/10.1016/j.rser.2017.05.258
If the breakthroughs on chip level – similar to [12] or [13] -
[4] A.S.G. Andrae. “Drawing the fresco of the electricity use of information
have not been reached before the data “tsunami” have hit, there technology in 2030 – Part II,” Researchgate.net., 2019. DOI:
will be some interesting dilemmas in the power sector and 10.13140/RG.2.2.31813.91361
society. [5] A.S.G. Andrae and T. Edler. ”On global electricity usage of
communication technology: trends to 2030,” Challenges, Vol. 6, No. 1,
Pangrle [23] discussed a projected efficiency in 2023 of pp. 117-157, 2015. DOI: https://doi.org/10.3390/challe6010117
1300 million operations per second per Watt being 19 times [6] V. Petit. “The Transition to a New Electric World,” In The New World
short of a 40 MW target for a specific data centre/super of Utilities, Springer, Cham. 2019. pp. 5-32. DOI:
computer. Obviously, energy efficiencies of 769 (1300 million https://doi.org/10.1007/978-3-030-00187-2_2
operations per second per Watt) and 40 pJ/operation (24.7 [7] T. Masuhara. “The Future of Low-Power Electronics,” In CHIPS 2020,
billion operations per second per Watt) will not be sufficient Vol. 2, B. Hoefflinger, Ed. Springer, Cham., 2016, pp. 21-50. DOI:
seven years later in 2030 if by then the global traffic is 3 Yotta https://doi.org/10.1007/978-3-319-22093-2_2
operations/instructions per second. Something like 50 [8] H.J. Walnum and A.S.G. Andrae. “The internet: explaining ICT service
demand in light of cloud computing technologies,” In Rethinking
fJ/operation, i.e. 20 [Terraoperations/s]/[Watt] will be required Climate and Energy Policies, T. Santarius, H.J. Walnum and C. Aall,
to keep the power consumption in data centres under a certain Eds. Springer, Cham., 2016, pp. 227-241. DOI:
control in 2030. https://doi.org/10.1007/978-3-319-38807-6_13
[9] A.S.G. Andrae. “Projecting the chiaroscuro of the electricity use of
communication and computing from 2018 to 2030,” Researchgate.net.
2019. DOI: 10.13140/RG.2.2.25103.02724
VI. CONCLUSION
[10] A.S.G. Andrae. “Drawing the fresco of the electricity use of information
A framework based on transistor physics is used to predict technology – Part I,” Researchgate.net. 2019. DOI:
the 2030 electricity use of computing. The range of potential 10.13140/RG.2.2.18392.14080
outcomes of electricity usages for computing at large is [11] J.L. Summers. “From ZettaBytes to zeptoJoules – can digital demand
enormous, actually several orders of magnitude depending on outstrip the physical limits?,” Presentation held at RISE SICS Open
House Kista, Sweden 19 April 2018.
which roadmap will prevail. Based on the predictions done
[12] M.P. Frank. “Approaching the physical limits of computing,”
with the present method, the electricity use of the computing In Proceedings of 35th International Symposium on Multiple-Valued
infrastructure will in 2030 reach several thousands extra TWh. Logic (ISMVL´05). IEEE, 19-21 May 2005, Calgary, BC, Canada, pp.
The reason is simply that the rate of energy efficiency 168-185. DOI: 10.1109/ISMVL.2005.9
improvements will not likely keep up with the rate of [13] C.H. Bennett. “The thermodynamics of computation — a review,
computing instructions. “ International Journal of Theoretical Physics, Vol. 21, No. 12, pp. 905-
940, 1982. DOI: https://doi.org/10.1007/BF02084158
[14] R. Landauer. “Dissipation and noise immunity in computation and
communication,” Nature, Vol. 335, No. 6193, pp. 779-784, 1988. DOI:
VII. NEXT STEPS https://doi.org/10.1038/335779a0
Obviously many more permutations are necessary. Many [15] W. Porod. “The Thermodynamics of Computation: A Contradiction,” In
Energy Limits in Computation, C.S. Lent, A.O. Orlov, W. Porod and
new values of all parameters in the present framework need to G.L. Snider, Eds. Springer, Cham., 2019. pp. 141-154. DOI:
be derived and collected. The electricity demand surge might https://doi.org/10.1007/978-3-319-93458-7_4
International Journal of Science and Engineering Investigations, Volume 8, Issue 86, March 2019 32
www.IJSEI.com ISSN: 2251-8843 Paper ID: 88619-04[16] J.L. Summers. “From ZettaBytes to zeptoJoules – will digital demand [22] A. Shehabi, S.J. Smith, E. Masanet, J. Koomey. ”Data center growth in
outstrip the physical limits?,” at Data Centre World, 15-16 March, 2017, the United States: decoupling the demand for services from electricity
London, United Kingdom. use,” Environmental Research Letters, Vol. 13, No. 12, 2018, p. 124030.
[17] Z.W. Xu. “Cloud-sea computing systems: Towards thousand-fold DOI: https://doi.org/10.1088/1748-9326/aaec9c
improvement in performance per watt for the coming zettabyte era,” [23] B. Pangrle. “News on energy-efficient large-scale computing,” In
Journal of Computer Science and Technology, Vol. 29, No. 2, pp. 177- CHIPS 2020, Vol. 2, B. Hoefflinger, Ed. Springer, Cham., 2016, pp.
181, 2014. DOI: https://doi.org/10.1007/s11390-014-1420-2 165-170. DOI: https://doi.org/10.1007/978-3-319-22093-2_9
[18] W. Van Heddeghem, S. Lambert, B. Lannoo, D. Colle, M. Pickavet, and [24] D.A Gangloff, G. Ethier-Majcher, C. Lang, E.V. Denning, J.H. Bodey,
P. Demeester. ”Trends in worldwide ICT electricity consumption from D.M. Jackson et al. “Quantum interface of an electron and a nuclear
2007 to 2012, “ Computer Communications, Vol. 50, pp. 64-76, 2014. ensemble,”, Science 21 Feb. 2019. DOI: 10.1126/science.aaw2906.
DOI: https://doi.org/10.1016/j.comcom.2014.02.008 [25] D. Castelvecchi. IBM's quantum cloud computer goes commercial.
[19] B. Hoefflinger. News on Eight Chip Technologies. In CHIPS 2020, Vol. Nature News, Vol. 543, No. 7644, 2017, 159. DOI:
2, B. Hoefflinger, Ed. Springer, Cham., 2016, pp. 1-19. DOI: 10.1038/nature.2017.21585
https://doi.org/10.1007/978-3-319-22093-2_1
[20] J. Koomey, S. Berard, M. Sanchez, and H. Wong. “Implications of How to Cite this Article:
historical trends in the electrical efficiency of computing,” IEEE Annals
of the History of Computing, Vol. 33, No. 3, pp. 46-54, 2011. DOI:
10.1109/MAHC.2010.28 Andrae, A. S. (2019). Prediction Studies of Electricity
Use of Global Computing in 2030. International Journal
[21] R. Bashroush. “A Comprehensive Reasoning Framework for Hardware of Science and Engineering Investigations (IJSEI), 8(86),
Refresh in Data Centres,” IEEE Transactions on Sustainable Computing, 27-33. http://www.ijsei.com/papers/ijsei-88619-04.pdf
Vol. 3, No. 4, pp. 209-220, 2018. DOI: 10.1109/TSUSC.2018.2795465
International Journal of Science and Engineering Investigations, Volume 8, Issue 86, March 2019 33
www.IJSEI.com ISSN: 2251-8843 Paper ID: 88619-04You can also read