Update on COVID-19 in Canada: Epidemiology and Modelling - Canada.ca/coronavirus December 10, 2021
←
→
Page content transcription
If your browser does not render page correctly, please read the page content below
Update on COVID-19 in
Canada: Epidemiology
and Modelling

December 10, 2021

Canada.ca/coronavirus

Nationally, COVID-19 disease activity is increasing and severity could
    begin to rise if this trend continues
           Number (cases/                                  Daily counts                                                        Number (deaths)
           in hospital / in ICU)                           (average over past 7 days):
           10,000                                          3,300 cases                                                                        900
                                                           1,469 in hospital
             9,000                                                                                                                            800
                                                             460 in ICU
             8,000                                            20 deaths                                                                       700
             7,000
                                                                                                                                              600
             6,000
                                                                                                                                              500
             5,000
                                                                                                                                              400
             4,000
                                                                                                                                              300
             3,000
             2,000                                                                                                                            200
             1,000                                                                                                                            100
                  0                                                                                                                           0
                      Mar      May        Jul        Sep        Nov        Jan        Mar        May         Jul       Sep        Nov
                                                2020                                                  2021

                                                Cases           Hospitalizations             ICU          Deaths
Data as of December 8, 2021
Note: Trend lines reflect 7-day moving averages. Total hospitalizations and ICU admissions include all people in hospital and in ICU on that day.
                                                                                                                                                    1
Hospitalizations and ICU counts include data from nine of thirteen Canadian provinces and territories.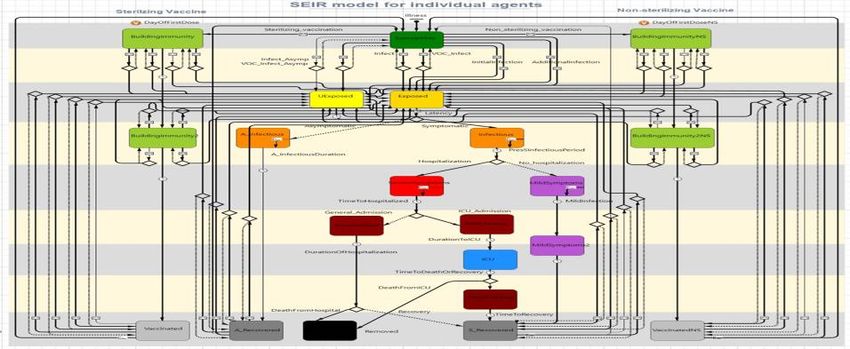
COVID-19 activity is increasing nationally, primarily driven by epidemic
     growth in Ontario and Quebec
     Number cases / in hospital per 100,000 population

                                                                    Date (month year)

                                                           Cases                 Hospitalizations
Data as of December 7, 2021
Note: Daily cases trend lines reflect 7-day moving averages. Total number in hospitals include all people in hospital on that day.   2
Canada’s Rt has been relatively unstable, but above 1 over the past 5 weeks,
   indicating the epidemic is in a growth pattern nationally, with considerable regional
   variation
            2                           When Rt is consistently >1,
                                        the epidemic is growing
                                                                                          Rt relatively unstable
          1.5                                                                             over the past 5 weeks

            1

          0.5                       When Rt is consistently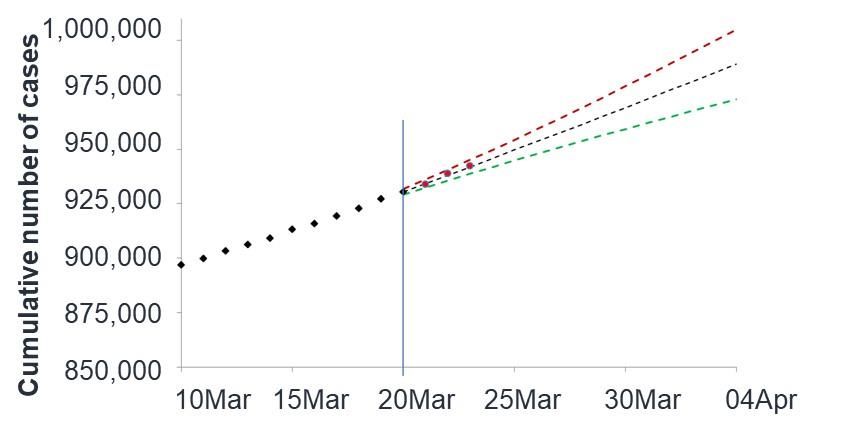
Nationally, incidence rates remain highest among children under 12 years of age,
  with the large majority of people aged 12 years or older now fully vaccinated
                                                   40                                                                                                Incomplete data, due
                                                                                                                                                        to reporting lag

                                                                                                                                                              }
                                                                                                                            4th wave: highest incidence in
                                                   30
                     Number of cases per 100,000

                                                                                                                                   5-11 year olds
                       (7 day moving average)

                                                   20

                                                   10

                                                    0
                                                        Jun       Aug             Oct         Dec       Feb      Apr        Jun          Aug       Oct         Dec
                                                                          2020                                                    2021

                                                              0-4 years          5-11 years     12-19 years   20-39 years     40-59 years      60 years and older

Data as of December 7, 2021
Source: Detailed case data submitted to PHAC by the provinces and territories. Shaded area represents period of accumulating data.                                          4
Date is the earliest of symptom onset date, lab specimen collection date, lab result date, date reported to province or territory, and date reported to PHAC.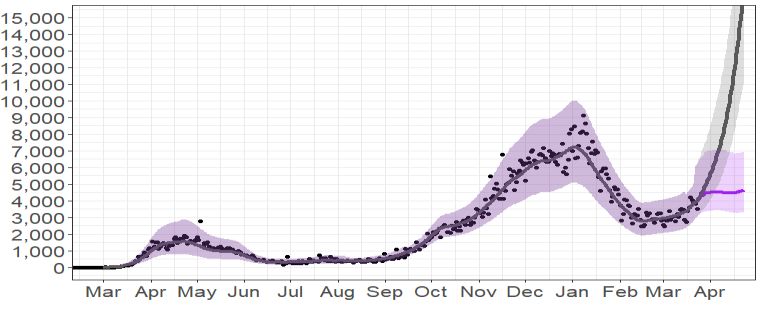
Outbreaks in school and childcare settings remain small in size and predominantly
  involve young children, under 12 years of age                         Incomplete data, due
                                                                                                                                to reporting lag
                                              1,750

                                                                                                                                    }
        Number of outbreak-associated cases

                                              1,500
            in school/childcare settings

                                              1,250

                                              1,000

                                               750

                                               500

                                               250

                                                 0
                                                  03 Jan 31 Jan 28 Feb 28 Mar 25 Apr 23 May 20 Jun 18 Jul 15 Aug 12 Sep 10 Oct 07 Nov
                                                                              Week outbreak declared (day month)

Data as of December 4, 2021 based on COVID-19 outbreaks and cases in school and childcare settings reported from Ontario and Quebec.
                                                                                                                                                   5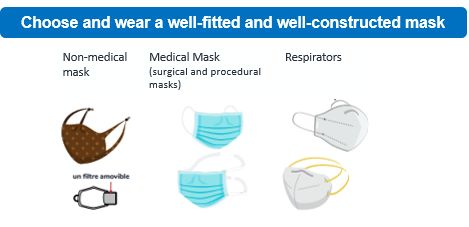
Delta variant continues to predominate in Canada and globally, while spread of
the Omicron variant has increased
                        Omicron (B.1.1.529) preliminary data suggest:
     Transmissibility                        Severity                            Immunity

• Potential to spread faster than     • Not known whether higher • Vaccine effectiveness under investigation;
  the highly transmissible Delta        or lower risk of severe    may decrease vaccine protection against
                                        illness and death          infection, but some level of protection
• South Africa: cases have risen                                   against severe disease likely to remain
  much quicker with Omicron           • Some types of current
  compared to previous waves            treatments may be less   • May be able to escape immunity from
                                        effective                  prior infection
• Greater transmissibility or
  reduced protection from prior       • Larger numbers of cases   • Canada/worldwide: cases detected in
  infection/vaccination could drive     could impact healthcare     both vaccinated and unvaccinated people
  resurgence                            capacity
       Vaccination, in combination with public health measures and individual protective practices
  continue to help control COVID-19 spread, including for Omicron and the predominating Delta variant

                                                                                                                6
Despite recent detection of the Omicron variant in multiple jurisdictions, Delta
continues to predominate in widespread but variable disease activity across Canada
Status of Omicron in Canada as of
December 9, 2021:
* * Omicron case(s)
confirmed
• Cases confirmed in seven
jurisdictions
• Majority linked to international
travel or close contact with
* * travelers
* • Some suspected community
* * transmission
* • Asymptomatic or mild
Health region level incidence data as of December 7, 2021.
Note: Map only shows COVID-19 cases where health region had been attributed in source data.
Data sources: COVID-19 Canada Open Data Working Group. Epidemiological Data from the COVID-19 Outbreak in Canada.
Statistics Canada. Table 17-10-0134-01 Estimates of population (2016 Census and administrative data), by age group and sex for July 1st, Canada, provinces, territories,
7
health regions (2018 boundaries) and peer groups.95% of Canadians now eligible for COVID-19 vaccines; >81% of the total population
have at least one dose and >76% are fully vaccinated as coverage continues to increase
Percentage of eligible people (≥ 5 years) with at least one dose and fully vaccinated by age group, as of December 4th, 2021
80+ 95% 96%
70-79 94% 95%
60-69 92% 93%
50-59 88% 90%
40-49 86% 89% 100%
30-39 82% 86%
18-29 82% 86%
12-17 82% 87%
5-11 1% 17%
0% 10% 20% 30% 40% 50% 60% 70% 80% 90% 100%
Fully vaccinated At least one dose
Data as of December 4, 2021
Note: Data obtained from the Canadian COVID-19 Vaccination Coverage Surveillance System. With the addition of some 11 year olds who turn 12 in 2021 -- and
received off-label vaccinations as part of the 12-17 year old program -- the 5 to 11 year age group has already achieved 17% coverage with at least one dose and 8
1% are fully vaccinated.Fully vaccinated people are at significantly lower risk of being
hospitalized with COVID-19
While COVID-19 vaccines continue to provide excellent protection against severe illness in all age
groups, the relative difference in rates between unvaccinated and fully vaccinated people is even
greater for youth and younger adults who are at lower overall risk of hospitalization
Among youth and adults Among older adults
aged 12 to 59 years, aged 60 years or older,
unvaccinated people were unvaccinated people were
32 times 16 times
more likely to be hospitalized more likely to be hospitalized
with COVID-19 than with COVID-19 than
fully vaccinated people fully vaccinated people
Data as of December 3, 2021 using data from October 26-November 20, 2021 from ten provinces and territories for the population 12 years or older, adjusting for age.
Definitions: unvaccinated cases include those who were unvaccinated at the time of their onset; fully vaccinated cases had onset ≥14 days from their second dose.
9Resurgence is forecast for Canada and could be further accelerated if
Omicron replaces Delta in the coming weeks
Reported cases DELTA Predominant
If transmission increases
by 15%
If we maintain the current
levels of transmission
If public health measures
reduce transmission by
15% today
OMICRON Replacement
If we maintain the current levels
of transmission and Omicron
successfully establishes*
2021 2022
*Underestimate - accounts for only increased
transmissibility but not immune evasion
Data as of December 6, 2021
Note: Output from PHAC-McMaster model. Model considers impact of vaccination and increased transmissibility of VOCs, 10
refer to annex for detailed assumptions on modelling.With the possibility of waning protection of vaccines, vaccinating children and
providing booster doses to adults could help reduce the impact through 2022
5-11 vaccination 5-11 vaccination 5-11 vaccination
Boosters for 18+ Boosters for 18+ Boosters for 18+
OUTCOME: OUTCOME: OUTCOME:
✓
hospital hospital hospital
! capacity ! capacity may capacity not
exceeded be exceeded, exceeded
but later
Hospital capacity for COVID-19 patients Restrictive closures lifted Vaccination of 5-11 year olds
Median hospitalization prevalence Personal physical distancing lifted Booster administration
Note: The grey shaded area represents the range of outcomes of model realisations; the black line represents the median value. The shaded blue area represents the vaccination rollout period for children aged 5-11 and
the shaded light orange area represents the vaccination rollout period for booster doses. The overall vaccine coverage varies between 79 and 85% depending on the scenario in the total population. The two vertical lines
are: lifting of restrictive PH measures (solid blue line, September 1, 2021), lifting of personal physical distancing (solid green line, March 1, 2022). The red dashed horizontal line represents the Canadian hospital bed limit
(31 beds per 100,000, updated January 25, 2021 from Health Canada data), this limit assumes 40% of all beds available for COVID-19 patients but will vary across provinces and territories. Includes potential impact of
11
waning immunity. Includes impact of Alpha and Delta, but not Omicron. See annex for detailed assumptions.International experience shows the need for continued vigilance
and timely response to emerging risks
1,000
900
Daily cases per 1,000,000 population
800
700 United Kingdom
Germany
600
500
400
United States
300
200 South Africa
100 Canada
0
Jan Apr Jul Oct Jan Apr Jul Oct
2020 2021
Data as of December 7, 2021
Source: Our World in Data
12Challenges remain, but with continued vigilance, expansion of vaccination programs,
and layers of protection we can celebrate the holidays more safely
Canada is Better Protected
Despite the challenges ahead, we have more and better protections going with COVID-19 vaccines
into this holiday and winter season than previously. 62 M+ COVID-19 vaccines given
Canada’s approved vaccines provide substantial protection to dampen 29 M+ fully vaccinated!
the severity of the virus and improved layers of protection can reduce the 2 M+ 3rd doses given
risk of infection and spread in our homes and community settings. THANK YOU!
Looking to the holidays and weeks ahead, caution is still warranted, but
with better protection and more choices we can celebrate more safely: Lowering the risk with layers
• Safer when all who are eligible get fully vaccinated + get a booster dose as
recommended
• And, regardless of our vaccination status, we can stay safer over the holidays by:
• keeping up with public health advice as the situation evolves, and
• using the best available layers of protection, particularly if indoors with others outside
of our immediate household, including:
• wear a well-constructed and well-fitting face mask
• keep gathering sizes small, improve ventilation
• maintain hand and cough hygiene
• stay home and away from others in the event of any symptoms
• get tested, especially if symptomatic or as recommended
Winterize your layers for better protection now; learn more about:
• COVID-19 Vaccines and Booster Doses: https://www.canada.ca/en/public-health/services/diseases/coronavirus-disease-covid-19/vaccines.html
• Well-constructed, well-fitting face masks https://www.canada.ca/en/public-health/services/publications/diseases-conditions/types-masks-respirators.html 13
• Improving indoor ventilation: https://www.canada.ca/en/public-health/services/publications/diseases-conditions/ventilation-helps-protect-against-spread-covid-19.htmlANNEX
14Short-term forecast predicts accelerated increase in cumulative cases
corresponding to the increase of daily cases
Cumulative cases predicted to December 19, 2021: Daily cases predicted to December 19, 2021:
1,845,770 to 1,873,780 2,050 to 6,720
1,870,000 7,000
6,000
1,850,000
5,000
1,830,000
4,000
1,810,000
3,000
1,790,000
2,000
1,770,000 1,000
1,750,000 0
24 Nov 29 Nov 04 Dec 09 Dec 14 Dec 19 Dec 17 Jul 14 Aug 11 Sep 09 Oct 06 Nov 04 Dec
2021 2021
Cumulatively reported cases in Canada by Dec. 4 Daily numbers as reported 7-day running average
Prediction to Dec.19 with plausible range Prediction of the 7-day running average with range
Cases added since Dec. 4 when the predictions were made Daily numbers reported after the prediction was made
Data as of December 4, 2021
Note: Extrapolation based on recent trends using a forecasting model (with ranges of uncertainty). 15Short-term forecast predicts steady increase in cumulative deaths
corresponding to the predicted steady trend of average daily deaths
Cumulative deaths predicted to December 19, 2021: Daily deaths predicted to December 19, 2021:
30,500 29,845 to 30,285 6 to 30
100
30,250
90
80
30,000
70
60
29,750
50
40
29,500
30
29,250 20
10
29,000 0
24 Nov 29 Nov 04 Dec 09 Dec 14 Dec 19 Dec 17 Jul 14 Aug 11 Sep 09 Oct 06 Nov 04 Dec
2021 2021
Cumulatively reported deaths in Canada by Dec. 4 Daily numbers as reported 7-day running average
Prediction to Dec.19 with plausible range Prediction of the 7-day running average with range
Cases added since Dec. 4 when the predictions were made Daily numbers reported after the prediction was made
Data as of December 4, 2021
Note: Extrapolation based on recent trends using a forecasting model (with ranges of uncertainty). 16Resurgence is currently forecast for Ontario and Quebec, and possibly other
jurisdictions if Omicron replaces Delta
Reported cases
DELTA Predominant
If transmission increases
by 15%
If we maintain the current
levels of transmission
If public health measures
reduce transmission by
15% today
OMICRON Replacement
If we maintain the current levels
of transmission and Omicron
successfully establishes*
*Underestimate - accounts for only increased
transmissibility but not immune evasion
Data as of December 6, 2021
Note: Output from PHAC-McMaster model. Model considers impact of vaccination and increased transmissibility of VOCs, refer to annex for detailed
assumptions on modelling. In provincial plots, dark green vertical lines represent reopening/lifting measures, red vertical lines represent 17
reimplementation/reinforcement of measures.Since November 5th forecast, cases have risen along the increased
transmission trajectory (blue)
Reported cases
If transmission
increases by 15%
If we maintain the
current levels of
transmission
If public health
measures reduce
transmission by 15%
Red points – Surveillance data
2021 after the forecast from
November 2nd to December 6th
Model data as of November 1st, 2021. Surveillance data as of December 6th, 2021.
Note: Output from PHAC-McMaster model. Model considers impact of vaccination and increased transmissibility of VOCs (including Delta 18
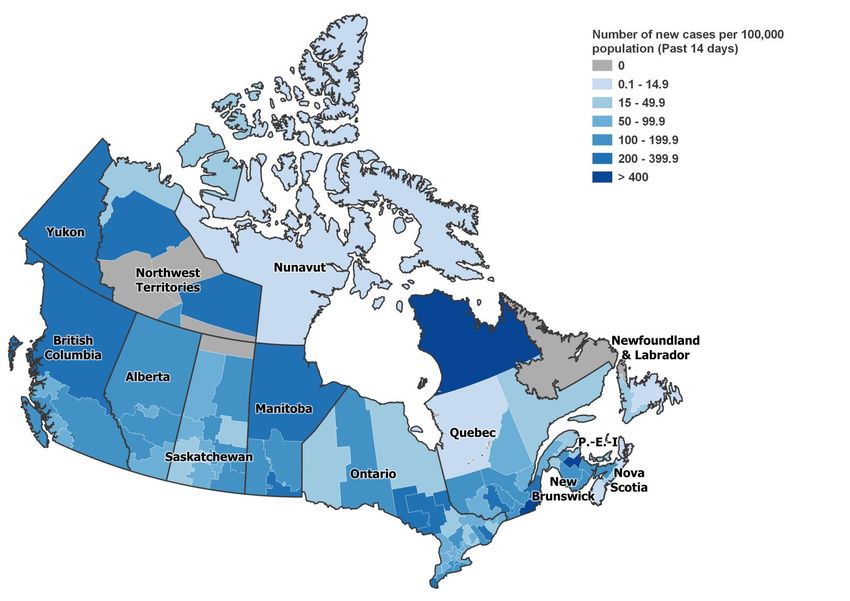
but not including Omicron), refer to annex for detailed assumptions on modelling.Types of models used to inform decision making
Statistical forecast models:
• Short-range forecast of expected cases given recent incidence
Long-range forecast models:
• Dynamic compartment model adapted to project near-future
Reported cases
given recent incidence and scenarios for control/release/variants
of concern
Models to explore scenarios of opening up:
• More complex models
• Deterministic, age structured compartment model
• Agent-based model
• Initially developed to model control measures needed
• Recently adapted to model effects of vaccination and
transmission of VOC
Details on modelling and assumptions: https://www.sciencedirect.com/science/article/pii/S1755436521000177;
https://www.canada.ca/en/public-health/services/reports-publications/canada-communicable-disease-report-ccdr/monthly-issue/2020-46/issue-6-june-4-2020/predictive-
modelling-covid-19-canada.html; https://nccid.ca/news/phac-modelling/; https://www.canada.ca/content/dam/phac-aspc/documents/services/reports-publications/canada- 19
communicable-disease-report-ccdr/monthly-issue/2020-46/issue-11-12-nov-5-2020/ccdrv46i1112a08-eng.pdf; https://www.cmaj.ca/content/192/37/E1053.longLonger-range forecasting model assumptions
• The forecast uses compartmental models reflecting the biology of COVID-19 and public health response developed by
PHAC in collaboration with McMaster University. It projects the near future given recent incidence of COVID-19 and
scenarios for public health measures, variants of concern and vaccination.
• The model assumes that the B.1.617.2 (Delta) VOC is 50% more transmissible compared to B.1.1.7 (Alpha). This value is
used to estimate the rate at which VOCs replace existing strains. Ongoing virus evolution is not accounted for and at this
stage effects of the B.1.1.529 (Omicron) VOC are included in only one of the forecasts.
• Delta is considered to have been introduced in mid-March at very low prevalence, with provincial variations. The proportion
of cases due to VOCs are indirectly fitted when calibrating to data.
• A simplified approach to modelling the Omicron variant is utilized for one forecast in which it is assumed that i) combined
transmissibility and immune escape effects result in transmissibility 3x that of Delta; ii) Omicron replaces Delta at the rate
seen in Gauteng, Republic of South Africa; and iii) 0.1% infections on Dec 3rd were Omicron.
• The national forecast includes four scenarios for changes in the effective transmission rate as of Nov 15 th as no additional
reopening/lifting plans are scheduled. This includes three scenarios showing expected change without Omicron replacing
Delta: if effective transmission rates do not increase (grey line); if effective transmission increases by 15% (blue line); and
if effective transmission decreases by 15% (purple line). The fourth scenario shows expected change if Omicron replaces
Delta and effective transmission rates do not increase (orange line). There are uncertainties with the amount of
transmission which propagates forward in the forecasting scenarios.
• The forecast includes current vaccine roll-out, assumes that vaccinations are 60% effective against infection after one
dose and 90% after the second dose for all variants except for Delta (against which effectiveness if 30% after one dose
and 80% after the second dose). The vaccine projections assume 8% for first dose and 10% for second dose hesitancy of
the eligible population (ages 5+). Waning of immunity is not accounted for.
20Assumptions for the PHAC agent-based model
• The vaccine is 60% effective at preventing infection and 80% effective at preventing hospitalization after one dose, and 92% effective at preventing infection and 96%
effective at preventing hospitalization after two doses;
• A VOC modelled on B.1.1.7 (Alpha) was introduced in December 2020 and is 50% more transmissible and 40% more virulent than the wild-type strain, but does not
have immune escape from vaccines; A second VOC modelled on B.1.617.2 (Delta) was introduced in March 2021 and is 100% more transmissible and 80% more
virulent than the wild-type strain with immune escape from vaccines causing a 33% reduction in protection against infection after the first dose and a 6% reduction in
protection against infection after the second dose. B.1.1.529 (Omicron) variant is not included in the model;
• Hospital bed capacity available for COVID-19 patients in Canada is estimated at 31 per 100,000;
• The vaccination period begins Dec 14, 2020 and varies by scenario (Dec 2021 – no children or booster vaccination, June 2022 – with children vaccination only and
March 2023 – with children and booster vaccination). The website COVID-19 Tracker Canada - Vaccination Tracker (covid19tracker.ca) is used to calculate current
and expedited vaccination rates +/- 1% of the real time rates. Vaccine acceptance is from the November 18, 2021 Canadian Immunization Centre report which
contains data for vaccination including, and up to, November 13, an additional 1% to 4.5% of vaccine coverage is projected for age groups up to 69 years of age
because these groups are currently actively receiving the vaccine.
• Vaccine coverage is an estimated 90.3% in the population 12 years and over, and 78.8% in the total population for scenarios without vaccination of children or
boosters. Vaccination coverage is 89.5% in the eligible population (5 years and over) and 84.8% in the total population for scenarios with vaccination of children or
boosters. Vaccination roll-out for 12+ proceeds in order of priority groups with a 4-month interval between doses starting from March 4, 2021. The 4-month delay
progressively decreases to a 28-day interval by June. Vaccination roll-out for 5 to 11 years proceeds using an 8-week delayed dose interval.
• Boosters are administered in the same order of priority as the 1 st and 2nd doses and at a minimum of six months after the receipt of the 2 nd dose. Boosters are
imperfect and provide protection against infection, symptoms, hospitalisations and deaths up to the level acquired by the 2 nd dose, time to waning immunity is reset
providing another six months period in which immunity is retained before waning begins;
• Following vaccination or infection, after a six month period, protection against re-infection wanes but protection against hospitalisation and death persist and do not
wane. The rate of waning occurs faster in individuals 65 years and over (complete waning over two years versus complete waning over three years for under 65);
• Infection-acquired immunity and vaccine-acquired immunity wanes within the same time period and protection against infection, hospitalisation and death from
infection is assumed to be the same as protection provided by two full doses of the vaccine. Individuals who are infected twice or are infected and fully vaccinated
confer life-long immunity.
• For all scenarios, a two-step gradual approach to lifting public health measures was modelled. Restrictive measures are lifted gradually in early summer (when at least
75% of those 12 and over have received their first dose and approximately 15% have received their second dose). The easing of personal protective measures occurs
in mid-summer (when at least 80% of those 12 and over have received their first dose and approximately 50% have received their second dose), with return to
approximately 100% of pre-pandemic contact rates by March 1, 2022.
• Reopening of the Canadian border to travellers commences on July 5, 2021 (Stage 1), August 2 (Stage 2) and September 7 (Stage 3), these stages correspond with
varying estimates of imported cases as estimated from the PHAC importation risk model. Prior to Stage 1 reopening, the number of imported cases was estimated to
be 2 per 100,000 per week (one transient and one permanent case). Prior to lifting of public health measures, the epidemic is controlled by a combination of restrictive
closures, case detection and isolation, contact tracing and quarantine, and physical distancing.
21You can also read