A high-resolution weather forecasting tool for marine operations management in ports and harbours
←
→
Page content transcription
If your browser does not render page correctly, please read the page content below
A high-resolution weather forecasting tool for marine operations
                     management in ports and harbours
                                  Peter J. McComb and David L. Johnson
                    1
                        MetOcean Solutions Ltd, New Zealand; p.mccomb@metocean.co.nz

Abstract
A web-based tool that provides marine managers and operational personnel with high-resolution and site-
specific weather data and forecast information is presented and described. MetOceanView (MOV) an
operations planning tool and platform, uses the latest ocean and atmospheric forecast models and
customised at the most appropriate scale for a port or harbour situation. Transformation of waves along the
shipping approaches and into the entrance region is captured, along with the coastal currents, water levels
and winds. With bathymetry data for calibration, long wave surging at the berths can also be predicted with
good accuracy. Integration of real-time measured waves, long waves and winds through MOV allows quality
forecast accuracy, enabling short range weather trends to be further monitored.
Keywords: custom marine forecasting, harbour surge, dredging, port management.

1.    Introduction                                      application shows the benefit of spatial overlay
Many ports and harbours experience occasions            maps of the local marine conditions.
when energetic weather conditions lead to
                                                        2.     Forecast system overview
operational issues. These may relate to underkeel
                                                        The operational forecast system is configured at
clearance for the entrance or exit transit, agitation
                                                        global, regional and local scales; allowing a truly
at the berth due to swell penetration or longwave
                                                        customised solution to be established for any
surge and high winds influencing vessel
                                                        location. The high-resolution domains can be
management for example. Other activities, such as
                                                        rapidly deployed, and a typical port system can be
dredging, survey or construction typically require
                                                        established within 2-3 days of notification. Full
low energy conditions for safe execution. Effective
                                                        access to the forecast data is provided by an
planning for these activities requires reliable
                                                        innovative set of web-based tools, and through
quantification of site specific weather parameters
                                                        delivery by email, as discussed in subsequent
over short and medium (5-7 days) forecast range.
                                                        sections.
To meet this need, a set of web-based tools (MOV
                                                        2.1     Global scale model
- MetOceanView) has been developed to allow
                                                        An in-house global WaveWatch3 (WW3) domain is
access and management of harbour-scale                                             o
                                                        run 4 times per day at 0.5 resolution using wind
weather.
                                                        fields from NCEP’s Global Forecast System (GFS).
The core forecast system architecture is founded        Remote-sensed wave data are assimilated into
on modern high-resolution ocean and atmospheric         each cycle. Forecasts produced with a 7 day
models, customised at appropriate scales for the        horizon. As part of the WW3 implementation, full
actual port or harbour location as well as the          spectral boundaries are also generated for the
shipping approaches. The numerical models allow         nested regional domains.
the detailed transformation of waves from offshore
                                                        2.2    Regional and local scale models
and into the entrance regions, as well as the
                                                        A series of multi-nested SWAN [2] wave model
coastal currents and water levels. The wind fields
                                                        domains provide detailed resolution at the
influenced by the regional topography can also be
                                                        necessary regional and local scales. For a port
resolved.
                                                        location, a 3-stage nest from the global domain is
Ingestion of real-time measured wave and wind           typically prescribed, although an additional level
data into MOV allows the forecast accuracy and          may be required in regions with highly complex
trends to be co-plotted and therefore assessed on       bathymetric settings. An example of the nested
a daily basis. The core forecast configurations also    wave domains used for the operational Port
assimilate observed data where possible to              Taranaki implementation is shown in Figure 1.
improve short range forecasts.
                                                        Wind fields within these nested domains are
Examples of the forecast system are presented           sourced from either the NOAA GFS or from
here for four operational situations. Port Taranaki     customised WRF atmospheric model domains.
and Port Geraldton lie within complex reef and          Local validation is initially performed to determine if
nearshore bathymetry, and experience high energy        increased resolution over the GFS scale is
swell conditions and occasions with problematic         warranted. A 6-8 km WRF domain is often
longwaves. Das Island in the Persian Gulf provides      beneficial in coastal regions with significant
a lower energy example for the management of            topographic influence, such as New Zealand
dredging operations, while the Port of Los Angeles      waters or the Bass Strait (see Figure 2).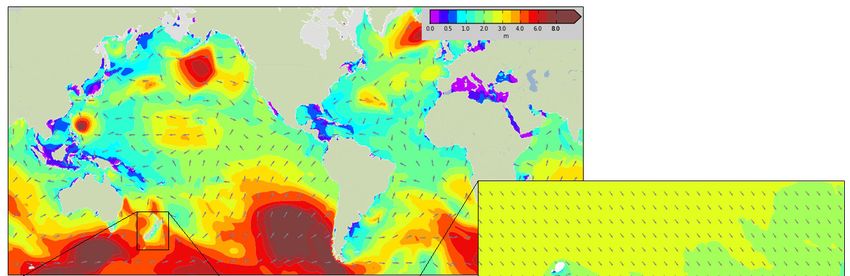
Global scale 0.5 deg

                                                                                 Regional scale 5 km

                                                                                 Sub regional scale 500 m

                                                                              Port scale forecast model
                                                                              domain at 25 m resolution

Figure 1 Example of the multi-nested forecast domain implemented for Port Taranaki in New Zealand.

                                                             Regional current models are run in some domains,
                                                             with resolution of between 1 and 5 km. A 2D
                                                             implementation of POM [5] is used for current
                                                             modelling, with wind velocity components and
                                                             atmospheric pressure interpolated in space and
                                                             time onto the model grid. The TPXO7.2 global
                                                             inverse tidal solution [1] is used to prescribe the
                                                             tidal elevation and current velocity boundaries.
                                                             Any number of reporting sites can be set within the
                                                             domain, producing hourly site-specific data over
                                                             the 7-day forecast horizon.
                                                             2.3    Calibration and validation
                                                             The wave physics within the forecast domain are
                                                             usually calibrated against the available historical
                                                             wave data in the vicinity of the port, or from the
                                                             nearest offshore buoy source. The calibration
                                                             process ensures the appropriate bed friction and
                                                             grid resolution has been applied to the domain.
                                                             Once operational, data from within the nested
                                                             domains can be directly compared with real-time
                                                             wave measurements and ongoing model
                                                             adjustment applied as necessary. Forecast
                                                             accuracy and short term weather trends can also
                                                             be assessed at any time. An example from an
                                                             offshore wave buoy in New Zealand is provided in
Figure 2 Comparison of the wind field during a strong        Figure 3.
southwesterly event the Bass Strait. Upper map is from
GFS, lower map is a local WRF domain at 8 km                 All site-specific forecast data are archived. This
resolution. Effective marine forecasting requires data       allows forecast accuracy analysis to be post-
sources that suit the local topographic complexity and       processed; determining the statistical measures of
wave generation characteristics.                             accuracy at forecast horizons up to 7 days ahead.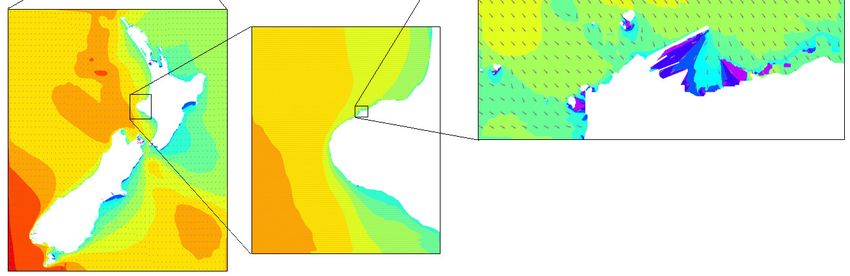
Figure 3 Real time wave data are ingested into the forecast system, providing an instant comparison of the measured
and forecast values. This feature is very useful for interpreting weather trends and providing guidance for short range
operational decisions. Shown here are the measured (solid) and forecast / nowcast (dashed) wave height and peak
period from a site west of Cape Farewell, New Zealand.

2.4 Long period wave (LPW) forecasting                             •    Site data presented as graphs and tables.
Problematic surging and agitation of berthed                       •    User-defined hazard alerts.
vessels can be directly related to long period                     •    Observed wave and wind data from local
waves (LPW) that penetrate a harbour defences.                          stations plotted alongside forecast values.
Both the LPW and the surge events can be reliably                  • Wind ensembles from GFS and WRF.
forecast at discrete locations within a harbour                    • Report generation including statistics.
basin [3]. This LPW energy lies in the 25-150 s                The 7-day wind ensembles provide a valuable
period range, and is released during the swell                 guide to forecast confidence, as indicated by the
wave      transformation    process.   Accordingly,            spread in speed and direction, as shown on Figure
bathymetric features in the vicinity of a harbour              4. Other data, such as rainfall, sea and air
entrance tend to govern the LPW energy                         temperature and wind gusts are also available.
distribution and also the degree of penetration into           The first six hours of each cycle are archived into a
the harbour. Once inside the harbour, the internal             readily available ‘nowcast’ of the metocean
geometry often plays an important role in LPW                  conditions over the previous 12 months, which can
energy regime and vessel surging dynamics.                     be downloaded as a text file. Site-specific reports
Resonance (or seiche) effects may amplifying the               are generated every forecast cycle, and include
signal; often within very discrete areas of the                graphs (Figure 5) and tables as well as regional
harbour. Analysis by the authors of data from 11               synoptic charts. The forecast reports are auto-
different harbours has confirmed that berth LPW                emailed in pdf format to the client distribution list at
conditions are highly correlated to swell wave                 the user-specified frequency.
spectra parameters from outside the harbour.
While the LPW generation process is location-
specific, complex and highly non-linear, a robust
semi-empirical technique can be used to transform
the swell wave spectra from a representative
location outside the harbour to the LPW conditions
at discrete berths inside the harbour. The forecast
accuracy of this method is equivalent to that
achieved for the swell waves at the harbour
entrance. LPW data from inside the port is needed
for calibration of the technique, and a period of at
least 3 months duration is normally specified.
2.5 Data access and delivery
A full suite of forecast data and interactive tools is
available from a website login for clients. The 7-
day marine forecast data include;                              Figure 4 The spread of the wind forecast ensembles
    • Maps of wave height, direction, period,                  provides guidance on the forecast confidence and
         wind speed and direction.                             stability. Example shown here for the Port of Melbourne.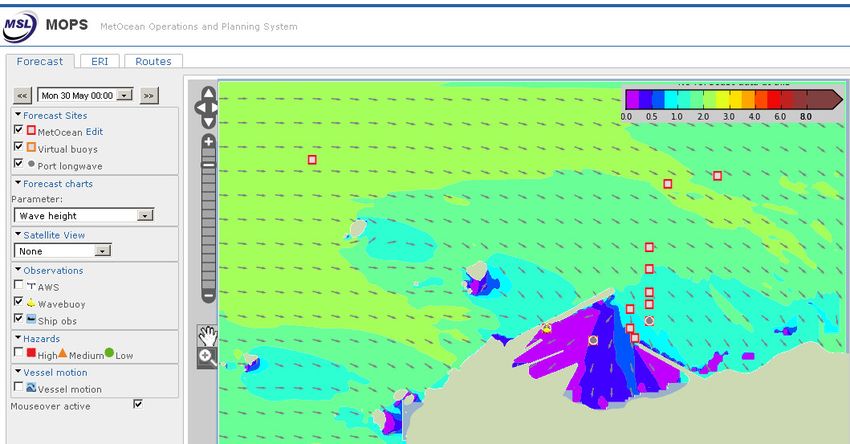
Figure 5 Forecast graphs are updated 4 times per day. These graphs, along with data tables and synoptic maps, are
auto-emailed as pdf files to the client distribution list. Shown here is the waverider location offshore of Eden, NSW.

Figure 6 The MOV interface to the wave domain for Port Taranaki. High resolution in the wave model is needed to
account for the local complexity including adjacent islands. Measured and forecast site-specific data are accessed from
this interface, including site along the channel for underkeel clearance and berth locations for surge and vessel agitation.
3.    Example MOV implementations                          conditions were Hs=2.7 m with Tp=15 s. Notably,
                                                           LPW events of this magnitude are clearly evident
Port Taranaki, New Zealand                                 in the forecast guidance some 5-7 days in
Port Taranaki, on the west coast of the North              advance, allowing management plans to be
Island of New Zealand, is situated in an energetic         developed and adopted accordingly.
wave climate with complex nearshore bathymetry.
The MOV implementation here features a three-
stage SWAN nest, with the final stage at 25 m
resolution (Figure 6). Wave and wind data are
ingested from four discrete locations (wave buoy, 2
long wave gauges, 1 wave platform and 2 wind
sensors). Forecast data are produced for sites
along the leads as well as at the main berths and
the offshore anchorages.
The LPW energy that enters Port Taranaki is
strongly modulated by tide level, as can be seen in
the forecast example provided in Figure 7. The
tidal modulation is of particular interest; causing a
near doubling of the long wave heights over a
spring tide. Also provided on the LPW forecasts
are thresholds for guidance. These vary slightly
from port-to-port, but many years of operational
experience confirms that 0.1 m is the initial              Figure 8 Comparison of the measured and forecast
threshold for concern (i.e. problematic moored             (T+6-12 hours) significant long wave heights at the
                                                           Moturoa Berth, Port Taranaki. Data from May 2011.
vessel motion and surging do not usually occur
below 0.1 m). Active management strategies are             Port Geraldton, Western Australia
typically employed from 0.15 m, while at 0.20 m            The approaches to Port Geraldton in Western
and above, safe berth conditions are likely to be          Australia pass through a 3 km wide reef platform –
compromised.                                               a zone featuring significant wave transformation
                                                           and long wave generation, along with bathymetric
                                                           focussing of the swell and long wave energy
                                                           toward the harbour entrance [4]. Tide level does
                                                           not modulate LPW energy in Geraldton Harbour,
                                                           and the adjacent cross-shore profile / morphology
                                                           is considered by [6] to be influential on that
                                                           process.
                                                           An     extensive   SWAN      domain      (resolution
                                                           approximately 50 m) is required to forecast wave
                                                           heights from around 30 m depth in to the harbour
                                                           entrance. The Geraldton wave climate is affected
                                                           by the offshore Abrolhos Island group,
                                                           necessitating a regional SWAN nest at around 2
                                                           km resolution and extending some 100 km
                                                           offshore. Long wave and swell wave forecasts are
                                                           produced for specific berths within the harbour. As
Figure 7 Example of the forecast long wave heights at      for Port Taranaki, operational thresholds have
the Moturoa Berth, Port Taranaki. Note the modulation of   been developed for surge management of moored
the wave heights by tide level. A 0.1 m long wave height   vessels. Evaluation of real time LPW berth data
threshold is set as the warning level for vessel surge;
                                                           alongside the forecast guidance provides
displayed as a dashed line on the forecast graph.
                                                           additional confidence when adopting proactive
Within MOV the forecast long wave heights are              management strategies.
compared with real time measured values from the           Das Island Terminal, Persian Gulf
Moturoa berth, allowing the trends to be actively          The Persian Gulf forecast domain provides 3 km
monitored. Consideration of the timing of the long         resolution of the wave climate, while Das Island
wave height peak relative to the tide level is an          (UAE) is smaller than that scale at 1.5 km x 3 km.
effective management strategy at this port. Shown          To support dredging operations at the Island, a
on Figure 8 are the measured LPW heights along             high resolution (50 m) nest was established to
with the forecast values from the T+6-12 hour              resolve the topographic sheltering and wave
forecast horizon. During this energetic event the          refraction processes for the operational areas.
measured LPW heights peaked at 0.20 – 0.25 m               Island wave climates are strongly influenced by the
while the co-temporal forecast offshore swell              directionality of the prevailing weather; subtle
changes in direction can have operational levels and winds. With data for calibration, long
implications and customised modelling at the wave surging at the berths can also be predicted
appropriate scale is an effective tool to manage with good accuracy. Integration of real time
this variability. Because the wave conditions in the measured waves, long waves and winds into MOV
Persian Gulf closely follow the local and regional allows the forecast accuracy and short range
wind developments, interpretation of the primary weather trends to be monitored.
wave guidance (e.g. Fig. 5) alongside the wind
5. References
ensemble data (e.g. Fig. 4) provides an effective
[1] Egbert, G. and Erofeeva, L. (2002) Efficient
technique to gauge the forecast uncertainly.
inverse modelling of barotropic ocean tides.
Journal of Atmospheric and Oceanic Technology,
Port of Los Angeles, USA
19, N2.
A 2-stage nest is deployed for the Port of Los
Angeles, with the first stage extending over [2 Holthuijsen, L. (2007). Waves in Oceanic and
Southern California and capturing the offshore Coastal Waters. Cambridge University Press. ISBN
islands. Forecast validation within the domain is 0521860288, 9780521860284.
available from 28 NDBC wave and weather buoys.
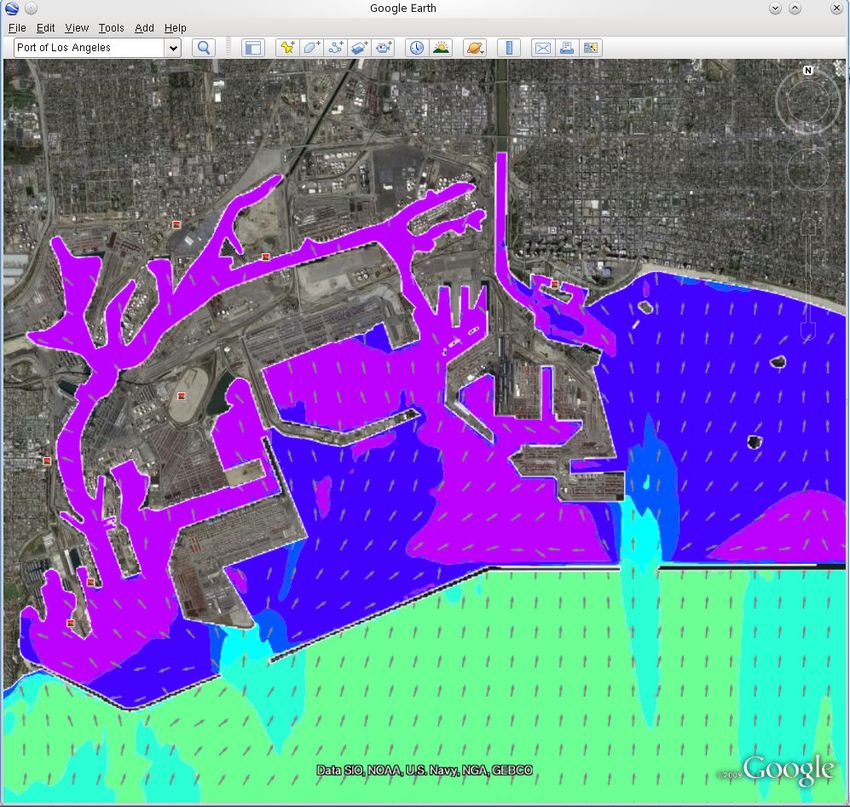
In this implementation, the forecast wave data [3] McComb, P., Gorman, R, and Goring D. (2005).
(height, period and direction) plus the wind speed Forecasting infragravity wave energy within a
and direction data are supplied as ESRI GIS layers harbour. Proceedings of WAVES 2005, July 2005,
at 6-hourly increments over the 7-day forecast Madrid.
horizon. An example is shown for a Google Earth [4] McComb, P., Johnson, D., and Beamsley, B.
export in Figure 9. (2009). Numerical model study to reduce swell and
long wave penetration to Port Geraldton.
4. Summary Proceedings of 2009 Pacific Coasts and Ports
The MetOceanView System (MOV) provides Conference, Wellington, New Zealand.
marine managers and operational personnel with
site-specific data and forecast information. The [5] Mellor, G.L. (2004) Users guide for “A three-
system architecture uses the latest ocean and dimensional, primitive equation, numerical ocean
atmospheric forecast models, customised at the model”. Princeton University, Princeton, NJ.
most appropriate scale for a port or harbour [6] Thomson, J., Elgar, S., Raubenheimer, B.,
situation. The transformation of waves along the Herbers, C. and Guza, R. (2006). Tidal modulation
shipping approaches and into the entrance region of infragravity waves via nonlinear energy losses in
is captured, along with the coastal currents, water the surfzone. Geophys. Res. Lett., 33, L05601.
Figure 9 All MOV forecast data products are available as industry-standard GIS layers. Shown above is wave height
and direction at the Port of Los Angeles; projected here using Google Earth.You can also read