UNWTO World Tourism Barometer May 2020 - Special focus on the Impact of COVID-19 - AWS
←
→
Page content transcription
If your browser does not render page correctly, please read the page content below

UNWTO World Tourism Barometer May 2020
   Special focus on the Impact of COVID-19

Index   •   Executive Summary

        •   The Context
            COVID-19 Timeline
            Travel restrictions

        •   The Impact of COVID-19 on International Tourism - January-March 2020
            International Tourist Arrivals
            Air Travel
            Hospitality

        •   Looking Ahead
            Scenarios for international tourism 2020
            Recovery Prospects
            The most affected destinations and markets
            The Economic Factors
            Challenges and Opportunities
Executive   • The world is facing an unprecedented global health, social and
              economic emergency with the COVID-19 pandemic.
Summary     • Travel and tourism is among the most affected sectors with
              airplanes on the ground, hotels closed and travel restrictions put
              in place in virtually all countries around the world.

            • In an unprecedented blow to the tourism sector, the COVID-19
              pandemic has cut international tourist arrivals in the first quarter
              of 2020 to a fraction of what they were a year ago.

            • Available data points to a double-digit decrease of 22% in Q1
              2020, with arrivals in March down by 57%. This translates into
              a loss of 67 million international arrivals and about USD 80
              billion in receipts.
Executive   • Prospects for the year have been downgraded several times
              since the outbreak in view of the high level of uncertainty.
Summary     • Current scenarios point to declines of 58% to 78% in
              international tourist arrivals for the year, depending on the speed
              of the containment and the duration of travel restrictions and
              shutdown of borders, although the outlook remains highly uncertain
              (the scenarios are not forecasts and should not be interpreted
              as such).

            • The scenarios reflect three possible patterns of monthly change
              in arrivals from April to December 2020 supposing that travel
              restrictions start to be lifted and national borders opened in early
              July (Scenario 1: -58%), in early September (Scenario 2: -70%) or in
              early December (Scenario 3: -78%).

            • These scenarios would put 100 to 120 million direct tourism
              jobs at risk.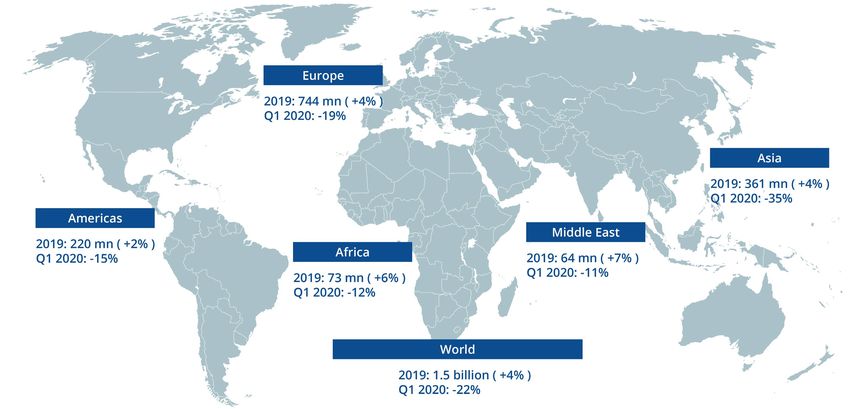
Executive   • This is by far the worst result in the historical series of
              international tourism since 1950 and would put an abrupt end
Summary       to a 10-year period of sustained growth since the 2009 financial
              crisis.

            • Sentiment expressed by the UNWTO Panel of Experts points
              to a start of the recovery of international demand mostly
              in 2021. According to Panel Experts from around the world,
              domestic demand would recover faster than international
              demand.

            • Considerable challenges remain ahead, starting with the
              unknown duration of the pandemic and travel restrictions, in
              a context of global economic recession. Countries around the
              world are implementing a wide range of measures to mitigate the
              impact of the COVID-19 outbreak and to stimulate the recovery of
              the tourism sector.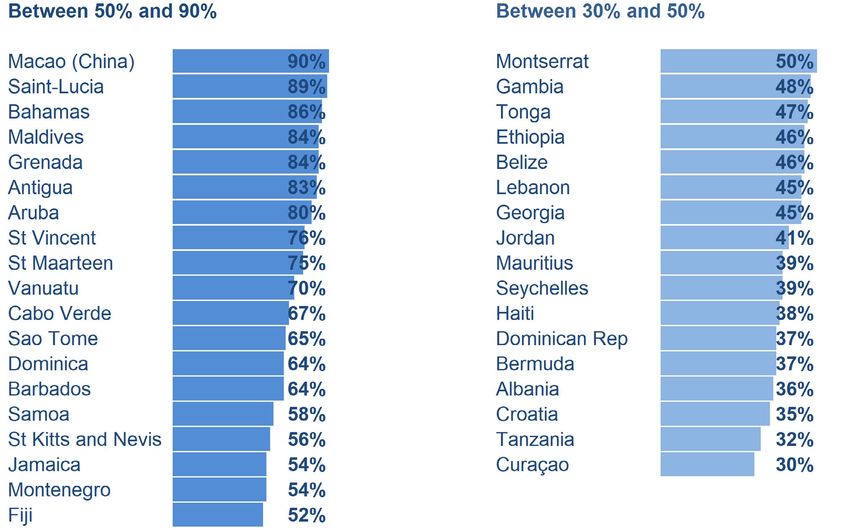
The Context
COVID-19 timeline

   Source: World Tourism Organization (UNWTO)
Travel           • According to UNWTO’s Report on COVID – 19 Related Travel
                         Restrictions, as of 20 April, 100% of all worldwide destinations
Restrictions             have introduced travel restrictions in response to the pandemic.

                       • 97 destinations (45%) have totally or partially closed their borders
100% of worldwide        for tourists.
 destinations have     • 65 destinations (30%) have suspended totally or partially
 introduced travel       international flights.
     restrictions in
                       • 39 destinations (18%) are implementing the closing of borders in a
   response to the
                         more differentiated manner by banning the entry for passengers
         pandemic        from specific countries of origin”.
EVOLUTION OF
TRAVEL
RESTRICTIONSThe impact of COVID-19 on international tourism
January-March 2020International • Available data points to a double-digit decrease of 22% in
international tourist arrivals in Q1 2020, with arrivals in the
Tourist month of March down by 57% following the start of the lockdown
in many countries, widespread travel restrictions and the
Arrivals shutdown of airports and national borders.
January - March • This represents a loss of 67 million international arrivals in the
2020 first quarter of 2020 compared to the same period of last year.
• By regions, Asia and the Pacific, the first region to suffer the
impact of COVID-19, saw a 35% decrease in arrivals in Q1 2020.
The second-hardest hit was Europe with a 19% decline, followed
by the Americas (-15%), Africa (-12%) and the Middle East (-11%).International tourist arrivals by region in Q1 2020 Source: World Tourism Organization (UNWTO)
International tourist arrivals fell sharply in March 2020
       International tourist arrivals, Jan, Feb, March 2020 (% change)
                                                    Asia and the
                    World
                    World          Europe              Pacific               Americas                Africa     Middle East
             +20
                                   +6 +6                                                        +4 +4             +6 +5
                   +2                                                        +0 +3
              +0
                                                        -2
                        -9
             -20

             -40
                                                             -37
                                                                                                                          -41
                                                                                      -46                -44

             -60             -57
                                           -60
                                                                 -64                          Jan.      Feb.      Mar.

             -80
                                                                                                               Data is provisional
                                                 Source: World Tourism Organization (UNWTO)
Sharp drop of international arrivals in March 2020
World: International tourist arrivals by months (millions)
160
140
120
100
(millions)
80
2020*
60 2019
2018
40
2017
20
0
Jan. Feb. Mar. Apr. May Jun. Jul. Aug. Sep. Oct. Nov. Dec.
* Data for January-March 2020 is provisional and includes estimates for countries which have not yet reported data.
Source: UNWTOAll regions suffered a strong decline in March 2020
Europe: International tourist arrivals by months (millions)
100
80
60
(millions)
2020*
40
2019
2018
20 2017
0
Jan. Feb. Mar. Apr. May Jun. Jul. Aug. Sep. Oct. Nov. Dec.
* Data for January-March 2020 is provisional and includes estimates for countries which have not yet reported data.
Source: UNWTOAll regions suffered a strong decline in March 2020
Asia and the Pacific: International tourist arrivals by months (millions)
35
30
25
20
(millions)
15 2020*
2019
10 2018
2017
5
0
Jan. Feb. Mar. Apr. May Jun. Jul. Aug. Sep. Oct. Nov. Dec.
* Data for January-March 2020 is provisional and includes estimates for countries which have not yet reported data.
Source: UNWTOAll regions suffered a strong decline in March 2020
Americas: International tourist arrivals by months (millions)
25
20
15
(millions)
2020*
10
2019
2018
5 2017
0
Jan. Feb. Mar. Apr. May Jun. Jul. Aug. Sep. Oct. Nov. Dec.
* Data for January-March 2020 is provisional and includes estimates for countries which have not yet reported data.
Source: UNWTOAll regions suffered a strong decline in March 2020
Africa: International tourist arrivals by months (millions)
8
7
6
5
(millions)
4
2020*
3 2019
2018
2
2017
1
0
Jan. Feb. Mar. Apr. May Jun. Jul. Aug. Sep. Oct. Nov. Dec.
* Data for January-March 2020 is provisional and includes estimates for countries which have not yet reported data.
Source: UNWTOAll regions suffered a strong decline in March 2020
Middle East: International tourist arrivals by months (millions)
8
7
6
5
(millions)
4
3
2020*
2 2019
2018
1
2017
0
Jan. Feb. Mar. Apr. May Jun. Jul. Aug. Sep. Oct. Nov. Dec.
* Data for January-March 2020 is provisional and includes estimates for countries which have not yet reported data.
Source: UNWTOAir Travel • ICAO data shows a sharp 38% decline in world total air capacity
in March, with massive double-digit decreases across regions.
The latest estimates for the full-year 2020 compared to baseline
would be a reduction of 39% to 56% of seats offered by airlines if
the recovery is in late May, o 49% to 72% if the restart is in Q3 or
later. International passengers would decline 44% to 80% in 2020.
• IATA points to a decline of 22% in international passenger
demand (RPKs) in January-March, with a 56% drop in March. IATA
forecast total air passenger market to end 2020 at -48% in RPKs.
• ForwardKeys data shows a massive 80% decline in air bookings
worldwide in Q1. Asia and the Pacific (-98%) suffered the biggest
drop and started to decline earlier, with the introduction of
travel restrictions in China. Air bookings from Europe (-76%), the
Americas (-67%), Africa and the Middle East (-65%) all had severe
declines in the first quarter of 2020.Hospitality • According to STR, the impact of COVID-19 on the global hotel
industry in January 2020, measured in change in revenue per
available room (RevPAR), was apparent in Asia (-9.6%), but not in
other world regions.
• By March, the hotel industry in all world regions recorded large
double-digit declines in global RevPAR, with Asia (-67.8%) and
Europe (-61.7%) posting the biggest decreases.
• Global occupancies declined significantly in March with double-
digit decreases in countries around the world, ranging from 20%
to more than 70%.The impact of COVID-19 on Tourism in Q1
67 million fewer international tourist arrivals
80 US$ billion lost in exports
100% destinations with travel restrictionsLooking Ahead
Domestic demand expected to recover faster than
                                international demand
               International demand would recover by Q4 and mainly in 2021 according
                           to the UNWTO Panel of Experts survey responses

            When do you expect tourism demand for your destination                                                     3- When do you expect international demand for your
                            will start to recover?                                                                              destination will start to recover?
50%                              45%                                                                      100%
                                                                        39%                                90%
40%                                                                                                        80%
                                                34%
                                                                                                           70%
30%                        24%                         25%                                                 60%
                                                                                                           50%
20%         14%                                                                 15%                        40%
                                                                                                           30%
10%                                                                                                        20%
       3%
                                                                                                           10%
0%                                                                                                          0%
      By May-June       By July-September   By October-December           By 2021                                     Africa     Americas     Asia and the    Europe       Middle East
                                                                                                                                                 Pacific
                            International   Domestic                                                              By May-June   By July-September    By October-December     By 2021

                                                                     Source: World Tourism Organization (UNWTO)
Scenario • The three scenarios of international tourism in 2020 presented
are not forecasts and should not be interpreted as such.
Assumptions • They reflect three possible patterns of monthly change in arrivals
from April to December 2020 supposing that travel restrictions
start to be lifted and national borders opened in early July
(Scenario 1), in early September (Scenario 2) or in early December
(Scenario 3). They are based on available tourism data for
January-March and other information such as the shutdown of all
national borders as of late April, though still in a context of high
uncertainty.
• The three scenarios reflect three very gradual paces of
normalization in which monthly declines in arrivals start to recede
in those respective months and there is no significant or long-
lasting worsening of the pandemic that affects travel conditions
thereafter. All three scenarios consider declines in arrivals
through December 2020, albeit to different extents.Scenario • The scenarios are based on models that consider different
patterns of recovery for the different world regions, where Asia
Assumptions and the Pacific sees a change in trend earlier, as the pandemic hit
Asia before other regions and seasonality in Asia is less significant
than in other regions where the bulk of demand takes place in
June-September.
• The models do not specifically incorporate economic factors on
the patterns of monthly change, though the economic recession
resulting from the pandemic is expected to have a major impact
on international tourism in the near to middle term affecting
consumers’ spending propensity.
• The data and assumptions of these scenarios will be adjusted as
the situation evolves and more information becomes available.Progressive decline in arrivals in Q1 2020, with 57% drop in March
International tourist arrivals (YoY monthly change, %)
2019 2020
+10 +7 +6
+4 +4 +2 +2 +3 +3 +4 +3 +3 +2 +2
Jan Feb March April May June July Aug Sept Oct Nov Dec Jan Feb March April
-10
-9
(monthly change, %)
-30
-50
-57
-70
-90 Note: Data for January-March 2020 includes estimates for countries which have not yet reported data.
Source: UNWTOForward-looking scenarios depend on re-opening of borders
International tourist arrivals in 2020: three scenarios (YoY monthly change, %)
+2
0
Jan Feb March April May June July Aug Sept Oct Nov Dec
-9
Actual data*
-20 Scenario 1: -58%
Scenario 2: -70%
(monthly change, %)
Scenario 3: -78%
-40
Gradual opening of borders
-57 and lifting of travel restrictions
-60 * Actual data through March
in July in September includes estimates for countries
which have not yet reported data.
in December
Source: UNWTO
-80
Note: the scenarios presented in this graph are not forecasts.
They represent alternative monthly change in arrivals based
on the gradual opening of national borders and lifting of
travel restrictions on different dates, still subject to high
uncertainty.
-100Arrivals could drop 58% to 78% depending on pace of normalization
International tourist arrivals, 2000-2019 and scenarios for 2020 (% change)
15
10
9.4
6.4 7.0 5.7 6.6 6.6 7.2 5.7
3.0 4.8 4.7 5.1 4.2 4.8 3.8 3.8
5 1.9
0.1 -0.4 -4.0
0
2000 2001 2002 2003 2004 2005 2006 2007 2008 2009 2010 2011 2012 2013 2014 2015 2016 2017 2018 2019 2020
-5
(e) (sc)
-10
-15
2003
-20 SARS 2009
-25 2001 epidemic Global economic
Sept 11th crisis
(% change)
-30 attacks
-35
-40
-45 2020 Scenarios
COVID-19
-50
Scenario 1: -58%
-55
Scenario 2: -70% -58
-60 Scenario 3: -78%
-65
The above are not forecasts. They are scenarios
-70 based on the possible opening of national -70
-75 borders and lifting of travel restrictions in July,
Sept. and Dec. 2020 respectively. -78
-80
Source: UNWTO (e) Estimate (sc) Scenario-based data
Source: World Tourism Organization (UNWTO) (e) Estimate (sc) Scenario-based dataCrisis could severely impact summer season (northern hemisphere)
International tourist arrivals by months, 2020: three scenarios (millions)
Scenario 1 Scenario 2 Scenario 3
180 Scenario 1 arrivals 180 Scenario 3 arrivals
Scenario 2 arrivals 180
Loss versus 2019 Loss versus 2019
Loss versus 2019
150 150 150
International arrivals (thousands)
International arrivals (thousands)
International arrivals (thousands)
120 120 120
+2% +2% +2%
90 -9% 90 -9% 90 -9%
-57% -57% -57%
60 60 60
30 30 30
Jan. Feb. Mar. Apr. May Jun. Jul. Aug. Sep. Oct. Nov. Dec. Jan. Feb. Mar. Apr. May Jun. Jul. Aug. Sep. Oct. Nov. Dec. Jan. Feb. Mar. Apr. May Jun. Jul. Aug. Sep. Oct. Nov. Dec.
Note: the data for 2020 presented in these graphs are not forecasts. They represent three scenarios based on the gradual opening of national borders and lifting of travel restrictions in July,
September and December 2020 respectively, in a context of still high uncertainty.
Source: World Tourism Organization (UNWTO)Largest blow to tourism ever could slash 1 billion arrivals
International tourist arrivals, 2000-2019 and scenarios for 2020 (millions)
1600
1,462
1,408
1400 1,333
1,243
1,197
1200 1,143
1,097
1,044
997
1000 930 952
913 893
856
810
(millions)
757
800
674 675 695 692 2020 Scenarios
2009 COVID-19
Global economic crisis
600 Scenario 1: -850 million (-58%) 610
-37 million
Scenario 2: -1020 million (-70%)
2003 -4.0% Scenario 3: -1140 million (-78%)
SARS 440
400
-3 million The above are not forecasts. They are scenarios 320
-0.4% based on the possible opening of national
200 borders and lifting of travel restrictions in July,
Sept. and Dec. 2020 respectively.
0
2000 2001 2002 2003 2004 2005 2006 2007 2008 2009 2010 2011 2012 2013 2014 2015 2016 2017 2018 2019 2020
(e) (sc)
Source: UNWTO (e) Estimate (sc) Scenario-based
Source: World Tourism Organization (UNWTO) (e) Estimate (sc) Scenario-based dataInternational tourism receipts could plunge by US$ 1 trillion
International tourism receipts, 2000-2019 and scenarios for 2020 (U$ billion)
1600
1,454 1,480
1400 1,347
1,281
1,219 1,222 1,250
1200 1,132
1,096
988 979
1000
892 901
(US$ billions)
773
800 2020 Scenarios
707
657 COVID-19
2009
554 Global economic crisis Scenario 1: -US$ 910 bill. -62%
600 506 Scenario 2: -US$ 1080 bill. -73%
496 485 -88 US$ billion 570
Scenario 3: -US$ 1170 bill. -79%
-5.4% (real terms) (nominal)
400 410
2003
The above are not forecasts but scenarios
SARS based on the possible opening of national 310
+50 US$ billion borders and lifting of travel restrictions in July,
200 Sept. and Dec. 2020 respectively.
-1.4% (real terms)
0
2000 2001 2002 2003 2004 2005 2006 2007 2008 2009 2010 2011 2012 2013 2014 2015 2016 2017 2018 2019 2020
(e) (sc)
Source: UNWTO (e) Estimate (sc) Scenario-based
Source: World Tourism Organization (UNWTO) (e) Estimate (sc) Scenario-based dataSummary of Potential Impacts in 2020
850 million to 1.1 billion fewer international tourist arrivals
US$ 910 billion to US$ 1.2 trillion loss in
export revenues from tourism
100 to 120 million direct tourism jobs at riskEmployment in accommodation and food services is at
high risk, more than half workers are women
Workers in sector most at risk
600 0,6
500 54% 482 0,5
463 mn
400 44% 0,4
38% 39%
300 0,3
200 0,2
157 mn 14% 15%
144 mn
100 0,1
4% 5%
0 0
Accommodation and food Real estate; business and Manufacturing Wholesale and retail trade;
services administrative activities repair of motor vehicles and
motorcycles
Levels of employment (mn) Share in global employment (%) Share of women (%)
Source: International Labour OrganizationEurope was the slowest to return to growth after a crisis
(14 months after econ. crisis)
Monthly change in international tourist arrivals (%)
Americas after Sept. Europe during
11th global econ. crisis
20 Asia during SARS month 12 month 14
month 7:
first month of growth
+12
10
+5
+2
(Months after start of crisis)
0
-1 0 1 2 3 4 5 6 7 8 9 10 11 12 13 14
(% change)
-10
-20 Impact of three previous crises on
most affected regions:
-30
Asia during SARS Americas after Sept. 11th attacks
(2001), Asia during SARS (2003)
Europe during Global econ. crisis
and Europe during the global
-40
Americas after Sept. 11th attacks economic crisis (2009)
Note: Month 0 for Sept 11th crisis = Sept. 2001; for SARS = March 2003; for Global economic crisis = Jan 2009.
-50 Source: UNWTOThe recovery of lost arrivals was the fastest after SARS
(11 months)
Impact of three previous crises on world arrivals
World - Cumulative change in international arrivals (million), by months
Sept 11th attacks
30 14 months for recovery
SARS Global econ. crisis
20 11 months for recovery 19 months for recovery
10
Cumulative change (millions)
(Months after start of crisis)
0
-1 0 1 2 3 4 5 6 7 8 9 10 11 12 13 14 15 16 17 18 19 20 21 22 23 24
-10
-20
-30
SARS
Sept. 11th attacks
-40
Global econ. crisis
-50
Month 0 for Sept 11th crisis = Sept. 2001; for SARS = March 2003; for Global economic crisis = Jan 2009.
Source: UNWTOThe Americas was the slowest to recover its lost arrivals after a crisis
(42 months after the Sept. 11th attacks)
Impact of three previous crises on most affected regions:
30 Cumulative change in international arrivals (million), by months
Europe during Global econ. crisis
29 months for recovery
20 Asia during SARS
Americas
14 months for recovery
after Sept 11th attacks
42 months for recovery
10
Cumulative change (millions)
(Months after start of crisis)
0
-1 0 1 2 3 4 5 6 7 8 9 10 11 12 13 14 15 16 17 18 19 20 21 22 23 24 25 26 27 28 29 30 31 32 33 34 35 36 37 38 39 40 41 42 43 44 45 46 47 48
-10
-20
Asia Pacific (SARS)
-30
Americas (Sept 11th attacks)
Europe (Global econ. crisis)
-40 Month 0 for Sept 11th crisis = Sept. 2001; for SARS = March 2003; for Global economic crisis = Jan 2009.
Source: UNWTOSummary of Crisis
Year:
Sept 11th attacks
2001
SARS
2003
Global econ. Crisis
2009
previous crises World arrivals
(% change)
+0.1% -0.4% -4.0%
month 0 (zero) Sept. 2001 March 2003 Jan. 2009
N. of months for return to 5 5 10
grownth
N. of months for return to 14 11 19
previous volumes
World receipts -2.0% -1.7% -5.4%
(real change, %)
Most impacted region 1 Americas Asia Pacific Europe
Region’s arrivals -5.9% -9.4% -5.3%
(% change)
N. of months for return to 12 7 14
grownth
N. of months for return to 42 14 29
previous volumes
Region’s receipts -11.1% -8.1% -6.7%
(real change, %)
Note: Arrivals refers to international tourist arrivals. Receipts are international tourism receipts (visitor expenditure in destinations).
¹ Most impacted region in terms of international tourist arrivals that year. In 2009, Europe was the most impacted region in terms of
arrivals, but Americas suffered the largest drop in receipts: -8% (real terms).
Source: UNWTOMost • Tourism is a key economic sector and an important source of
export revenues in many advanced and emerging economies.
Vulnerable • Destinations which have a high share of tourism as a source of
Destinations export revenues, economic income, job creation and investments,
are particularly vulnerable to the impact of the COVID-19
pandemic.
• This is the case of many Small Island Developing States (SIDS),
where the share of exports from international tourism in total
exports of goods and services can be as high as 90%.
• Most affected countries by COVID-19 account for 54% of all
tourism spending (as of 2 May). This potential loss of this income
represents a considerable challenge in many destinations relying
on it.Small Island Developing States are highly vulnerable
Share of international tourism revenues as of total exports (%)
Source: UNWTOTourism is a key sector in many advanced and emerging economies
Share of Tourism GDP in total GDP (%)
Macao (China)
Jordan
Jordan
Spain
Croatia
Croatia
Mauritius
Jamaica
Jamaica
Mexico
Philippines
Philippines
Iceland
Uruguay
Uruguay
Portugal
France
France
Thailand
Sweden
Sweden
Morocco
Greece
Greece
Hungary
Malaysia
Malaysia
Austria
Côte d'Ivoire
Côte d’Ivoire
Honduras
NewNew
Zealand
Zealand
Bermuda
Estonia
Estonia
Slovenia
Costa
CostaRica
Rica
Mozambique
HongHong
Kong (China)
Kong (China)
0 10 20 30 40 50 60
Note: When Tourism GDP is not available, Tourism Gross Value Added (TGVA) or Tourism internal consumption is used Note: Countries with available Tourism Gross Domestic Product data
for 2015-2018 (Tourism GDP equal or above 5% of total GDP). When Tourism GDP is not available, Tourism Gross Value Added (TGVA) or Tourism internal consumption is used.
Source: Compiled by UNWTODestinations with high share of domestic tourism are less exposed
Guests in hotels and similar establishments (THS), Domestic and inbound tourism (% of total guests)
Netherlands
Centr. African Rep.
Netherlands
Hungary
Ecuador
Hungary
Slovakia
Italy
Slovakia
Denmark
Korea (ROK)
Denmark
Israel
Zimbabwe
Zimbabwe
Malaysia
Mali
Mali
Thailand
United Kingdom
United Kingdom
France
Saudi Arabia
Saudi Arabia
Bolivia
Norway
Norway
Burkina Faso
Mexico
Mexico
Cameroon
Poland
Poland
Germany
Sweden
Sweden
Romania
Argentina
Argentina
Russian Federation
Ukraine
Ukraine
Japan
Peru
Peru
Indonesia
Australia
Australia
0 10 20 30 40 50 60 70 80 90 100
Domestic tourism - Guests in hotels and similar establishments Inbound tourism - Guests in hotels and similar establishments
Source: Compiled by UNWTO
Note: Includes only countries with available data for 2018 or earlier and with share of domestic guests in total higher than 50%Most affected countries account for 54% of all spending
(over 50,000 cases), as of 2 May 2020
As of 2 May 2020, a total of 215 countries, areas or territories have reported cases of COVID-19
Countries with more than 50K Share of World Tourism Share of Share of World Share of World
COVID-19 reported cases Tourism Arrivals (%) Exports in the country (%) Tourism Receipts (%) Tourism Expenditure (%)
United States 5% 10% 15% 10%
Spain 6% 16% 5% 2%
Italy 4% 8% 3% 2%
United Kingdom 3% 6% 4% 5%
Germany 3% 3% 3% 7%
France 6% 8% 4% 3%
Russian Federation 2% 8% 1% 2%
Turkey 3% 17% 2% 0%
Iran 1% 5% 0% 1%
Brazil 0% 2% 0% 1%
China 4% 1% 3% 19%
Canada 2% 5% 2% 2%
Total 39% 42% 54%
Source: World Tourism Organization (UNWTO)
Note: Countries with more than 50K COVID-19 reported cases to 2 May 2020, according to the World Health Organization (WHO)Most affected countries by COVID-19 have a
high share of domestic tourism
Domestic and inbound tourism by country (millions)
China
United States
Russian Federation
France
Spain
Germany
United Kingdom
Canada
Turkey
Italy
0 1000 2000 3000 4000 5000 6000
Domestic overnight trips International tourist arrivals
Source: Compiled by UNWTO
Note: Countries with available data for both indicators (2018 or earlier). Total domestic overnights in accommodation used for the Russian Federation.Key • Pandemic
How long will the pandemic last and when will a treatment or vaccine become
Considerations available?
• Lifting of travel restrictions and lockdown measures
When will countries start easing restrictions and how?
How will social distancing rules impact supply?
• Consumer & Business confidence
How long it will take consumers to reassume travel?
How will travel behavior change?
• Economic impact
How deep and how long will the global recession be?
What will be consumers’ discretionary spending decisions?
• Governments Measures
How do government measures support tourism?The global economy is expected to contract sharply by
3.0% in 2020 to pick up again in 2021
2021
2021 6.6%
5.8%
2021
4.5% 2019
2019 3.7%
2.9%
2019
1.7%
2020
-1.0%
2020
-3.0%
2020
-6.1%
W ORLD AD VA N C E D E C O NO M I E S E M E R G I N G AND
D E VE L O P I N G E C O NO M I E S
Source: International Monetary Fund (IMF)World merchandise trade is set to plummet by between 13
and 32% in 2020 due to the COVID-19 pandemic
Source: World Trade OrganizationEconomic • The global economy is projected to contract sharply by 3.0% in a
baseline scenario (pandemic fades in the second half of 2020 and
Factors containment efforts can be gradually unwound) to pick up in 2021
by 5.8% as economic activity normalizes.
• GDP in advanced economies is expected to decrease 6.1% in 2020
to pick up in 2021 by 4.5%. Emerging and developing economies
will decline -1.0% in 2020 to pick up by 6.6% in 2021.
• Collapse in commodity prices: From mid-January to end-March,
crude oil prices dropped by about 65 percent (a fall of about
US$40 a barrel).
• World merchandise trade is set to plummet by between 13% and
32% in 2020 due to COVID-19.Challenges & Opportunities
STRENGHTS WEAKNESSES
• Proven resilience of tourism in past crises • Segments potentially affected are also high spenders: international, long
• Domestic tourism can be a buffer haul, business travel and events INTERNAL
• Adaptation capacity: safety and hygiene protocols, trips closer to home, • Major disruption in airline industry with airline failures and concentration
value for money, responsible consumer behavior • Lack of references in previous downturns
FACTORS
• Government support to the sector • Perception of travel as a risk
• Low levels of demand when restarting tourism due to social distancing
OPPORTUNITIES THREATS
• Re-think business model • Economic environment: world recession, rising unemployment and jobs
• Innovation and digitalization at risk, closure of business mainly SMEs, disposable income, uncertainty
• Sustainability and sustainable-oriented segments (rural, nature, health) weighing on consumer and business confidence EXTERNAL
• De-escalation phases initiated by several countries toward the ‘new • Uncertain length of pandemic (including resurgence) and vaccine
normal‘ unavailability FACTORS
• Progress in adaptation plans in destinations & companies • Extent of lockdowns and travel restrictions
• Unknown form of the ‘new normal
POSITIVE NEGATIVEUNWTO World Tourism Barometer May 2020 Special focus on the Impact of COVID-19
You can also read