Consumer Internet in India - An overview of key sectors of digital economy - RedSeer
←
→
Page content transcription
If your browser does not render page correctly, please read the page content below
Flexible in Approach, Firm on Results

                                                  Consumer Internet in India
                                                      An overview of key sectors of digital economy
4/17/2018

New Delhi | Bangalore| Mumbai | New York | Dubai

© 2017 RedSeer Consulting Confidential and Proprietary Information   www.redseerconsulting.com   query@redseerconsulting.com   |
India has one of the largest and fastest growing internet populations in the
world
Online Population in Major Economies
Number of users, in million X% CAGR (2017-2020) 2017P 2020P
Online Population (mn)
Key Insights
2017-2020
India’s internet user growth
910 6% will be roughly four times
the global rate of 3% over
740 2016-2020
Drivers of growth-
720
13% o Telecom initiatives like
Reliance Jio- the fastest
~500 growing internet
network in the world -
are likely to further help
in connecting the
310
2% masses to the internet
290 o Rapidly growing access
to smartphones
| 2A majority of the Indian internet population is already using some services
online
X # of users (million)
Internet Usage Evolution Funnel- India
Numbers of users, in million X% % of online population
Stage 0
Access to internet (intermittent)
Stage 1
WhatsApp, Facebook and ~50%
other social media
Online maturity
Stage 2
Google, Wikipedia, E-mail etc. ~40%
Stage 3
Banking and basic paid ~30-35%
services like recharge
Stage 41
Monthly Active Consumer
10%
internet product buyers
Note: 1. Covers entirety of consumer internet industry, including online retail shopping, online travel, cab aggregators,
food-tech, ed-tech, fin-tech among others. E-tailing industry’s monthly consumer base is ~20 million
Source: RedSeer analysis
| 3eCommerce/consumer internet using population is growing rapidly- yet
market is still highly underpenetrated
Growing internet and smartphone …but India is still considerably underpenetrated
penetration has driven a steady growth in compared to other countries
ecommerce users…
Monthly Ecommerce As % of Internet As % of Smartphone
India Monthly Ecommerce Users-Mn Users-Mn (2017) Users (2017) Users (2017)
China 160 22% 28%
201
120
India 50 ~10% ~16%
46 50
35
26 United
States 140 48% 67%
2014 2015 2016 2017F 2020F
Note:
1. E-tailing monthly shoppers in India (20 Mn) are comparable with 160 Mn shoppers of China and 140 Mn shoppers for USA. Direct comparison of 50 Mn
with China and USA is unavailable.
2. Numbers are broad estimates and are only indicative.
Source: Secondary research, RedSeer analysis
| 4The consumer internet market is pegged at USD 53 billion in 2017 and
expected to grow to USD 100+ Bn by 2020
Consumer Internet Market-India
Market size, in USD billion X Market size in USD bn
India Consumer Internet Market
2014-2020F
107B
53B
35B
21B
2014 2015 2017F 2020F
Source: RedSeer analysis
| 5Key sectors within consumer internet are expected to continue on a steady
growth trajectory
Consumer Internet Market Split-India
Market sizes, in USD bn/ mn as mentioned X Market size in USD bn
India Consumer Internet Market1 (2017)
Key Insights
Split by sector
Online mobility is expected
~53B to grow to encompass a
much larger than the
Others2 current 1-2% share of all
Ticketing public transport rides by
8.5B
13.5B Home 2020
1.9B
services
Taxi E-tailing is expected to
70M
2.1B grow on the back of rapid
Fashion 3.5B
230M 112M
e-pharmacy addition of online
e-tailing shoppers, with online
14.5B penetration increasing to
700M Food 7-8% by 2020
0.7B delivery
Bus
Hotels
4.1B Growing internet
OTA penetration coupled with
5.5B 960M
Air increase in average
6.7B Groceries disposable income will
Rail
lead to higher travel
2017E 2017E spending and a steady
Note: 1. m-wallets, which has a gross transaction value of ~13B USD has been excluded
2. Others include Fin-tech and alternative lending among others growth for the sector
Source: RedSeer analysis
| 6Online penetration is fairly low across online industry verticals in India
Online Penetration1 across sectors Proven value Emerging
Large potential Organic
1%
Hyperlocal Services, Online Groceries, ~950M E-tailing (excludingFuture looks promising for emerging verticals like hyperlocal services and
ed-tech as they have a high satisfaction among customers
Consumer NPS across Indian online industry verticals
45% Industry
40% average1: 24%
35%
30%
25%
20%
15%
10%
5%
0%
-5%
-10%
Hyperlocal Online EdTech m-wallets OTA Online e-tailing Online Online Online Online Online
Services Fashion (Hotels) Cabs Food Ticketing Groceries Matrimonials Real
Delivery Services Estate
Classifieds
Note: 1. Calculated as weighted average for mentioned verticals Market sizes taken as weights.
Source: RedSeer analysis
| 8E-tailing
Source: RedSeer analysis
| 9GMV Performance
Industry growth momentum resumed in 2017 as it witnessed 23% Y-o-Y
growth reaching ~18 Bn
Note: 1 $ = INR 60
Indian E-Tailing Market- Gross GMV
(For Each Year, In USD Bn )
28
17.8
14.5
13
4.5
2014 2015 2016 2017 2018F
Breakout year for Breakneck growth GMV growth slows Industry growth Industry expected
sector continues but GMV ‘quality’ momentum to grow faster
and unit economics continues compared to
Flipkart crosses Flipkart crosses
improve previous years
USD 1 bn GMV USD 4 bn GMV Largest ever
run-rate while One of the biggest monthly GMV for Bigger horizontals
Amazon,
Snapdeal and player Snapdeal sector in Sepy’17 are expected to
Snapdeal grow
Amazon touch losses market (sales) month drive growth
rapidly
USD 3 bn share
Source: RedSeer analysis | 10Category Performance
Mobiles continues to be the highest selling category; Share of fashion
category has been consistently decreasing
Indian E-Tailing Market- Category Share of Gross GMV
(Y-o-Y )
4% Others
6% 6%
6% 4% 6%
5% 5% 5%
FMCG
21% 17%
23%
Home
18%
20%
22%
Fashion
50% Electronic Devices/Non-
44%
38% Devices
Mobile
2015 2016 2017
Key takeaways
• Market share for mobile category has continuously seen an increase, half of the E-tailing business is being driven by
the category as of 2017
• Among smaller categories- share of Home and FMCG category increased in 2017
Source: RedSeer analysis | 11City-Tier wise customer growth
Tier-II+ would be the mainstay of growth in 2018 with a total of 50 Mn+
online shoppers from these smaller cities
Yearly Unique shoppers Y-o-Y Growth rates Key takeaways
(Y-o-Y trends, MN) (%)
Metro Tier-I Tier-II+
Metro:
Total • Slower growth in compared
yearly 75 90 120 to Tier-I and Tier-II+
shoppers
• Added 3 Mn shoppers in
2017, expected to add 5
50% Mn more in 2018
Tier-I :
56 • Second fastest growing
market
37 • Added 3 Mn shoppers in
30% 2017, expected to add 6
27
23 Mn more in 2018
17 Tier-II+ :
14
• Fastest growing market
41 • Industry added 10 Mn
33 36 15% shoppers in 2017,
expected to add 19 Mn
more in 2018
2016 2017 2018F
Source: RedSeer analysis | 12Category wise growth rate
Industry growth in 2017 was driven largely by Mobiles; FMCG was the
fastest growing category
GMV Share of GMV growth, % Future prospects
Category, % (Y-o-Y growth, CY 2016-17)
Growth is driven by bigger players like Amazon. With
Amazon’s aggressive push on Pantry and new investments
6% FMCG 66% in this category by other player is expected to maintain high
growth
Growth is driven by Flipkart and Amazon. New internet
users, reducing replacement cycles and supply side push
50% Mobiles 51% through more and more exclusives are most likely to drive
further high pace growth in 2018
Growth is driven by Flipkart and Amazon. Increasing
adoption of high value categories like Large Appliances,
17% Other Electronics 45% Camera etc. combined with enhanced affordability due to
No-cost EMI schemes etc. would drive further growth
Growth is driven mainly by Amazon, Flipkart and vertical
player. Large selection, increased reach, customer made
5% Home 21% products etc. are likely to further drive growth of the category
in 2018
Growth driven by Flipkart group, Amazon and Shopclues.
17% Smaller verticals are struggling to grow. Growth potential is
Fashion 18% huge in 2018 with fashion as one of the preferred category
for new shoppers.
Source: RedSeer analysis | 13Other highlights
Other highlights from e-tailing industry
The burn has remained stable, despite the growth moving up –
varying from 18-24%
Prime numbers have been increasing at 75% YoY, but the stickiness
of customers is real question
Inventory led model is the key driver, Marketplace is lagging
Fashion as industy has struggled to accelerate, trust on online
shopping – in smaller town is the key challenge
Source: RedSeer analysis
| 14Cab-hailing industry
Source: RedSeer analysis
| 15The overall transportation market in India is currently ruled by public
transportation
Indian Transportation Market
Key Insights, 2017
Distribution of Daily Commuter Trips A Average Fare
(For 5 Kms, INR)
130-150
Mn
OthersB ~11% Others ~10
Taxi (P2P) ~4-%
Autos
(Private & ~30%
Taxi ~80
shared)
Auto ~50/10
Public ~55% (Private/ Shared)
Buses
Bus ~20
Note: A. Rail based & private car based local trips have not been included
B Others include metro and other type of vehicles used for commuter trips like tempos etc
Source: RedSeer Analysis; Primary & Desk Research | 16Pan-India taxi market is estimated at ~ US$ 15 Bn as of 2017
Indian taxi market
Figures in US$
Taxi Market
$ 15 Bn
$ 2 Bn Online $ 13.4 Bn Offline
Corporate/ Outstation
Hotels Schools Kali Peeli
ETS & Events
$ 3.5 Bn $ 1 Bn $ 1.5 Bn $ 7 Bn $ 0.4 Bn
Government/
Service Outstation Events
Manufacturing
$ 0.7 Bn $ 2.8 Bn $ 6 Bn $ 1 Bn
Notes: 1. The events sector is included under Outstation
2. All figures have an error margin of 10%
Source: RedSeer Analysis; Primary & Desk Research | 17The number of online rides is set to grow at a CAGR of 40% over the next 3
years No. of daily P2P online rides, Mn
Current & Future Trends-India Growth rate more than 50%
# of rides in Mn Growth rate less than 50%
Growth in Online Taxi Market Growth in no. of online rides, Monthly
(Daily P2P rides for pan-India, in Mn)A (2016-17)
# of rides Growth Rate
City
(Mn)
1 Delhi 11
CAGR:
~40% 2 Bangalore 11
5.2
3 Mumbai 8
CAGR:
~60% 4 Hyderabad 6
1.9
1.2
5 Chennai 6
2016 2017 2020F
.Note: A. Data only for cab based rides. Auto rides have not been included
Source: RedSeer Analysis | 18The shared cab category is bringing disruption in the industry and is
growing faster than pure cab rides … x% # of share rides as %
of total online rides
Share vs. Pure Cab
# of Rides Pure Share
Ride Growth
Number of rides across Share & Pure cabs A
Rate
(Q2’16 –Q3’17)
CQGR: ~7%
25%
22%
16% 18%
13%
9% CQGR: ~30%
Q2'16 Q3'16 Q4'16 Q1'17 Q2'17 Q3'17
.Note: A. Data only for cab based rides. Auto rides have not been included
Source: RedSeer Analysis | 19Other highlights
Other highlights from e-tailing industry
Supply side constraint is the major challenge
Unit economics have improved due to the driver incentive reduction,
but the competitive fare is still a challenge
Customers have higher willingness to pay, but there is “who blinks
first” situation between Uber and Ola – as market share is extremely
sensitive to price
Going forward Pool and Auto will be the key driver for the growth
Source: RedSeer analysis
| 20Food tech Industry
| 21Online food-tech industry is one of the fastest growing industries
Online Food Tech industry (Delivery) market Size, USD Millions
2015-2021
Online Food Delivery Market Size
(USD Million)
3500
2500-3500
3000
CAGR ~ 60%
2500
2000
1500
1500 CAGR ~ 120%
1000 750
500 300
120
0
2015 2016 2017 2018F 2021F
At an exit run rate of 320,000 order per day with an AOV of USD 6
Source: RedSeer Analysis | 223PL lead delivery has 3X more order cancellation , slower delivery and much
lower delivery compliance
Delivery performance CY Q3 2017
Owned delivery offers much better experience on all key KPIs – hence a key value proposition
Orders Fulfilled (as % of total orders) Average Delivery Time (in minutes) Delivery Compliance (% of total orders)
85%
96% 37
77%
88% 48
90%
93% 44
Source: RedSeer research | 23The industry has gone through significant transformation in last couple of
years
Key trends in Food Tech delivery
2014-2017
1. Last 2-3 years have seen one round of cleansing in the industry, leading to
survival of players with clear value proposition
2. Increasingly customers and restaurateurs see significant value proposition
attached with the industry, leading to both of them paying for using the platform
3. For the restaurants listed on the platforms , ~25% of their business comes from
the online platforms – leading to an important contribution in their P&L
4. Owned delivery is the clear differentiator for the online delivery, which leads to
better delivery experience. Both for customers and restaurants – hence better
stickiness
5. With ~20% commission from restaurants, 5-10% delivery charges from
customers and 15% cost as delivery the potential unit economics on operating
level is one of the best in industry
6. With Uber and OLA getting in market - a new round of price war should kick in
Source: RedSeer Analysis | 24Hotel-Tech Industry
Source: RedSeer analysis
| 25Hotel Tech Industry is one of the fastest growing online industries
Number of Room Nights booked online in India per day
(in 000s)
350
300 250-300
280
250
CAGR: ~40%
200
150
110
100
50
0
2017 2020
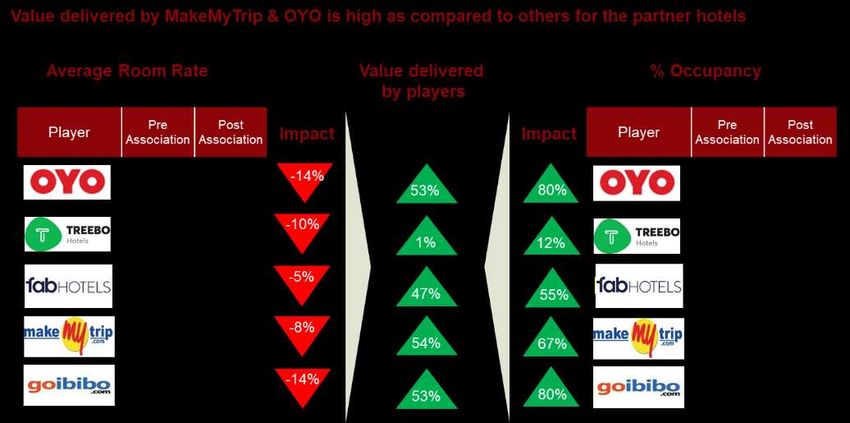
Source: RedSeer Analysis | 26The Hotel Aggregator industry has seen a shift from partial inventory to full
inventory model
The year 2017 saw the Hotel Aggregators move towards full inventory model focussing less on the partial
inventory model to provide better overall consumer experience. Players like Treebo and Fab have focussed
from start on the full inventory business now Oyo which operates on a much larger in scale is transforming its
partial inventory hotels to full inventory to control the overall experience.
Partial VS Full Inventory model split of Hotel
Aggregators
34% 37%
43%
70%
66% 63%
57% 85%
90%
30%
Q1CY-17 Q2CY-17 Q3CY-17 Q4CY-17
Partial Inventory Full Inventory
Source: RedSeer analysis |Value creation by hotel platforms – directional Source: RedSeer analysis |
Key highlights from the industry

OTA (Hotels)

   1. There is a very high level of fragmentation (80%+) in the Indian hotel industry
      market – which is very well suited for the OTA industry

   2. Market is moving towards the full inventory model – from the part inventory
      model – which is driven by the better control and customer experience

   3. Value added by platform to the hotel is the key stickiness criteria for the supply
      side – something which Oyo and Fab are able to do much better

   4. ARRs for the hotel rooms are ~ USD 30 are not expected to move much in
      coming times

   5. The Industry is still burning 20+% of GBV – due to discounting and cancellations

   6. Likes of MMT are facing two pronged challenges, one from Oyo’s of the world at
      the value side and other from Booking.com at the premium side

Source: RedSeer analysis
                                                                                           | 29
3PL
Source: RedSeer analysis
| 30The e-logistics industry has seen a growth of nearly 21% in 2017
Logistics Trends-India
Insights
Shipments volumes from e-tailing industry* (2015-2017)
# of shipments in Mns
535
442
Captive
391 32%
30% Traditional 3PLs
11%
39%
18% New Age 3PLs
26%
57%
52%
35%
2015 2016 2017
*Includes all of e-tailing {large+long tail}, Hyperlocal delivery
*Excludes the non-e-tailing volume delivered by 3PL
*Includes the reverse logistics
Source: RedSeer analysis | 31New Age 3PLs are a lot more competitive on rate cards and have better
unit economics
Rate Cards & Unit Economics Traditional 3PLs New Age 3PLs
Insights
Average Rate Cards (in ₹) Cost per shipment (in ₹)
200
140
80
20
Rate Card FY'17
Source: RedSeer analysis | 32Key highlights from the 3PL industry
3PL Industry
1. Daily forward shipments for the industry is 1.6 to 1.7 Million on a BAU basis, with
captives accounting for ~55% of the market share
2. Reverse shipment volumes are 20-25% of the the forward, captives have leading
share in this piece as well
3. 3PLs have not seen significant growth in the market, due to increase load
sharing by the captives – Delhivery being the market leader with ~36% share
4. Cost per shipment for the New age 3PLs is ~30% lower then the traditional
3PLs, the benefit is passed on to the customer – leading to similar burn
5. 3PLs have 30-40% higher pin-code coverage then the best of the captive
coverage
Source: RedSeer analysis
| 33OTT, UPI, Internet Ticketing and Med-tech
| 34India presents a huge potential opportunity in OTT video with increasing
internet access and capacity to pay
Drivers of OTT Video in India
Increasing Disposable Income Increasing Internet Access
Per capita annual income Internet Penetration & Mobile Data Consumption
By Income Class in INR
2,000 Mobile Data Consumption (PB per month) 50%
6.5X
₹1,048,579 Internet Population (%)
2015 2020 1,800
43% 45%
1,600
1,400
₹747,120 40%
1,200 3X
34%
1,000 35%
1,869
31%
800
30%
₹265,372 600
₹178,624 400
₹54,724 25%
₹42,680 200
279
0 94 20%
Upper Middle Lower Middle Rural 2014 2016 2020
Growth in the Urban Middle Class is unlikely to be very rapid as the India has leapfrogged broadband internet to mobile internet, with
number of government jobs keeps shrinking; however, Make in India (and incumbents like Jio driving the world’s lowest cost market even lower
other similar campaigns) will drive income growth in Lower Middle Class
through blue collar and grey collar jobs
Source: Desk research (1, 2), RedSeer analysis © 2016 RedSeer Consulting Confidential and Proprietary | 35Tez has been quick in disrupting the market of UPI - leaving wallet lagging
Monthly transactions and Total Payment Volume (TPV) Monthly
Xm
2017 txns (mn)
# of monthly txns Total Monthly Payment Volume
(Million; Sep-Dec 2017) (USD Million; Dec 2017)
93
Tez 1080 93m
73
53
Paytm 600 140m
13 250 33m
Phonepe
Sep ‘17 Oct ‘17 Nov ‘17 Dec ‘17
Source: RedSeer Analysis | 36PayTM has disrupted the long standing leadership of BMS in ticketing
market
Market Share- Ticketing in India
Mar 2016- Mar 2018 (F)
Q1 2017
GBV is 330
mn USD
70% BMS
76%
99%
Paytm
30%
1% 24%
Mar ‘16 Mar ‘17 Mar’18 (F)
Launch of
Paytm ticketing
Source: RedSeer Analysis | 37e-pharmacy is a small but fast growing space, pushed by willing to buy
online
E-Pharmacies Market Size & Growth Drivers
Market Size, by value; (USD Million)
E-Pharmacies Market Size (FY12-20F)
Initial market development with metros
Market stabilisation expected within metros but
USD 20 Mn growth still expected from expansion into Tier 2/3
Increasing smartphone/ internet penetration and
consumer willingness to shop for products online
is expected to spur growth
Increasing concerns around health and rising
costs of healthcare are increasing the share of
USD 10 Mn wallet spent on healthcare
USD 2 Mn Consumers are shifting from a ‘reactionary’
approach to a ‘preventive’ approach towards
healthcare
FY 2012 FY 2016 FY 2020 (F)
Source: RedSeer Analysis | 38Flexible inApproach,
Flexible in Approach,Firm
Firm
onon Results
Results
Thank You!
Bengaluru Office: Mumbai Office: Delhi Office: Dubai Office:
Indiqube Sigma, Plot 3/B, 25/b 4th Floor Inhwa Business Centre 42Seer Technologies
7thC Main, 3rd Block Usha Sadan Ground Floor, Iris Tech Park FZE, G-D-Flex G089 C-
Koramangala Near Colaba PO, Colaba, Sohna Road Thub Dubai Silicon Oasis
Bangalore, India - 560034 Mumbai, India - 400005 Gurgaon, India - 122002 Dubai, UAE
© 2017 RedSeer Consulting Confidential and Proprietary Information www.redseerconsulting.com query@redseerconsulting.com |You can also read