INVESTOR PRESENTATION - Authentic products drive sustainable growth HALF YEAR RESULTS - SEPTEMBER 2020 - Athens Stock Exchange
←
→
Page content transcription
If your browser does not render page correctly, please read the page content below

Authentic products drive sustainable growth

      INVESTOR PRESENTATION
         HALF YEAR RESULTS - SEPTEMBER 2020
INVESTOR PRESENTATION | SEPTEMBER 2020                                                                        Kri Kri Legal

Legal disclaimer                                                                                                        02

This presentation was prepared by KRI KRI S.A. The information contained herein has been obtained
from company and external sources believed to be reliable, but not guaranteed as to its accuracy or
completeness. The information contained herein also includes forward-looking statements which are
based on current expectations and assumptions about future events.

You should not place undue reliance on these forward looking statements. These forward-looking
statements are subject to risks, uncertainties and assumptions about KRI KRI including, among other
things, its future financial position and results, its financial outlook, budgets, projected levels of
consumption and production, projected raw materials and other costs, future taxation, estimates of
capital expenditure and plans and objectives of management for future operations.

As a result, KRI KRI’s actual results could differ materially from those anticipated in the forward looking
statements. No one undertakes to publicly update or revise any forward-looking statement unless required
by law. Past performance is no guarantee of future results. This presentation is for informational purposes
and is not to be construed as an offer to sell or a solicitation to buy shares of KRI KRI. Unless otherwise
specified, all financial information presented herein is based on KRI KRI’s IFRS financial statements.

INVESTOR PRESENTATION | SEPTEMBER 2020        Presentation Contents

Agenda                                                          03

Company Overview                         04

Strategic Review                         08

COVID-19 Mitigation Actions              19

First Half 2020 Results                  20

Outlook                                  28

Key Takeaways                            29
INVESTOR PRESENTATION | SEPTEMBER 2020                                                                                                                                                  Company Overview

At a glance 2019 highlights                                                                                                                                                                                      04

 Revenue 2015-2019                                                                EBITDA 2015-2019                                                           PBT 2015-2019
 14% GAGR                                                                         30.3% GAGR + 780bps EBITDA Margin                                          42.2% GAGR + 920bps Net Profit Margin
 +20% Y-O-Y                                                                       +22% Y-O-Y                                                                 +24% Y-O-Y

   2019                                                €113m                          2019                                       €21.1m                        2019                                         €17.6m

   2018                                        €94m                                   2018                              €17.3m                                 2018                                €14.2m

   2017                                 €79m                                          2017                    €12.4m                                           2017                     €9.9m

   2016                         €67m                                                  2016                  €10.9m                                             2016                  €8.2m

   2015                         €67m                                                  2015          €7.3m                                                      2015          €4.3m

   Earnings Per Share                  Operating Cash Flows                Dividend Yield             Payout Ratio         Return On Equity                Gearing
   CAGR 42.2%   €0.45                  14.8% CAGR   €13.7m                 3.1%                       39.6%                22.7%                           16%

15.7%                                          +36%                                          €15.6m invested                              Launched                                    400 million
Market share                                   International sales                           In production capacity                       New products                                Portions produced
A leading yogurt producer in Greece.           Accounting for 41% of total revenue.          And technology upgrades.                     In kids, infant and healthy line            Annual production volume
                                                                                                                                          product categories.                         (yogurt & ice cream).
INVESTOR PRESENTATION | SEPTEMBER 2020                                                   Company Overview

Our values A greek brand based on ethos                                                               05

Originality
We believe in fresh, plain, yet original taste.

Authenticity
We create products that have superior taste, with the best ingredients from local
Greek suppliers - the real thing.

Ethics
We do business in an ethical way. From sourcing our raw materials to our approach
to human capital, we have a sustainable approach to dealing with all our stakeholders.
INVESTOR PRESENTATION | SEPTEMBER 2020                                                                                                                    Company Overview

Product range Key product segments                                                                                                                                                06

Innovative & authentic - Loved by our customers!
Yogurt Greece                                  Yogurt Exports                               Ice cream Greece                            Ice cream Exports

BRANDED (65 SKU’s)                             BRANDED (55 SKU’s)                           BRANDED (150 SKU’s)                         BRANDED (175 SKU’s)
• Premium strained products win on taste.      • Position our branded products at           • Win on taste and choice                   • Importers in 15 countries
• Healthy product line - high protein and        premium retailers                          • Distribution provides availability        • 5,000 point of sales through kiosks,
  super foods                                  • Synergies with private label customers     • Nationwide sales network                    convenience stores and supermarkets
• Special formula for silver age               • Win on taste and authenticity
• Lactose free products
• New kids and infant product category

PRIVATE LABEL (75 SKU’s)                       PRIVATE LABEL (105 SKU’s)                    PRIVATE LABEL (15 SKU’s)                    PRIVATE LABEL (15 SKU’s)
• Strong market penetration                    • Winning major accounts expanded our 		     • Private label products for supermarkets   • Our best selling frozen yogurt drives sales
• First supplier for private label in Greece     sales in export markets                                                                • Private label products for ice Cream
                                               • Successfully tapped into new markets                                                     companies and supermarkets
                                                 and new accounts, developing products
                                                 based on local demand patterns
INVESTOR PRESENTATION | SEPTEMBER 2020                                                   Company Overview

Geographic footprint and history                                                                      07

Selling > 25                             The business began in 1954 when George
                                         Tsinavos established a small pastry shop
Countries                                in Serres, producing a variety of ice creams.
                                         In 1987 the first high technology production
                                         plant was established, signifying a new era
                                         for the company.

> 21,000                                 In 2003 Kri Kri floated on the Athens Stock
Ice cream points of sale                 Exchange. In 2013 an unexpected fire
                                         destroyed the production plant causing
                                         considerable damages.

49                                       The company quickly recovered and in
                                         2014 built a new plant with a state of the
Supermarket chains                       art production line that doubled previous
                                         productivity levels.

                                         In 2019 the company commenced a €27
42                                       million three-year investment plan to
                                         increase production capacity in yogurts
Private label customers                  and ice creams.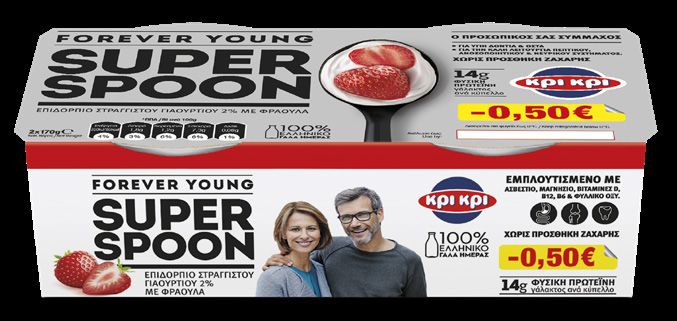
INVESTOR PRESENTATION | SEPTEMBER 2020                                                                                                     Strategic Review

What sets us apart?                                                                                                                                          08

 DISTINCTIVE                         PREMIUM                       PRODUCT                       EXPERIENCED                      WELL
 BRAND                               PRODUCTS                      INNOVATION                    MANAGEMENT                       POSITIONED
 The brand evokes                    Winning on authentic taste    We innovate based on a        Our highly motivated team of     With a leading market share
 authenticity and originality        and originality on our core   balanced range driven by      people, let by our experienced   in Greece, we are now well
 and is recognised by 96% of         product range while we are    market trends and consumer    senior management team,          positioned to expand into
 consumers in Greece.                seeing significant growth     demand to ensure our          are our greatest asset. We       international markets and be
                                     opportunities through our     product range is always the   bring in and cultivate people    the supplier of choice for our
                                     fresh and modern take in      best on the market.           with high levels of industry     private label customers.
                                     the yogurt and ice cream                                    expertise and knowledge.
                                     segments.
INVESTOR PRESENTATION | SEPTEMBER 2020                                                                                                                                    Strategic Review

Our business model How we use our assets to create value                                                                                                                                         09

                                                                 We make
                                                                 We have invested in the technology and infrastructure
                                                                                                                              We sell & distribute
                                                                 to maintain quality control, and achieve faster and more
                                                                                                                              Our business model is fully integrated and we reach our
                                                                 efficient production to sustain profitable growth. We are
                                                                                                                              customers through our distribution centres using our own
                                                                 working on the sustainability of our packaging to reduce
                                                                                                                              fleet, as well as through local distributors to maximise product
             We innovate                                         wastage, and the cost of raw materials.
                                                                                                                              availability. We are accessing new markets and increasing our
             All our products are designed and developed
                                                                                                                              collaborations though branded and private label products.
             with consumer wants and needs in mind.
             We carefully follow market trends to ensure we
             are developing new healthy and delicious products
             with the best raw materials.

                                                                     Everything we do is guided by three basic                          We deliver
                                                                                                                                        Customer happiness
                                                                 values that we started with and will always retain.                    We win our customers on taste and authenticity
                                                                      Originality | Authenticity | Ethics                               of our products resulting in a leading market share
                                                                                                                                        position of 16.1%
      We source                                                                                                                         Employee engagement
      We seek out the best suppliers to supply the premium                                                                              Stock option programme and employee benefit schemes
      ingredients which ensure that our products set us                                                                                 Supplier ethics
      apart from the competition. We carefully nurture these                                                                            Supplier partnership programmes in training and
      partnerships to ensure our suppliers benefit from                                                                                 production efficiency
                                                                                                                                        Community and environmental support
      working with us, and vice versa.                           We re-invest                                                           97% of our waste is recycled/3.000 tonnes of waste
                                                                 We re-invest our profits back into our business through                converted into biogas. 9,400 hours of employee training
                                                                 a careful capex program, to ensure that we are able to                 and support. Invested €50m in local communities.
                                                                 continue growing and innovating. We also contribute to the             Shareholder value
                                                                 societies and communities in which we operate through our              EPS growth (2015-2019) CAGR 42.2 %
                                                                 sustainability and outreach programmes, ensuring we do
                                                                 what’s right for people and the environment.
INVESTOR PRESENTATION | SEPTEMBER 2020                                              Strategic Review

Market review Branded yogurt Greece                                                                       10

Market size €185m                                        Key Highlights
Trend: +3.8% vs prior year                                2nd largest producer in Greece
                                                          96% brand awareness
Market share 16.7%                                        High market penetration
(vol.)
                                                          Sold in 100% of Greek supermarkets
                                                          Competitively priced versus competition

                                                         Strategy
                                                 16.7%
                               15.2%
                                         15.7%
                                                          Focus on high margin products
           14.2%     14.2%
 13.0%                                                    Focus on strained category
                                                          Improving quality
                                                          Investing in new technology
                                                          New product development
 2015      2016      2017      2018      2019    2020     Marketing campaigns
                                                                                          Source: IRI July 2020
INVESTOR PRESENTATION | SEPTEMBER 2020 Strategic Review
Market review Private label yogurt Greece 11
A leading supplier of private label yogurts in Greece Key Highlights
A leading product supplier of private
Market size €16.4m label yogurts in Greece
Trend: +6.4% vs prior year 75 products produced in 2019
A high profitability segment
Strategy
New product development in
collaboration with customers
Build strong customer relationships
Economies of scale
Source: IRI July 2020INVESTOR PRESENTATION | SEPTEMBER 2020 Strategic Review
Market review Yogurt exports 12
UK Italy Germany
14.4%
14.4% 10% 11.7%
Authentic Greek & Greek Authentic Greek & Greek Authentic Greek & Greek
style yogurt market £305m style yogurt market €148m style yogurt market €253m
Total market £1.5bn Total market €1.5bn Total market €2.1bn
Strategy Strategy Strategy
Increase our share of the Greek brand and Greek Further penetration to PL products Expanding the Greek style category to tap into
style yogurt (tap into larger markets) Differentiation to branded products the market and gain share
Product development adjusting to the Greek brand Capture the local consumption trends and taste Offer the right products that appeal to the
characteristics ‘Made in Greece’ Heritage • Yogurts consumed as desserts Greek style yogurt market
New Greek style product
Expanding PL product portfolio
Placing branded products to existing customers Source: IRI (Apr 2020)INVESTOR PRESENTATION | SEPTEMBER 2020 Strategic Review
Market review Ice cream Greece 13
Market size €223m Key Highlights
Trend: -1.5% vs prior year 96% brand awareness
20 % increase point of sales in last three years
Market share 14.5%
(vol.) The market is consolidated
Strategy
Increase points of sale
Maintain high margin levels
Capture any PL opportunities
*Source: Nielsen 2019INVESTOR PRESENTATION | SEPTEMBER 2020 Strategic Review
Market review Ice cream exports 14
Key Highlights
$58bn Ice cream is a large market
GLOBAL MARKET Demand for niche products 15 SKU’s for ice
cream companies and supermarkets
$18bn Countries: Cyprus, Albania, North Macedonia
EUROPEAN MARKET 5,000 Points of sale:
Kiosks, convenience stores and supermarkets
$10bn
Strategy
EUROPEAN PRIVATE
Increase Private label sales with new niche SKU’s
LABEL MARKET
Increase exports with the Frozen Yogurt line
proven to be a successINVESTOR PRESENTATION | SEPTEMBER 2020 Strategic Review
Fast changing market trends 15
Shift towards healthy type of products
Consumer loyalty towards quality brands
Upward trend in home consumption
Growing global markets in Greek style yogurts and authentic taste
Ice cream market global trends are moving towards healthier
choices like bio and organic vegan products
The global ice cream market is forecasted to grow
with a CAGR of 4.9% (2020-2025)*
Product innovation is leading the ice cream market in
terms of ingredients added, texture, packaging and technology
Supply chain challenges and product availability
* Mordor Intelligence research reportINVESTOR PRESENTATION | SEPTEMBER 2020 Strategic Review
Fast changing market trends 16
Focus Initiatives Actions
High protein - Super spoon
Capture market trends Product innovation Ageing population - Forever young
Healthy kids diet - Kids’ and infants yogurts
Develop products based on local needs
Increase yogurt & private label sales Adjust commercial tactics
Greek style yogurts. Tap Italian market with PL
Product innovation Frozen yogurt, large inclusions
Increase ice cream sales
Adjust commercial tactics Penetration with PL covers retailers’ special needs
Scandinavia, France, Spain, Russia.
Geographical expansion Refine strategic expansion Alternative channels: food service in UK
Invest in infrastructure and capacity,
Increasing operating efficiency Form key performance indicators
technology and systemsINVESTOR PRESENTATION | SEPTEMBER 2020 Strategic Review
Investment plan Facilities & capital expenditure 17
Three year investment plan: €27m Capex progress Key Points
Modern production facilities in buildings
E=30,000m2
€4m Capacity of further development in land
€5.7m
E=80,000m2
Government investment programme
€5m
€27m €12m €5.7m
subsidises 35% of the total investment
as a tax exception. (2019-2022) tax
€27m
exemption is estimated at €9.8m
€6m Tax exemption projection
€15.6m
2019 2020 2021 2022 Total
€1.2m €3.1m €3.4m €2.1m €9.8m
Production capacity increase Biogas
Modernisation Maintenance 2019 2020 Pending Total Annual maintenance Capex: €1.5-2m
(YTD)INVESTOR PRESENTATION | SEPTEMBER 2020 Strategic Review Setting the framework for sustainable growth 18 Continuous pursuit for operational excellence / IT projects Effective management team High employee engagement / stock option program Corporate governance Social responsibility
INVESTOR PRESENTATION | SEPTEMBER 2020                       COVID-19 MITIGATION ACTIONS

Reassessing recourses Building business resilience                                    19

                                          Strengthen sales
       Product innovation continues
       Marketing campaigns increase       Brand availability and preference
       Brand investment and support
       Focus on supply chain efficiency   Resources maintained
       New ways of working
                                          People safety

       Cash management
       Credit facilities
                                          Building financial resilience
       Gearing
       Investment plan as scheduled
INVESTOR PRESENTATION | SEPTEMBER 2020 First Half 2020 Results
H1 2020 Highlights 20
Interim results for 6 months ended June 2020
REVENUE EBITDA EBIT PBT
€65.9m €13.8m €12.0m €11.9
€10.5m
€57.4m €11.7m €12.2m €10.1m
€10.3m €10.6m
€50.9m
2018 2019 2020 2018 2019 2020 2018 2019 2020 2018 2019 2020
Revenue 2020 EBITDA 2020 EBIT 2020 PBT 2020
€65.9m €13.8m €12.0m €11.9m
+14.8% Y-O-Y +13.0% Y-O-Y +13.6% Y-O-Y +13.7% Y-O-Y
Profit After Tax €9.1m +19.0% Earnings Per Share €0.27 + 19.0%INVESTOR PRESENTATION | SEPTEMBER 2020 First Half 2020 Results
H1 2020 Operational highlights 21
Interim results for 6 months ended June 2020
YOGURT 77 POINTS OF SALE MAINTAINED HIGH
SEGMENT SALES NEW PRODUCTS INCREASED EBIT MARGIN
+ 22.6% LAUNCHED BY 850 AT 18.3%
Operational Highlights: Financial Highlights:
Strong sales growth in the Yogurt segment driven by Greece +16.3% Gross margin affected by increased raw material prices, sales mix,
and Exports +29.7% and increased trade marketing activity
Growth in Greece was driven by the launch of new products and the Reacted on cost base to protect profit
increase in point of sales. Another contributor was the positive trend in Increased operating cash flow
the yogurt market that increased by 5.2%
Net profit growth +19.0%
Growth in Exports was driven by further penetration in the Italian
Investments of €5.7m
market with sales increasing more thant 60% and strong sales growth
in the UK (+20%) and Central Europe (+6%).
Ice cream sales posted a decline mainly due to the COVID-19 pandemicINVESTOR PRESENTATION | SEPTEMBER 2020 First Half 2020 Results
H1 2020 Sales bridge 22
Interim results for 6 months ended June 2020
€m
5.7
-0.6
-0.5
3.6
65.3
57.2
SALES 6M19 YOGURT GREECE YOGURT EXPORT ICE CREAM GREECE ICE CREAM EXPORT SALES 6M20
Increase Decrease TotalINVESTOR PRESENTATION | SEPTEMBER 2020 First Half 2020 Results H1 2020 Income statement 23 Interim results for 6 months ended June 2020 IFRS - €m H1 2020 H1 2019 % Change Sales 65.9 57.4 14.8% Gross Profit 22.8 22.4 1.6% Gross Profit Margin 34.5% 39.0% EBITDA 13.8 12.2 12.9% EBITDA Margin 20.9% 21.3% EBIT 12.0 10.6 13.6% EBIT Margin 18.3% 18.5% PBT 11.9 10.5 13.7% Net Profit 9.1 7.6 19.0%
INVESTOR PRESENTATION | SEPTEMBER 2020                                                       First Half 2020 Results

EBIT Bridge                                                                                                      24

Interim results for 6 months ended June 2020
€m

                               SALES MIX
                                  0.9

                           EXTRA TRADE MRKT 0.5

                             RAW MATERIALS                          0.3
                                PRICES
                                   1.5                0.8
                                                                COST CONTROL
                                                                     -1.5
                                   0.4

                                                                                   12.1

          10.6

       EBIT 6M2019            GROSS PROFIT           LESS        LESS OPEX     EBIT 6M2020
                                                  ADVERTISING
INVESTOR PRESENTATION | SEPTEMBER 2020 First Half 2020 Results H1 2020 Financial results per segment 25 Interim results for 6 months ended June 2020 IFRS - €m Sales % Change Gross Profit % Change Gross Margin EBIT % Change EBIT Margin Yogurt 50.2 22.6% 15.3 7.8% 30.5% 8.4 19.2% 16.8% Greece 25.4 16.3% 8.3 -0.1% 32.7% 3.8 11.4% 15.2% Export 24.8 29.7% 7.0 19% 28.3% 4.6 26.6% 18.5% Ice cream 15.1 -7.0% 7.4 -10.8% 48.9% 3.3 -2.3% 22.0% Greece 12.2 -5.0% 6.6 -7.7% 54.6% 2.9 0.9% 24.0% Export 2.9 -14.5% 0.7 -31.9% 25.0% 0.4 -21.1% 13.6% Rest 0.6 0.05 0.3 TOTAL 65.9 14.8% 22.7 1.6% 34.5% 12.0 13.6% 18.3%
INVESTOR PRESENTATION | SEPTEMBER 2020                                                                 First Half 2020 Results

H1 2020 Cash flow Key financial figures                                                                                       26

Interim results for 6 months ended June 2020
                                                            H1 2020 €m    H1 2019 €m

  Profit before tax for the period                                11.9          10.5
  Adjusted by:
       Depreciation                                                1.9            1.8
       Other interest expense                                      0.2           0.2
       Other non-cash expenses                                     0.4           0.1
  Operating cash flow before movements in working capital         14.5          12.7
  Changes in working capital                                      (5.4)        (10.4)   Improvement in working capital was due
                                                                                        to better payment terms from sales mix,
  Interest paid                                                   (0.2)         (0.2)
                                                                                        supplier days payables extended due to
  Cash flow generated from operating activities                    8.9           2.1    COVID-19 and VAT returns.

  Cash flows used in investing activities                         (6.0)         (6.5)
  Free cash flow                                                   2.9         (4.4)
INVESTOR PRESENTATION | SEPTEMBER 2020 First Half 2020 Results
H1 2020 Balance sheet Key financial figures 27
Interim results for 6 months ended June 2020
H1 2020 €m 31/12/2019 €m
Non-current assets 62.4 58.5
Current assets 57.2 48.8
Total assets 119.6 107.3
Non-current liabilities 15.2 20.7
Current liabilities 29.2 20.5
Total liabilities 44.5 41.2
Net assets 75.2 66.1
Leverage ratio - 0.1xINVESTOR PRESENTATION | SEPTEMBER 2020 Outlook
Mid-term objectives Progress against strategy YTD 28
Our revenue increased by 14.8% driven both by sales in Greece and
Sales Growth: double digit Exports. We expect our growth to continue as we are delivering on our
strategy on product development, market penetration and expansion.
Our EBITDA margin at 20.9% demonstrates our business resilience.
EBITDA Margin: > 17.5% We are working on cost control, operating efficiency and working
capital optimisation.
Our Exports increased by 23.0% accounting for 42% of total revenue.
Exports / Revenue: > 50% Our Strategy is based on expanding into new markets and on further
penetrating existing customers mainly in the international markets.INVESTOR PRESENTATION | SEPTEMBER 2020 Outlook
Key takeaways 29
Strong set of results both in sales and profitability
Despite the macroeconomic challenges we managed
to increased our profitability
Continued to invest in new products according
to market trends
Our capex plan continued as planned, investing in
technology and infrastructure
We remain confident that our strategy will support our
leadership position and our expansion into new markets
We will continue to invest in our business, our people
and the environmentYou can also read