Schaeffler AG Capital Markets Presentation - November 2016 London
←
→
Page content transcription
If your browser does not render page correctly, please read the page content below
Schaeffler AG
Capital Markets Presentation

          November 2016
             London
Disclaimer

    This presentation contains forward-looking statements. The words "anticipate", "assume", "believe", "estimate", "expect", "intend", "may", "plan",
    "project“, "should" and similar expressions are used to identify forward-looking statements. Forward-looking statements are statements that are not
    historical facts; they include statements about Schaeffler Group's beliefs and expectations and the assumptions underlying them. These statements are
    based on plans, estimates and projections as they are currently available to the management of Schaeffler AG. Forward-looking statements therefore speak
    only as of the date they are made, and Schaeffler Group undertakes no obligation to update any of them in light of new information or future events.
    By their very nature, forward-looking statements involve risks and uncertainties. These statements are based on Schaeffler AG management's current
    expectations and are subject to a number of factors and uncertainties that could cause actual results to differ materially from those described in the
    forward-looking statements. Actual results may differ from those set forth in the forward-looking statements as a result of various factors (including, but
    not limited to, future global economic conditions, changed market conditions affecting the automotive industry, intense competition in the markets in
    which we operate and costs of compliance with applicable laws, regulations and standards, diverse political, legal, economic and other conditions affecting
    our markets, and other factors beyond our control).
    This presentation is intended to provide a general overview of Schaeffler Group’s business and does not purport to deal with all aspects and details
    regarding Schaeffler Group. Accordingly, neither Schaeffler Group nor any of its directors, officers, employees or advisers nor any other person makes any
    representation
    or warranty, express or implied, as to, and accordingly no reliance should be placed on, the accuracy or completeness of the information contained in the
    presentation or of the views given or implied. Neither Schaeffler Group nor any of its directors, officers, employees or advisors nor any other person shall
    have any liability whatsoever for any errors or omissions or any loss howsoever arising, directly or indirectly, from any use of this information or its contents
    or otherwise arising in connection therewith.
    The material contained in this presentation reflects current legislation and the business and financial affairs of Schaeffler Group which are subject to
    change.

2            November 2016                                       Capital Markets Presentation | © Schaeffler 2016
Agenda

1   Schaeffler at a glance

2   Financial Results 9M 2016

3   Strategy "Mobility for tomorrow"

4   Investment Highlights

5   Summary

3        November 2016                 Capital Markets Presentation | © Schaeffler 2016

1 Schaeffler at a glance
Schaeffler AG – A leading integrated automotive and industrial supplier
Schaeffler at a glance Key financials
in EUR mn unless otherwise indicated
2014 2015
Leading integrated automotive and industrial supplier of high-precision components Sales 12,124 13,179
and systems % growth 8.2% 9.1%
Global footprint with around 85,000 employees at about 170 locations in more than % growth at constant currency 9.0% 3.5%
50 countries EBITDA2) 2,210 2,370
Balanced business portfolio across sectors, geographies % margin 18.2% 17.9%
and diversified customer base with leading market positions EBIT2) 1,561 1,676
Sizeable aftermarket exposure contributes to stable financial performance % margin 12.9% 12.7%
EBIT2) margin Automotive 14.0% 13.6%
Highly attractive profitability and cash returns
EBIT2) margin Industrial 9.6% 9.7%
2) Before one-off effects
Sales by division (20151)) Sales by region (2015)3)
Industrial Asia/Pacific
OEM
Industrial 16% 10.3%
Distribution Greater China4) 14.4%
8%
79%
21%
Automotive 53.3%
13% 63% OEM
Automotive 22.0%
Aftermarket Europe5)
Americas
3) Market view (= location of customer)
4) China, Hong Kong and Taiwan
1) Pro-forma 2015 numbers with new Industrial structure 5) EMEA, Russia and India
4 November 2016 Capital Markets Presentation | © Schaeffler 2016
2 Financial Results 9M 2016
Business operations on sound footing – Financial flexibility has been regained

                                                                                            X%      Automotive share of sales
    Schaeffler Sales and EBIT 1)                                                                                                Schaeffler Free Cash Flow and Net debt 1)           X.X%     Capex in % of sales
                                                                                           Y.Y%     EBIT margin
    in EUR mn                                                                                                                   in EUR mn                                            Y.Yx    Leverage ratio

                                 CAGR
                                 +5%

                                                                                                                                                                    2)
                                                                                                                  2)

                                                                                                                                                                                                2,876

                      66%           67%          76%                               12.9%    15.9%        12.7%                              11.2%      3.8%     7.8%     2.7x      2.1x 2)        1.2x

                                                                                                                                                                                               30/09/16
                           Sales /                                                    EBIT / EBIT Margin                                         Free Cash Flow /
                                                                                                                                                                         Net Debt / Leverage Ratio
                   Automotive Share of Sales                                                                                                       Capex Ratio
1) 2006-2010 relates    to financials of a different entity (Schaeffler VZ GmbH)
2) Before   one-off effects

5                   November 2016                                                                 Capital Markets Presentation | © Schaeffler 2016
2 Financial Results 9M 2016
Key figures 9M 2016

                                                                                                                                                           9M '16                                                                                         Q3 '16
     in EUR mn                                                                         9M '15                             9M '16                       vs. 9M '15                              Q3 '15                             Q3 '16              vs. Q3 '15
                                                                                                                                       +0.2%                                                                                                +0.9%
     Sales                                                                           9,958                                9,977                                                              3,237                                3,265
                                                                                                                                                        +2.7%1)                                                                                        +2.3%1)
                                                                    1,2582)                                                            +1.4%
     EBIT                                                                                                                 1,276                                                                 433                                  417                 -3.7%
                                                                                     1,251                                                                +2.0%
                                                                    12.6%2)                                                            +0.2%-pts.
     EBIT margin                                                                                                          12.8%                                                             13.4%                               12.8%               -0.6%-pts.
                                                                                     12.6%                                                    +0.2%-pts.

     Net income                                                                         521                                 672                       +151 mn                                   212                                178                 -34 mn

     Capex                                                                              743                                 829                         +86 mn                                  242                                  268               +26 mn

     Free cash flow                                                                     192                                 479                       +287 mn                                   264                                  263                -1 mn

     Net financial debt3)                                                            4,889                                2,876                     -2,013 mn                                4,889                                2,876             -2,013 mn

     Leverage ratio 2) 3) 4)                                                             2.1                                 1.2                             -0.9                                2.1                                  1.2                -0.9

     ROCE2)                                                                          21.9%                                21.9%                      0.0%-pts.                              21.9%                                21.9%              0.0%-pts.

     EPS5)                                                                             1.31                                 1.02                            -0.29                              0.53                                 0.27                -0.26

     Pro Forma EPS6)                                                                   0.88                                 1.02                           +0.14                               0.36                                 0.27                -0.09

    1) FX-adjusted              3) Prior year figure as per December 31, 2015   5) As reported according to IAS 33; see           6) Share of net income for 66 mn non-voting shares issued through capital increase in October 2015
    2) Before one-off effects   4) Net financial debt to LTM EBITDA             backup chart for further information              was calculated for each quarter on a pro-rata temporis basis; see backup chart for further information

6                    November 2016                                                                  Capital Markets Presentation | © Schaeffler 2016
2 Financial Results 9M 2016
Sales growth 9M 2016 2.7% (FX-adjusted)
Sales Sales by region 9M 2016
in EUR mn y-o-y growth (w/o FX effects)
Asia/Pacific
+2.7%1)
+2.9% (+4.4%)
vs 9M 2015
Greater China 10.3%
3,339 3,382 3,343 3,369 +5.5% (+10.5%)
3,237 3,221 3,265 14.3%
54.2%
21.2%
Americas Europe
-5.0% (-0.4%) +0.5% (+1.7%)
13,179 9,977
Q1 Q2 Q3 Q4 Q1 Q2 Q3 Sales by division
Y-o-y growth (w/o FX effects)
2015 2016
FX-adjusted sales growth in % 9M15 9M 16 (w/o FX Q3 15 Q3 16 (w/o FX
5.3 4.5 2.9 1.3 2.4 3.3 2.3 effects) effects)
3.5 2.7 Auto-
7,511 7,703 +5.3% 2,442 2,524 +5.1%
motive
EBIT margin2) in %
13.2 11.4 13.4 13.0 12.6 13.0 12.8 Industrial 2,447 2,274 -5.3% 795 741 -6.2%
12.3 12.8
Total 9,958 9,977 +2.7% 3,237 3,265 +2.3%
1) FX-adjusted
2) Before one-off effects
7 November 2016 Capital Markets Presentation | © Schaeffler 2016
2 Financial Results 9M 2016
Automotive – Strong growth in Greater China

    Automotive sales and market development 9M                                                                                 Automotive sales by division 9M
                Europe                Americas            Greater China            Asia/Pacific                                in EUR mn                                                            9M 2015
                                                                    +22%                                                                                        +4.7%1)                             9M 2016
                                                           +11%
                                                                                           +7%                                          +2.4%1)              3,150   3,217
               +4%     +3%
                                     0%      +1%                                                                                    1,946      1,960                                              +10.3%1)
                                                                                                                                                                                +6.2%1)
                                                                                   -3%                                                                                                          1,317    1,384
                                                                                                                                                                             1,098   1,142
                                        World production:       +3.4%
                                        Schaeffler Automotive: +5.3%
                                               (w/o FX effects)
                                                                                                                                    Engine Systems           Transmission    Chassis Systems     Automotive
               Production of light vehicles 9M 2016 vs 9M 2015 (IHS)                                                                                            Systems                          Aftermarket
               Sales growth (w/o FX effects) Schaeffler Automotive 9M 2016 vs 9M 2015

                                                                                                                                Automotive sales by division Q3
    Automotive sales by region                                                                        Asia/Pacific
                                                                                                                                in EUR mn                                                               Q3 2015
                                                                                          Q3: +3.7% FX-adjusted
                                                                                                                                                                +4.4%1)                                 Q3 2016

     Greater China                                    10%
                                                                                                                                        +2.4%1)              1,009   1,037
     Q3: +38.9% FX-adjusted                   15%
                                                                                                                                     625        636                                                 +9.8%1)
                                                                                                                                                                                 +5.3%1)
                                                                        53%                                                                                                                       456      483
                                                                                                                                                                               352        368

    Americas                                    22%
                                                                                                           Europe
    Q3: -1.2% FX-adjusted
                                                                                           Q3: +0.2% FX-adjusted                    Engine Systems           Transmission     Chassis Systems     Automotive
                                                                                                                                                                Systems                           Aftermarket
                                       Sales 9M 2016: EUR 7,703 mn                                                             1) Growth rates FX-adjusted

8              November 2016                                                                      Capital Markets Presentation | © Schaeffler 2016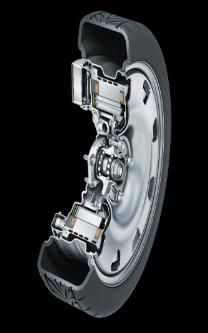
2 Financial Results 9M 2016
Industrial – Mixed development across sectors

    Industrial sales by sector cluster 9M1)                                                                Industrial sales by region 9M
                                                                                                           in EUR mn                                                               9M 2015
                                                                                                                                                                                   9M 2016
                                                                               Two-Wheelers
                                                                              Wind                                -0.9%1)
                                                                  Aerospace                                   1,382      1,352                  -6.4%1)
                                                    Industrial Automation                                                                                      -20.4%1)
                                                                                                                                          466        423                         -5.3%1)
                                                    Offroad                                                                                                  361
                                                                                                                                                                    279     238           220
                                                    Power Transmission
                                                    Rail
                                                    Raw Materials                                                 Europe                    Americas       Greater China    Asia/Pacific
                                                    Industrial Distribution

           -25%         -20%    -15%   -10%   -5%           +5%       +10%        +15%

    Industrial sales by sector cluster Q31)                                                                Industrial sales by region Q3
                                                                                                           in EUR mn                                                                Q3 2015
                                                                      Two-Wheelers                                                                                                  Q3 2016
                                                     Industrial Automation
                                                     Aerospace                                                    -2.4%1)
                                                     Wind
                                                                                                              451        435
                                                     Offroad
                                                                                                                                            -4.7%1)           -21.1%1)
                                                     Power Transmission                                                                                                         -6.3%1)
                                                                                                                                          146       139    122      93
                                                     Rail                                                                                                                  76         74
                                                    Raw Materials
                                                    Industrial Distribution                                      Europe                    Americas        Greater China   Asia/Pacific

             -25%       -20%    -15%   -10%   -5%           +5%       +10%           +15%

     1) FX-adjusted                                                                                         1) Growth rates FX-adjusted

9                   November 2016                                             Capital Markets Presentation | © Schaeffler 2016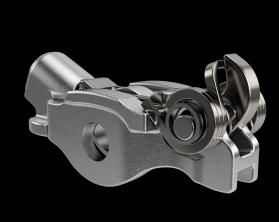
2 Financial Results 9M 2016
Strong Free Cash Flow generation
Free Cash Flow Key aspects
9M 2015 9M 2016 Q3 2015 Q3 2016 Free Cash Flow increased by EUR 287 mn to EUR 479 mn in 9M 2016
EBITDA 1,765 1,817 604 600 Net interest paid dropped by EUR 302 mn in 9M 2016
Net interest paid -389 -87 -50 -53 EUR 829 mn capex in 9M 2016
Income taxes paid -247 -234 -89 -73 Schaeffler Value Added EUR 920 mn
Working capital change -273 -303 -40 -16
Others 56 112 65 70
CF from Operations 912 1,305 490 528
Schaeffler Value Added (LTM)1)
in EUR mn
Capex -743 -829 -242 -268 2.7
931 906 951 920
896 878 870
in % of Sales 7.5 8.3 7.5 8.2
Others 23 3 16 3
22.8% 22.2% 22.5% 22.5% 21.9%
21.9% 22.1%
CF from Investments -720 -826 -226 -265 RoCE1)
Free Cash Flow 192 479 264 263
Q1 Q2 Q3 Q4 Q1 Q2 Q3
2015 2016
Cash & cash equivalents 724 2,565 724 2,565
1) Before one-off effects
10 November 2016 Capital Markets Presentation | © Schaeffler 20163 Strategy "Mobility for tomorrow"
Chronology 2009-2016 – Foundation for further profitable growth
Key milestones
Schaeffler Group
Restructuring and transformation phase
Today finalized
“One Schaeffler” implemented in 2013-
2015
New corporate and capital structure
Sustainable profitable growth
implemented
First Capital Markets Day in July 2016
Strategy Vision, mission and corporate values
concept
Mobility for tomorrow defined
Investment Grade rating received
“One Schaeffler” “Agenda 4 plus One”
Vision
Corporate & capital structure IPO Mission Strategy "Mobility for
Values
tomorrow"
2009 – 2011 2012 – 2015 2016 – 2020 > 2020
“Restructuring” “Transformation” “Profitable Growth”
11 November 2016 Capital Markets Presentation | © Schaeffler 20163 Strategy "Mobility for tomorrow"
Four focus areas – "Where to play"
Eco-friendly drives Urban mobility
Environment Climate change Optimized combustion engine Two-wheelers
Electric vehicles Metro rail traffic
Industrial drives Micro mobiles
Society Urbanization
Mobility for
tomorrow
Economy Globalization
Interurban mobility Renewable energy
Technology Digitalization Railway vehicles Wind energy
Airplanes Solar energy
Off-highway Conventional power generation
12 November 2016 Capital Markets Presentation | © Schaeffler 20163 Strategy "Mobility for tomorrow"
8 strategic pillars – Our strategic framework
1 We want to be
the preferred
technology
2 We are an
Automotive
and Industrial
3 We are a global
company with
a local presence
4 We produce
components and
systems.
partner for our supplier. throughout
customers. the world.
5 We view E-Mobility,
Industry 4.0, and
Digitalization
6 We strive for the
highest possible
quality, efficiency,
7 We want to be an
attractive employer. 8 We live by the
values of a global
family business.
as key opportunities and delivery
for the future. performance.
13 November 2016 Capital Markets Presentation | © Schaeffler 20163 Strategy "Mobility for tomorrow"
16 strategic initiatives – Excellence program “Agenda 4 plus One”
Agenda 4 plus One Initiatives Sponsor
Customer focus Long-term 1 Customer Excellence Prof. Pleus / Dr. Spindler
competitive- 2 E-Mobility Prof. Gutzmer
ness and value 3 Industry 4.0 Dr. Spindler
1 2 3 creation
4 Quality for Tomorrow Rosenfeld
Operational
excellence 13 14 15 16 5 Global Footprint Rosenfeld
6 Factory for Tomorrow Jung
4 5 6 7 8 7 Shared Services Dr. Hauck
8 Process Excellence Rosenfeld
Financial flexibility
9 Working Capital Dr. Hauck
9 10 Leadership & Corporate Values Schittenhelm
11 Qualification for Tomorrow Schittenhelm
Leadership & Talent 12 New Work Schittenhelm
management
13 Program CORE Dr. Spindler
10 11 12 14 Digital Agenda Prof. Gutzmer
plus One 15 IT 2020 Prof. Gutzmer
16 Global Branding Rosenfeld
14 November 2016 Capital Markets Presentation | © Schaeffler 20163 Strategy "Mobility for tomorrow"
Financial Ambitions for 2020 – Sustainable value creation
Capital Markets Day July 20, 2016 Old Strategy Communication Nov. 9, 2016 New
Sales Growth Ø 4-6% p.a. Sales Growth Ø 4-6% p.a.
w/o external growth, FX-adjusted w/o external growth, FX-adjusted
EBIT Margin 12-13% p.a. EBIT Margin 12-13% p.a.
Before one-off effects, w/o external growth Before one-off effects, w/o external growth
Free Cash flow ~€ 900M in 2020 Free Cash flow ~€ 900M in 2020
w/o external growth w/o external growth
Leverage Ratio4 Investment highlights
The Schaeffler Equity Story – 3 key elements
3 key elements Key objectives
Growth
Outperformance Consistent growth above markets
1
in Automotive Best-in-class margin
Margin
Profitable growth
CORE program launched to revitalize and sustainable
Margin upside Industrial division
2
in Industrial Margin upside potential + 3%-points value creation
Cash
flow
Strong Free Strong operating Cash flow Generation
3 Cash flow FCF used for dividend payments, M&A and further
generation deleveraging
16 November 2016 Capital Markets Presentation | © Schaeffler 20164 Investment highlights – Outperformance Automotive
1 Schaeffler Automotive – Growing profitably above market
Sales and EBIT margin Out-performance in all regions1)
Global Market +4%
9,993
8,164 8,986 Schaeffler Automotive +9%
7,658
Market Schaeffler
15% 24%
2012 2013 2014 2015 9%
5% 2% 5% 1% 7%
Growth rate (y-o-y) +7.0% +6.6% +10.0% +11.2%
EBIT margin1) 13.5% 13.0% 14.0% 13.6% Americas Europe Asia / Pacific Greater China
1) Before one-off effects 1) Schaeffler Automotive CAGR 2010 – 2015 excluding Aftermarket and FX
Sales by region Broad customer mix
Top 10 customers
22%
40%
53%
15%
60%
10%
Europe Asia/Pacific Greater China Americas
Top 10 automotive customers
Other customers
17 November 2016 Capital Markets Presentation | © Schaeffler 20164 Investment highlights – Outperformance Automotive
1 Four growth drivers for Schaeffler Automotive
Most relevant Automotive Growth drivers Current examples
trends Finger follower Finger follower
Growth from (not switchable) ~ 4 x more
(switchable)
1 new technologies / content1)
products
Conventional Double clutch
clutch with actuation
Growth from ~ 10 x more
and control unit
2 higher systems content1)
share
Ball screw drive
CO2 & Emission +15% pts for electric
Growth from brake China
installation
reduction 3 new customers rate2)
Continuous growth in and markets
Emerging Markets Dual mass RepSet
flywheel dual mass
Comfort & Safety Growth from (single parts)
> 4 x faster
flywheel
4 Aftermarket growth3)
Connectivity business
1) based on unit price; 2) installation rate 10% in 2015, 25% in 2020; 3) Sales CAGR 2015 – 2020
18 November 2016 Capital Markets Presentation | © Schaeffler 20164 Investment highlights – Outperformance Automotive
1 We target at least 4%-pts OE sales growth above market1) until 2020
Estimated share of booked business and initiated customer projects Key aspects
in % of net sales (excluding Aftermarket) Around 90% of our OE business for
2020 is either booked business or
customer projects that are already
CAGR 4%+pts initiated
above market1) 10%
We target an average growth rate of
15% at least 4%-pts above market1) for
our Automotive OE business until
2020
Mix impact from mechatronics is
75% expected to remain limited; we aim
to maintain our high level of
profitability
We are confident to be able to
secure our value add in mechatronic
systems
2015 2016 2017 2018 2019 2020
Booked Customer projects initiated New business
1) At constant currency
19 November 2016 Capital Markets Presentation | © Schaeffler 20164 Investment highlights – Outperformance Automotive
1 Market growth driven by new technologies
Global production volume 1) Basic scenario 2) Key aspects
in millions of units
Continuous market growth expected for
the next years
CAGR 2010/2030
+2.4% p.a. 120 Future growth based on increasing
111
10% Battery electric engines (27%) 3) production of hybrid and
102 4%
Hybrid engines (19%)4) electro vehicles, in 2025 >25% of the
89
13% 24% 37% Internal combustion market, accelerated scenario possible
engines (-1%) 4)
74
Decrease of amount of vehicles with
conventional engine expected from 2020
Global fleet today >1 bn vehicles –
98% 97% 85% 72% 53% importance of aftermarket grows
2010 2015 2020e 2025e 2030e
New technologies drive
market growth
Source: IHS, LMC Automotive, Schaeffler Group projections
1) Annually expected global production volume, automobiles/small utility vehicles in millions of units
2) Schaeffler estimates
3) CAGR 2015/2030
4) CAGR 2010/2030
20 November 2016 Capital Markets Presentation | © Schaeffler 20164 Investment highlights – Outperformance Automotive
1 E-Mobility as our key challenge and opportunity
Product portfolio Key aspects
1999
C02 – Reduction 1st Schaeffler E-Mobility symposium
2002
1st E-Mobility concept car
2005
1st serial production of components
for hybrid modules
HV hybrid 2016
module 500 Million Euro investment to date1)
48 V hybrid 1,200 employees globally in R&D and
module Electric wheel
manufacturing of mechatronics, hybrid
hub drive
E-Clutch technologies and E-Mobility
4 customer projects for hybrid modules
HV e-axle
4 customer projects for e-axles
2020
48 V 48 V Further 500 Million Euro investment1)
Front end e-axle
Doubling of employees in R&D and
accessory drive manufacturing
Mild hybrid vehicles (48 V) Hybrid vehicles (HEV, PHEV) Electric vehicles (BEV)
Grade of electrification 1) Including R&D
21 November 2016 Capital Markets Presentation | © Schaeffler 20164 Investment highlights – Margin upside Industrial
2 Schaeffler Industrial – Bearing solutions for 8 sector clusters and distribution
Sales development 2012 – 2015 Sales split by region 2015
Americas
3,406
3,233 19%
3,138 Greater China Europe
3,041
2012 2013 2014 2015 15% 56%
Growth rate (y-o-y) -1.6% -10.7% +3.2% +3.0%
Asia/Pacific 10%
EBIT-margin1) 12.7% 10.7% 9.6% 9.7%
1) Before one-off effects
Sales split by sector cluster & distribution channel 2015 Sales split by business model 20151)
Wind Raw Materials Standard product
distribution business
10% 8% Aerospace
7% Customized product business
Rail 30%
7% 35%
5% Offroad
Industrial Distribution 33%
4% Two-Wheelers
14% Standard product
13% 35% OEM and MRO business
Industrial Automation Power Transmission
1) Including service business
22 November 2016 Capital Markets Presentation | © Schaeffler 20164 Investment highlights – Margin upside Industrial
2 Program CORE – Revitalizing the Industrial division
4 key drivers
1 Strengthen sales organizations in the regions
Customer
Strengthen regional engineering / customer support centers
focus and
growth Establish dedicated global key account management
2 Reduce overhead cost
Cost
reduction & Re-dimension central departments
efficiency Drive cost saving program including material cost,
Program improvement efficiency gains and overhead reduction
CORE
3 Establish European distribution centers (EDC)
High
to ensure immediate product availability
delivery
performance Increase level of standardization
Implement high runner program with 24/48h delivery time
4 Strengthen standard product business
Optimized
product Balance customized product business / engineering solutions
and service Enforce market penetration of service / digitalization
offering
23 November 2016 Capital Markets Presentation | © Schaeffler 20164 Investment highlights – Margin upside Industrial
2 Cost reduction and efficiency improvements – First wave mostly completed
Key aspects Indicative Financial Impact
Δ EBIT in EUR mn
40
First wave announced in August 2015 31
15 2)
Cost savings through HCO reduction in overhead functions of the
Industrial Division -36
2014A 2015A 2016F 2017P 2018P
1) Financial impact in specific year
Reduction of 500 HCO mainly in Germany until 12/2017 2) thereof 9 mn Euro YTD September 2016
EBIT Improvement One-off effects
Completion
HCO reduction Overhead Ratio 83 % 3)
Approximately 40 EUR mn overhead cost savings (full run rate 2018)
2.165 263
154
36 EUR mn restructuring provisions (booked in Q IV 2015) 83
1.665
417
Overhead Left payroll Signed In progress Target
Headcount termination Overhead
06/2015 contracts Headcount
3) as of November 3, 2016 12/2017
24 November 2016 Capital Markets Presentation | © Schaeffler 20164 Investment highlights – Margin upside Industrial
2 Cost reduction and efficiency improvements – Second wave initiated
Key aspects Indicative Financial Impact
Δ EBIT in EUR mn
58
Second wave announced in November 2016 23
41
50 60
37
Cost savings through consolidation of plants in Europe and Americas -2
and HCO reduction in overhead functions also outside the Industrial -14 -9
division
-50 1)
2015A 2016F 2017P 2018P 2019P
Reduction of 500 HCO in Germany1), Europe and other regions 1) 2016-2019 intotal 75 mn Euro, thereof 50 mn Euro booked as
restructuring provision
EBIT Improvement One-off costs
targeted
Indicative
HCO reduction Plants/Overhead figures
Approximately 60 EUR mn improvement from Gross Profit
optimization and Overhead cost reduction until 2019 planned
500 ~400
~100
Around 75 EUR mn one-off-cost until 2019 of which approximately
50 EUR mn shall be booked as restructuring provisions
as of year end 2016
Total HCO Germany Europe Amercias Others
reduction
target
1) Subject to negotiation with working council
25 November 2016 Capital Markets Presentation | © Schaeffler 20164 Investment highlights – Margin upside Industrial
2 Program CORE – Overall target remains in place
Successful implementation Financial ambitions
Today
Indicative Stable market
Timing
environment
Continuous improvement through
further optional measures
EBIT margin
500 HCO Industrial Division
Cost reduction 10-11% in 2018
2nd wave
24 months
Cost reduction 500 HCO
1st wave Successful
implementation
24 months of CORE program
2015 2016 2017 2018 2019
26 November 2016 Capital Markets Presentation | © Schaeffler 20164 Investment highlights – Strong Free Cash Flow Generation
3 Use of cash – M&A strategy based on selected add-on acquisitions
M&A strategy Use of cash
Approach Focus on technological competence to maintain our strong position as
technology and innovation leader
External growth
Focus on smaller add-on acquisitions that contribute to a sustainable Add-on
value creation acquisitions
Acquisition Strategic and cultural fit, technological excellence and value
Criteria
Use
contribution as the most important acquisition criteria of
Possible acquisitions will be in the three-digit million range Cash
Deleveraging Dividends
Automotive Attractive pipeline of potential acquisition targets for both divisions Further 30-40% of
& Industrial optimization of net income
Focus in Automotive and Industrial is on technology and on balance sheet
strengthening market positions
27 November 2016 Capital Markets Presentation | © Schaeffler 20165 Summary
Key messages
1 Restructuring and transformation phase finalized, foundation laid for further profitable growth
2 Long-term growth strategy "Mobility for tomorrow" finalized and presented
Financial Ambitions 2020 with focus on sales growth, EBIT margin, FCF generation, EPS, gearing
3
ratio and dividend payout ratio
Mobility for
Continued optimization of combustion engine and move into E-Mobility offer significant growth tomorrow
4
potential in Automotive
Program CORE to revitalize the Industrial division extended, second wave of efficiency measures
5
initiated
Enhanced financial flexibility and strong cash flow generation allow for selected technological
6
add-on acquisitions
28 November 2016 Capital Markets Presentation | © Schaeffler 2016IR Contact
Investor Relations Financial Calendar
FY 2016 results: March 8, 2017
Phone: + 49 9132 82 4440 Q1 2017 results: May 11, 2017
Email: ir@schaeffler.com H1 2017 results: August 8, 2017
Web: www.schaeffler.com/ir 9M 2017 results: November 8, 2017
29 November 2016 Capital Markets Presentation | © Schaeffler 2016You can also read