2021 RESULTS PRESENTATION - For the 53 weeks ended 4 July 2021 - Shoprite Holdings
←
→
Page content transcription
If your browser does not render page correctly, please read the page content below
2021 RESULTS
PRESENTATION
 For the 53 weeks ended
        4 July 2021
WELCOME
  PRESENTATION OUTLINE

OPERATIONAL REVIEW
Pieter Engelbrecht

FINANCIAL RESULTS
Anton de Bruyn

STRATEGY UPDATE
QUESTIONS
Pieter Engelbrecht
2021
OPERATIONAL
  REVIEW
  Chief Executive Officer
PIETER ENGELBRECHT

UNWAVERING COMMITMENT TO CUSTOMERS
UNWAVERING COMMITMENT TO CUSTOMERS
Proud of our team’s display of agility and resilience in challenging trading environment
  •   530 days of new COVID-19 protocols since first lockdown
  •   Liquor sales increased despite trading bans and restrictions
  •   148 stores re-opened in record time after unrest

Shoprite Jabulani rebuilt and reopened in just 14 days
                                                                     Usave mobile stores sent to impacted areas
                                                                     to serve customers in need
UNWAVERING COMMITMENT TO CUSTOMERS
2021 THE GROUP IN REVIEW

      SALES                                  GROSS PROFIT                     TRADING PROFIT

R168.0bn R41.2bn                                                             R10.3bn
  +8.1%                R12.6bn               +10.6%                             +24.9%
 +5.9% Like-for-like   in additional sales   24.5% Gross margin                6.1% Trading margin

 TOTAL EXPENSES                                 DHEPS                        DIVIDEND PER SHARE
                                        CONTINUING OPERATIONS

R34.0bn                                      952.5c                            544.0c
   +6.7%                                     +20.1%                Record
                                                                  dividend        +42.0%
                                                                                   1.75X DHEPS cover
                                                                               from continuing operations
2021 SUPERMARKET RSA HIGHLIGHTS
FEWER, LARGER       HIGHER           PROFITABLE
SHOPPING TRIPS     VOLUMES        MARKET SHARE GAIN

+13.6%
BASKET GROWTH
                 +3.2%
                 VOLUME GROWTH
                                  +R4.5bn
                                    MARKET SHARE GAIN
                                      (NielsenIQ, 2021)

                 +178m                    28
-3.8%
    VISITS         ADDITIONAL
                                 MONTHS OF UNINTERRUPTED
                                   MARKET SHARE GAIN
                 PRODUCTS SOLD        (NielsenIQ, 2021)

                                                    SUPERMARKETS RSA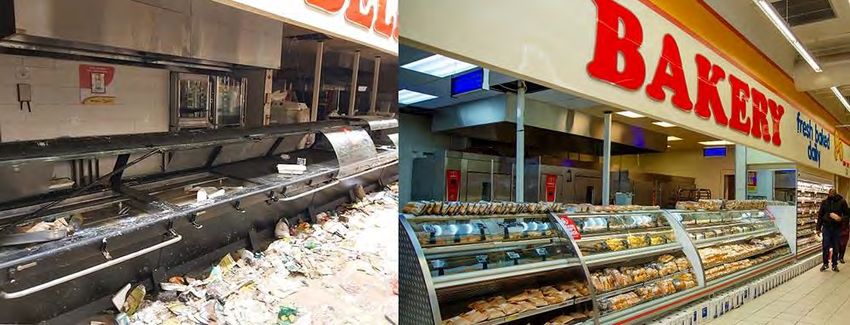
SUPERMARKETS RSA
●   Strong Supermarkets RSA sales momentum despite liquor trade disruptions:
     ○   +9.3% for 53 weeks (52 weeks: 6.9%)
     ○   Like-for-like sales +7.3% (52 weeks: 4.9%)
●   Benefitted from customer behaviour shifts:
     ○   Better value, better range and better stock availability
     ○   More accessible locations and leading online experience
●   Shielded customers from price increases
     o   Internal price inflation of 3.8% below official food inflation of 5.4%

                       4.3%
                                  3.4%
                                                                                   9.3%
                                                                                  SUPERMARKETS RSA
                                                                                    SALES GROWTH

                         H1         H2
            Supermarkets RSA internal price inflation
SUPERMARKETS RSA
• Sales growth outpaced Rest of Market over 8 consecutive quarters
Rest of Market Supermarkets RSA
15%
5%
0%
Q1 Q2 Q3 Q4 Q1 Q2 Q3 Q4 +0.94%
ANNUAL RSA MARKET
-5% 2019/20 2020/21 SHARE GAIN
(NielsenIQ, June 2020 - July 2021)
Supermarkets RSA sales growth vs Rest of Market (incl. liquor)
Source: NielsenIQ, July 2019- June 2021
NielsenIQ Rest of Market: Pick n Pay (Super, Family, Mini, Hypermarket), Boxer, Clicks,
Woolworths, Dis-Chem, Fruit & Veg City, Game, Spar, OK Foods, PEP, JetmartSUPERMARKETS RSA
Brand portfolio effect – each of our supermarket brands gained market share
Gained share on top of commanding base during lockdown
Improved sales at 2x the pace of other retailers (NielsenIQ, 2021)
Leading our gains notwithstanding some pantry loading last year
Continued to benefit from larger basket behaviour
314%
287%
257%
109%
REST OF MARKET
H1 H2 H1 H2
Supermarkets RSA indexed sales growth vs Rest of Market (incl. liquor)
NielsenIQ, July 2020 - June 2021GROSS MARGIN: SUPERMARKETS RSA
● Higher margin achieved whilst maintaining price leadership
o Internal price inflation slowed in H2
● Higher Checkers contribution and positive volume growth
● Strong team collaboration achieved end-to-end operational excellence
o Improved supply chain efficiencies achieved
o More effective promotions through Xtra Savings Rewards
o Tightly managed wastage and shrinkage
o Ongoing benefits from SAP ERP re-platformingLIQUORSHOP RSA PERFORMANCE
Liquor sales +4.4%
● Positive sales growth despite 20.3% fewer customer visits
● 144 trading days lost
● +2.5% market share gain in RSA (NielsenIQ, 2021)
● Online sales growth increased 151%
53.6%
+37
Net new stores
opened
H1 H2
-21.8%
LiquorShop RSA sales growth on prior year:
H1 vs H2SUPERMARKETS NON-RSA PERFORMANCE
• Supermarkets Non-RSA sales declined 7.5% (Continuing operations)
○ Currency devaluations, COVID-19 regulations and trading challenges
• Offset by a fourfold increase in trading profit to R307m (Continuing operations)
o Goal of a more manageable core group of countries largely achieved
o Nigeria sale (R441m proceeds received to date) and Kenya divestment concluded
o Madagascar and Uganda classified as held for sale
• Constant currency sales increased 6.8% (Continuing operations)
o Zambia sales +25.2%
• Angola sales declined 37.2% (Kwanza devalued 32.8% against Rand)
• No significant disposals or exits expected short-medium term
• Strict capital allocation continued and remains self-fundingFURNITURE & OTHER OPERATING SEGMENTS
Furniture Other operating
segment sales
+24.6% segments sales +10.0%
R6.8bn R11.9bn
Once-off demand for home improvement after lockdown: ● OK Franchise sales remained resilient +8.2%
● Like-for-like sales increased 13.5% (H1: 17.3%, H2: 7.3%*) o Total 513 stores (opened net 36 stores)
● Segment returned to profitability ● Transpharm and Medirite sales increased 17.2%
● Total 426 stores (closed net 16 stores)
● Impacted by COVID-19 restrictions
o Checkers Food Services (hospitality industry)
o Computicket (travel and event ticketing)
*27 weeks vs. 26 weeksWORKING TOGETHER FOR A SUSTAINABLE FUTURE
2021
FINANCIAL
 RESULTS
 Chief Financial Officer
ANTON DE BRUYN
RESTATEMENTS SINCE JUNE 2020
                                                                JUNE 2021                                                                 JUNE 2020*
IFRS 5: NON-CURRENT                       ●     Classify the Group’s Kenya, Uganda and                              ●     Comparative statement of comprehensive
ASSETS HELD FOR SALE                            Madagascar subsidiaries as discontinued                                   income restated for newly classified
AND DISCONTINUED                                operations                                                                discontinued operations during 2021 (refer to
                                                                                                                          note 2 of the condensed consolidated
OPERATIONS
                                          ●     Statement of comprehensive income                                         financial statements)
                                                reflects profit/(loss) from discontinued                                                                        June 2020 *
                                                                                                                                                        Restatement impact
                                                operations separately
                                                                                                                                                                       Rm

                                          ●     Assets and liabilities relating to the                             Sale of merchandise                            ( 1 446)
                                                Madagascar and Uganda discontinued                                 Gross profit                                      (268)
                                                operations classified as held for sale                             Net expenses                                       369
                                                                                                                   Trading profit                                     101
                                                                                                                   Exchange rate gains                                 11
                                                                                                                   Items of a capital nature                          261
                                                                                                                   Operating profit                                   373
                                                                                                                   Finance costs                                       32
                                                                                                                   Profit before income tax                           405
                                                                                                                   Income tax                                           9
                                                                                                                   Profit from continuing operations                  414

* Restated for newly classified discontinued operations in accordance with IFRS 5: Non-current Assets Held for Sale and Discontinued Operations
FINANCIAL OVERVIEW
Restated* Change
Continuing operations 2021 2020 % Notes to the results:
Sale of merchandise R168.0bn R155.4bn 8.1 Gross margin:
55 basis points increase in gross margin due to a
Gross margin 24.5% 24.0% combination of contribution mix, improved operational
execution, impact of the Xtra Savings Rewards Programme
Other operating income R2.6bn R2.3bn 13.6 and Non-RSA change to local product sourcing
Interest revenue R0.5bn R0.6bn (9.4) Other operating income increase mainly due to increased
premiums and insurance cell income, media services
Total expenses R34.0bn R31.9bn 6.7 relating to advertisers and increased delivery recoveries
Trading profit R10.3bn R8.3bn 24.9 from Checkers Sixty60 and Furniture
Trading margin 6.1% 5.3% Interest revenue declined due to government bonds and
bills maturing during the year
Exchange rate (losses)/gains (R0.0bn) R0.6bn (>100)
Expense growth 6.7% (H1: 4.3%, H2: 9.2%):
Items of a capital nature (R0.8bn) (R0.8bn) 4.3 ● excluding COVID-19 costs +7.1%
(2021: R234m; 2020: R327m)
EBITDA R15.1bn R12.9bn 17.4 ● employee benefits +8.5%
● other operating expenses +7.0%
Effective tax rate 32.2% 31.4% ● depreciation and amortisation +7.3%
DHEPS 952.5c 793.4c 20.1 Exchange rate losses for 2021 limited to R27m
Adjusted DHEPS 883.8c 732.5c 20.7 Items of a capital nature include R1.1bn of impairments of
which R477m pertains to hyperinflation adjustments
Dividend 544.0c 383.0c 42.0
ROIC 12.4% 9.7% Adjusted DHEPS excludes the impact of exchange rate
differences, hyperinflation and lease modifications and
* Restated for newly classified discontinued operations in accordance with IFRS 5: Non-current Assets Held for Sale and terminations and related tax effects
Discontinued OperationsDHEPS
Restated*
2021 2020 Change
cents cents %
DHEPS continuing operations previously reported 765.8
Restated for IFRS 5: Discontinued operations 27.6
DHEPS continuing operations 952.5 793.4 20.1
DHEPS discontinued operations 20.7 (37.7) >100
DHEPS including discontinued operations 973.2 755.7 28.8
DHEPS continuing operations 952.5 793.4 20.1
Adjusted for:
Forex 4.8 (104.0) >100
Hyperinflation 8.8 27.8 (61.8)
Lease modifications and terminations (33.7) (12.5) >100
Related income tax effect (48.6) 27.8 (>100)
Adjusted DHEPS from continuing operations 883.8 732.5 20.7
* Restated for newly classified discontinued operations in accordance with IFRS 5: Non-current Assets Held for Sale and Discontinued OperationsSALES GROWTH PER SEGMENT
Total Like-for- Net new Total
sales like stores sales
53 weeks 53 weeks 53 weeks 52 weeks Supermarkets RSA
% % % % Brand contribution and sales growth
Supermarkets RSA 9.3 7.3 2.0 6.9
Restated Supermarkets Non-
R7.4bn AND OTHER
RSA* (7.5) (8.7) 1.2 (9.5) Contribution: 5.5%
Sales growth: 4.2%
Furniture 24.6 13.5 11.1 22.1
Other operating segments 10.0 9.4 0.6 9.2
Total continuing operating
segments 8.1 5.9 2.2 5.9
* Restated for newly classified discontinued operations in accordance with IFRS 5: Non-current Assets Held for Sale and
Discontinued Operations R53.8bn R72.6bn
Contribution: 40.2% Contribution: 54.3%
Sales growth: 10.9% Sales growth: 8.8%TRADING PROFIT BY SEGMENT
Trading
Change margin
2021 2020 53 weeks 2021
Rm Rm % %
Supermarkets RSA 9 401 8 024 17.2 7.0
Restated Supermarkets Non-RSA* 307 73 >100 2.0
Furniture 382 (15) >100 5.6
Other operating segments 291 316 (7.9) 2.4
Total continuing operating segments 10 381 8 398 23.6 6.2
Hyperinflation effect (49) (126) 61.1 -
Total continuing operations 10 332 8 272 24.9 6.1
* Restated for newly classified discontinued operations in accordance with IFRS 5: Non-current Assets Held for Sale and 52 Weeks 52 Weeks
Discontinued Operations
+20.9% +6.1%NET FINANCE COSTS
Previously
reported
2021 2020* 2021 2020
Rm Rm Net finance
costs cover 18.3x 15.3x
Interest received from bank account Finance
costs cover 10.4x 8.4x
balances 268 443
Covenants well within bank limits
Finance cost: borrowings ( 624) ( 966) of 5.0x and 3.5x respectively
Finance cost: lease liabilities ( 2 471) (1 912)
Net finance costs Includes once-off
breakage cost of
(2 827) (2 435) DEFINITION:
Finance costs cover (excluding
* Restated for newly classified discontinued R178m paid on early impact of IFRS16)
operations in accordance with IFRS 5: Non-current settlement of $250m (EBITDA/FINANCE COSTS)
Assets Held for Sale and Discontinued Operations
fixed interest rate loanBALANCE SHEET COMPOSITION
Rbn
BORROWINGS AS % OF EQUITY
100%
82.7 77.1 2021: 24.9%
Other assets 11.1 10.9 62.7
2020: 60.1%
90% 55.9
2.1 5.1 Other liabilities
80%
Trade and other TRADE AND OTHER PAYABLES
Inventories
70% 18.8 18.4 19.6 20.2
payables
2021: R19.6bn
2020: R20.2bn
60%
Cash and cash equivalents
Borrowings and
and loans receivable 14.3 9.9 6.5 14.1
50%
bank overdraft -2.5%
Intangible assets 3.0 3.0
40%
30%
GOVERNMENT BONDS AND BILLS
Property, plant and equipment 18.3 14.4 (Included in other assets)
20% 2021: R1.5bn
10%
2020: R2.5bn
Right-of-use assets 17.2 20.5 27.7 23.3 Lease liabilities
-40.3%
0%
2020
Assets 2021
Assets 2021
Liabilities 2020
Liabilities
Assets Assets Liabilities LiabilitiesCAPITAL EXPENDITURE
LAND, BUILDINGS AND CAPITAL SPEND
IT LEASEHOLD IMPROVEMENTS
2021: R3.2bn
23.2% 9.3% 2020: R3.2bn
(2020: 19.6%) (2020: 18.7%)
-0.3%
RSA
STORE R3.0bn
MAINTENANCE AND (2020: R2.5bn)
REFURBISHMENTS
37.8% NON-RSA
SUPPLY CHAIN (2020: 41.0%)
R0.2bn
6.1% (2020: R0.7bn)
(2020: 8.2%)
CAPITAL SPEND AS % OF LAST 12
NEW STORES MONTHS SALES (52 WEEKS)
23.6% 2021: 2.0%
(2020: 12.5%)
2020: 2.1%
2022 GUIDANCE: R4.8bn
Lag effect R0.5bn
TOTAL OPERATIONS POS upgrade R0.3bnINVENTORIES
INVENTORIES
SUPERMARKETS RSA SUPERMARKETS NON-RSA 2021: R18.4bn
R14.4bn R1.8bn 2020: R18.8bn
(2020: R13.9bn) (2020: R2.8bn)
R0.4bn↓
FURNITURE
-2.4%
R1.6bn
(2020: R1.5bn)
INVENTORIES AS % OF SALES
OTHER OPERATING (52 weeks)
SEGMENTS 2021 2020
R0.6bn Inventory % of sales % %
(2020: R0.6bn) Supermarkets RSA 11.0 11.4
Supermarkets Non-RSA * 12.0 16.8
Furniture 24.4 27.3
Other operating segments 4.8 5.9
Total 11.2 12.1
* 2020 sales restated for newly classified
discontinued operations in accordance with
IFRS 5: Non-current Assets Held for Sale and
Discontinued Operations
2021 TARGET: 12.0%
2022 GUIDANCE: 11.5%NET GEARING
NET CASH/(BORROWINGS)
2021: R1.5bn
2021 2020 2020: -R2.0bn
Rm Rm >100%
Total cash position 6 729 10 019 USD BORROWINGS
2021: US$68m
Borrowings (5 279) (12 009) 2020: US$433m
-84.3%
Net cash position/(borrowings) 1 450 (1 990)
TOTAL CASH POSITION
Lease liabilities (27 722) (23 271) Reflects R5.9bn paid before year-
end relating to trade payables,
income tax and VAT for
Net debt (26 272) (25 261) Supermarkets RSA
SHARE BUY-BACK
JUNE 2021: R0.5bn2021 CASH FLOW STATEMENT
Rbn
Rbn
Net cash decrease (2.4)
+ Net borrowings repaid 5.9
+ Trade payables and tax due to cut-off 5.9
- Capex underspend (1.6)
Includes proceeds on - Proceeds from disposals (2.1)
disposal of PPE,
Normalised cash increase 5.7
intangible assets,
discontinued
16.1 operations and assets
classified as held for
sale
(2.3)
(2.3)
8.0 0.6 7.4
2.1
(3.5) Includes share buy-
(0.1) back of R0.5bn
(3.2)
(5.9)
(3.2)
(0.7) (2.4)
Cash Net Net Income Cash Capex Proceeds Net Other Cash flow Net Lease Treasury Net
generated interest dividends tax from from proceeds increase borrowings liabilities shares cash
from paid paid paid operating disposals from before repaid repaid purchased decrease
operations activities government financing
bonds and activities
bills
TOTAL OPERATIONSPOST BALANCE SHEET EVENT
231
Total stores
closed on Burnt Looted
22 Aug 2021 stores stores
Checkers Hyper 2 2 -
Total stores Shoprite 19 15 4
Impacted by looting/fire 23 17 6
148
Usave
Liquire 19 3 16
Furniture 17 9 8
KwaZulu-Natal & Gauteng OKFD 3 1 2
Stores open by 22 August 2021
Protest action 9-14 July 2021 TOTAL 83 47 36
2022 IMPACT INSURANCE CLAIM
Number of Trading stores
Sales 2022 interim results will reflect an insurance
(Impact of event, stores closed on precautionary claim which will cover:
basis and burnt stores not yet open)
Capital expenditure
Additional security costs
Stock losses
Additional wastage costs
Loss of profit
July August
Staff costs in impacted stores
Loss of rental
Jul 2021CAPITAL ALLOCATION CONSIDERATIONS
COMPLETED IN PROGRESS
WORKING CAPITAL ✓ Inventory reduction – target achieved ● Inventory remains a focus area
● FY22-25 Inventory to sales target: 11.0% -
11.5%
BORROWINGS ✓ US dollar borrowings reduced by ● Remaining US$68m balance remains in
US$365m to US$68m place for Non-RSA trade funding
CAPITAL SPEND ✓ Sale and leaseback of DC’s in exchange ● Rebuilding our stores impacted by KZN
for cash and 49.9% share in Retail and central Gauteng unrest
Logistics Fund (RF) (Pty) Ltd completed ● Capital spend FY22 target: R4.8bn
✓ Medium-term capex target achieved including R0.5bn relating to impact from
delayed expenditure
CAPITAL ALLOCATION ✓ Non-RSA actions: ● Non-RSA review nearing completion, no
✓ Nigeria sale successfully concluded further material changes expected short-
✓ Kenya closure term
✓ Madagascar and Uganda disposal ● Share buy-back authorised. Going
forward will depend on share price
● Acquisitions – announced Masscash Cash
& Carry, Cambridge Food & MassfreshSTRATEGY UPDATE Chief Executive Officer PIETER ENGELBRECHT
STRATEGY REMAINS FUTURE-FIT
Investing in a ‘Smarter Shoprite’ with a focus on optimising our core retail capabilities in existing markets

                                                                                       -
A TRULY CUSTOMER-FIRST CULTURE
• Fastest growing rewards programme: 20m+ Xtra Savings members, ahead of expectations
• Customer insights from 1 500 swipes per minute powering a “Smarter Shoprite”
• Shifting focus to long-term customer lifetime value
CUSTOMER HEARTBEAT
20+
Million members
R5.3bn
Instant savings back
to customers
Unique Customer shopping patterns over timeDEVELOP FUTURE-FIT CHANNELS
Formats and channels that are responsive to rapidly changing customer needs
SMALLER FORMATS LOW COST,
CHECKERS FRESH ONLINE MICRO
CLOSER TO HOME ACCESSIBLE
FOOD THEATRE FULFILMENT
42 FreshX Stores (80 target) ALTERNATIVESDEVELOP FUTURE-FIT CHANNELS
Investing in Digital Channels in the Race For Reach
15m
Monthly reach on
digital channels
RACE
FOR
81m REACH
Monthly supermarket
store visitsDEVELOP FUTURE-FIT CHANNELS
• Strong performance from Checkers Sixty60: Award-winning 1hr grocery delivery innovation
• No.1 grocery delivery app in SA: 1.5m app downloads
• Leading the Quick Commerce revolution :1.5m of the orders delivered in under 30min
• Live in 233 sites and fully integrated into operations and supply chain machine
• Increased choice: 17k products at in-store pricing
• Sixty60 supports new job creation totaling 3 584 opportunities to date
Weekly Orders DeliveredENABLE PRECISION RETAILING
~1 200 CATALOGUE PROMOTIONS → PERSONALISED VALUE
+750m
Personalised offers
Checkers Xtra SavingsCLOSING THE GAP IN KEY SEGMENTS
HEADROOM IN FRESH,
TRUSTED, PROFITABLE UPMARKET CHOICE &
CONVENIENCE AND
PRIVATE LABELS FOOD PARTNERSHIPS
WELLNESS
Super premium Forage &
Continued Fresh share gains: Feast range launched with
R204m Michelin Star Chef Jan
18.3%
(Checkers and Hyper, 12m NielsenIQ )
17.1%
Simple Truth doubled sales
Food Partnerships
2020 2021
Supermarkets RSA private label New free-range, plant-based
sales participation and eco-friendly productsNINE STRATEGIC
UNLOCKING FOCUS AREAS
ALTERNATIVE REVENUE
• Investing in digital and media revenue
• Expanded value-added services for customersWINNING IN THE LONG-TERM
Meet ShopriteX
• Digital innovation hub accelerating digital transformation
• Fusing the best of data, tech and talent for a Smarter Shoprite
• Co-located with Group IT in purpose-built offices
• Building precision retail capabilities for future growth:
o E-commerce and digital customer experience
o Data science and customer insights
o Personalisation and promo effectivenessFUTURE-FIT TALENT • Largest private employer in SA • 142 602 team members, created 3 897 new jobs • No. 1 Graduate Employer of Choice (SAGEA) • Highest impact employment creator through the Yes programme • Equipping retail teams to thrive in new retail landscape
LEVERAGE PLATFORM ADVANTAGE
                                         Shoprite’s right to win

Largest customer           17 powerful and                    Unbeatable
                                                                                       Unrivalled supply
        base                trusted brands                proximity advantage:
                                                                                       chain know-how
~1 billion transactions    Shoprite “Brand of the             2 898 stores
                           decade” (Sunday Times, 2021)   80% of the population live
                          Checkers “Most Admired           within 5km of one of our
                             brand” (MarkLives, 2021)               stores
LEVERAGE PLATFORM ADVANTAGE Growing our ecosystem of value for customers
OUTLOOK
•   Non-RSA actions taken are expected to sustain the segment’s profitability
•   RSA internal price inflation 3.9% for month of July 2021
•   Supermarkets RSA trading remains ahead of internal inflation despite unrest impact
•   Unaffected stores maintaining good momentum and volume growth
•   Furniture sales impacted by unrest and high post lockdown base in Q1 2021
•   MassCash C&C, Cambridge Foods and MassFresh assets will be a valued addition to the RSA business
•   Our business remains highly cash generative and in a strong financial position
•   Actively assessing RSA acquisitions/partnerships fit for our ecosystem
•   We are optimistic about our opportunities and our digital and consumer momentum
QUESTIONS
2021
 ADDITIONAL
INFORMATION
  Chief Financial Officer
 ANTON DE BRUYN
DISCONTINUED OPERATIONS

                                      KENYA
                                      Last store closed Jan 2021
                                      Profit after tax: R10m

NIGERIA                               UGANDA
                                      Sale of assets
Effective date 23 May 2021
                                      Estimated transfer H1 2022
Selling price: R531m
                                      Loss after tax: R21m
Cash received to date: R441m
Receivable in 4 instalments over 29
months: R90m
Profit on sale: R21m
                                      MADAGASCAR
                                      Sale of assets
                                      Estimated transfer H2 2022
                                      Loss after tax: R8m
2021 ADJUSTED DHEPS RECONCILIATION
Headline
earnings DHEPS*
Rm cents
Headline earnings including discontinued operations 5 391 973.2
Headline earnings discontinued operations ( 115) (20.7)
Headline earnings continuing operations 5 276 952.5
Adjusted for:
Forex 27 4.8
Hyperinflation 49 8.8
Lease modifications and terminations ( 187) (33.7)
Related income tax effect ( 270) (48.6)
Adjusted headline earnings from continuing operations 4 895 883.8
*DHEPS based on 553 855 521 weighted average number of ordinary shares adjusted for dilutionFOREX
Rm
LOSS GAIN 2021: R27m loss
-400 -300 -200 -100 0 100 200 300
2020: R577m gain
1 374
Government
Government bonds
bonds and bills and bills 209
● R876m invested in
AOA, USD Index Linked,
-843 Angola Government
Current
Current intercompany
intercompany loan accounts
loan accounts -279 Bonds forming a natural
hedge
Cash balances
● Hedging strategy for
Cash balances 2
Non-RSA was effective
● Net investment hedge
Sundry Sundry 41
accounting
commencing in 2020
was effective
2021 Exchange rate losses/gains (Rm)ITEMS OF A CAPITAL NATURE
2021 2020*
Rm Rm Notes to the results:
Impairment of PPE (860) (455) Non-financial asset
impairments/(impairment 2021
reversals) by segment Rm
Impairment of right-of-use assets (198) (448)
Supermarkets RSA 125
Impairment of intangible assets (30) (99) Supermarkets Non-RSA 497
Non-financial asset impairments (1 088) (1 002) Furniture (38)
Other 27
Profit on sale and leaseback transaction 160 -
Total operating segments 611
Profit on disposal of assets held for sale 131 239
Hyperinflation effect 477
Loss on disposal and scrapping of PPE and
intangible assets (130) (91) Consolidated continuing
operations
1 088
Other 99 60 * Restated for newly classified discontinued
operations in accordance with IFRS 5: Non-
Total (828) (794) current Assets Held for Sale and Discontinued
OperationsRETURN ON AVERAGE INVESTED CAPITAL (ROIC)
2021 2020 2019
Rm Rm Rm
Trading profit from continuing operations 10 332 8 272
Effective tax rate at year-end 32.2% 31.4%
Trading profit after tax 7 004 5 675
Invested capital
-843 55 426 57 369 59 515
Net asset value 21 204 19 994 22 207
Borrowings 5 279 12 009 11 706
Lease liabilities 27 722 23 271 21 478
Bank overdraft 1 221 2 095 4 124
Average invested capital 56 398 58 442
ROIC 12.4% 9.7%ASSETS AND CAPITAL SPEND
TOTAL OPERATIONS
Rm 1 400 1 321 -38.8%
1 400 1 2171 321
1 200 1 217
1 200
1 000
1 000
800 746 761
800 746634 761
604
600 634 604
600 403
400 403 299
400 299 268
196
268
200 196
200
0
0
Information technology New Stores Store maintenance Land, buildings and Supply chain
Information technology New Stores Store maintenance Land, buildings and Supply chain
leasehold
leasehold
improvements
improvements
2021 capital spend 2020 capital spend
R3 219m R3 230mEXCHANGE RATE EXPOSURE
Zambia kwacha Angola kwanza Mozambique metical
2021 2020
vs vs
2020 2019
20.0%
5.1%
0.0%
ZAR ave 2021 VS 2020 (9.0%)
ZAR Average rates -20.0% (15.5%)
ZAR ave 2020 VS 2019
-40.0% 8.5% 11.1%
(41.9%) (39.2%) (39.3%)
-60.0%
-10.7%
-15.8% 20.0%
8.5%
0.0%
ZAR closing 2021 VS 2020
-20.0% (10.6%)
ZAR closing
ZAR 2020
closing VS 2019 -40.0%
rates
(15.8%)
-41.2%
-40.0% (32.8%)
(41.2%)
-60.0% (48.2%)
20.0% 6.5%
-70.8%
0.0%
USD closing 2021 VS 2020 -20.0% (12.2%) (10.7%)
USD closing rates (25.2%)
USD closing 2020 VS 2019 -40.0%
(40.0%)
-60.0%
-80.0% (70.8%)You can also read