Premium packaging solutions - Alu Flex Pack IR

Page created by Shirley Pena
 
CONTINUE READING
Premium packaging solutions - Alu Flex Pack IR
Premium packaging solutions

                              1
Premium packaging solutions - Alu Flex Pack IR
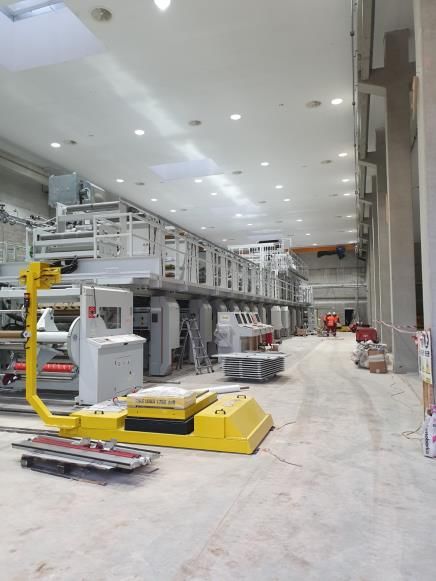
Aluflexpack AG
Half year 2019 results

02 September 2019
Premium packaging solutions - Alu Flex Pack IR
Disclaimer

The information contained in this presentation is not for use within any country or jurisdiction or by any persons where such use would constitute a violation of law. If this applies to you, you are not
authorized to access or use any such information. The presentation may not be reproduced, published or transmitted, in whole or in part, directly or indirectly, to any person (whether within or outside
such person’s organization or firm) other than its intended recipients.

The attached information is not an offer to sell or a solicitation of an offer to purchase any security in the United States or elsewhere and shall not constitute an offer, solicitation or sale any securities of
Aluflexpack AG (Aluflexpack, Group) in any state or jurisdiction in which, or to any person to whom such an offer, solicitation or sale would be unlawful nor shall it or any part of it form the basis of, or be
relied on in connection with, any contract or investment decision. No securities may be offered or sold within the United States or to U.S. persons absent registration or an applicable exemption from
registration requirements. Any public offering of securities to be made in the United States will be made by means of a prospectus that may be obtained from any issuer of such securities and that will
contain detailed information about us. Any failure to comply with the restrictions set out in this paragraph may constitute a violation of the securities laws of any such jurisdiction. This presentation is not
an offering circular within the meaning of article 652a of the Swiss Code of Obligations, nor is it a listing prospectus within the meaning of the listing rules of the SIX Swiss Exchange or a prospectus
under any other applicable laws.

This presentation may contain “forward-looking statements” that are based on our current expectations, assumptions, estimates and projections about us and our industry. Forward-looking statements
include, without limitation, any statement that may predict, forecast, indicate or imply future results, performance or achievements, and may contain the words “may”, “will”, “should”, “continue”, “believe”,
“anticipate”, “expect”, “estimate”, “intend”, “project”, “plan”, “will likely continue”, “will likely result”, or words or phrases with similar meaning. Undue reliance should not be placed on such statements
because, by their nature, forward-looking statements involve risks and uncertainties, including, without limitation, economic, competitive, governmental and technological factors outside of the control of
Aluflexpack AG (Aluflexpack, Group), that may cause Aluflexpack’s business, strategy or actual results to differ materially from the forward-looking statements (or from past results). Nothing contained in
this presentation is or should be relied upon as a promise or representation as to the future. It is up to the recipient of the presentation to make its own assessment as to the validity of such forward-
looking statements and assumptions.

The information contained in the presentation does not purport to be comprehensive. Aluflexpack undertakes no obligation to publicly update or revise any information contained herein or forward-
looking statements, whether to reflect new information, future events or circumstances or otherwise. It should further be noted, that past performance is not a guide to future performance. Please also
note that interim results are not necessarily indicative of the full-year results. Persons requiring advice should consult an independent adviser. Some financial information in this presentation has been
rounded and, as a result, the figures shown as totals in this presentation may vary slightly from the exact arithmetic aggregation of the figures that precede them. While we are making great efforts to
include accurate and up-to-date information, we make no representations or warranties, expressed or implied, and no reliance may be placed by any person as to the accuracy and completeness of the
information provided in this presentation and we disclaim any liability for the use of it. Neither Aluflexpack nor any of its directors, officers, employees, agents, affiliates or advisers is under an obligation
to update, correct or keep current the information contained in this presentation to which it relates or to provide the recipient of it with access to any additional information that may arise in connection
with it and any opinions expressed in this presentation are subject to change.

In this presentation, we utilise certain alternative performance measures, including EBITDA, adjusted EBITDA, adjusted Operating Profit, organic growth, Working Capital ratio, and others that in each
case are not recognized under International Financial Reporting Standards (“IFRS”). These non-IFRS measures are presented as we believe that they and similar measures are widely used in the
markets in which we operate as a means of evaluating a company’s operating performance and financing structure. They may not be comparable to other similarly titled measures of other companies
and are not measurements under IFRS or other generally accepted accounting principles, nor should they be considered as substitutes for the information contained in the financial statements included
in this presentation. For a particular definition of any of the mentioned and non-mentioned alternative performance indicators please see either notes in this presentation or definitions in our HY2019
interim financial statement.

By receiving this Presentation, you agree to be bound by the foregoing limitations. Any failure to comply with these restrictions may constitute a violation of applicable securities laws.
This Presentation does not constitute investment, legal, accounting, regulatory, taxation or other advice.
THIS PRESENTATION IS NOT AN INVITATION TO PURCHASE SECURITIES OF ALUFLEXPACK AG OR THE GROUP.

                                                                                                                                                                                                                      3
Premium packaging solutions - Alu Flex Pack IR
Executive summary
Half year 2019 results

                          H1 2019 net sales increased 18.9% to € 101.3m, organic net
  Strong growth in net
                          sales growth reached 10.6% on the back of strong demand
  sales
                          across all end markets

                          Increase in adjusted EBITDA by 25.5% to € 14.0m from € 11,1m
  Further improvement
                          and in adjusted EBITDA margin from 13.1% to 13.8% underlines
  of result
                          focus on sustainable growth

                          Capital expenditure of € 17.0m directed to our stand-up pouch
  Investments in future   business and to additional capacities for our coffee, pharma,
                          confectionery and dairy end markets

                          All machines have been cleaned, start-up of affected machines
  Business as usual at    initiated, no material interruption of deliveries occurred, damage
  Eliopack                expected to be completely covered by existing insurance

                          Net sales for the full year 2019 expected between € 200m and €
  Guidance                210m. Full year adjusted EBITDA margin expected to be at a
                          level similar to H1 2019
                                                                                               4
Financial Highlights
Growth of 18.9% in H1 2019, thereof 10.6% organic

Net sales                                        Net sales – geographical split
(in €m)                                          (H1 2019)

                                                                                26%                     28%

                     181.7
             160.6
     144.1                                                                 7%

                                                                            7%                          15%
                                       101.3                                          8%
                                                                                             9%
                              85.2

                                                             France                           Germany
                                                             Switzerland and Liechtenstein    Croatia
                                                             Netherlands                      Turkey
                                                             Other
     2016    2017    2018    H1 2018   H1 2019

                                                                                                              5
Financial Highlights
Improvement of adj. EBITDA to € 14.0m, margin to 13.8%

 Adj. EBITDA                                                                                                                                    Adj. Operating Profit (EBIT)
 (in €m / margin in % of net sales)(1)                                                                                                          (in €m / margin in % of net sales)(2)

        10.0%                    11.3%                      11.9%                   13.1%                     13.8%                                  2.3%                      3.7%                      4.4%                      5.2%                        6.4%

                                                            21.6

                                   18.1

          14.4                                                                                                 14.0
                                                                                      11.1
                                                                                                                                                                                                          8.0
                                                                                                                                                                                5.9                                                                             6.5
                                                                                                                                                                                                                                    4.4
                                                                                                                                                      3.3

          2016                     2017                     2018                   H1 2018                  H1 2019                                  2016                      2017                      2018                    H1 2018                  H1 2019

  Drivers
  • Economies of scale, cost positions growing slower than top line
  • Efficiency improvements across organisation
  • Improved product mix

Notes: PARTLY UNAUDITED AND SUBJECT TO CHANGE; (1) Adjustments in 2018 include to voluntary one-off bonuses to management paid by the majority shareholder in the amount of € 1,9m, adoption of a pension plan in the amount of € 0,8m
and gains on the sale & lease back transaction in the amount of € 2,7m; adjustments in H1 2018 include to voluntary one-off bonuses to management paid by the majority shareholder in the amount of € 1,9m; adjustments in H1 2019 include
transaction cost for the initial public offering in the amount of €2,6m, voluntary one-off bonus payment to management by the majority shareholder in the amount of € 8.0, expenses in relation to the fire incident in the amount of € 2,5m and income in
relation to the fire incident in the amount of € 3,3m. (2) In addition to the factors mentioned in (1), adjustments include acquisition related amortizations of € 1.6m in 2016, € 1,6m in 2017, € 1,6m in 2018 and € 0.8m in H1 2018, € 1.0m in H1 2019 and          6
impairments in relation to the fire incident in the amount of € 0.8m.
Profit and Loss statement - overview
First six months 2019

           (in T€)                                                                                              H1 2019         H1 2018   DELTA (%)
                                                                                                                                                      Comments
           Net Sales                                                                                            101,319         85,209      18.9
                                                                                                                                                      •   Improvement in adj. EBITDA
           Adjusted EBITDA(1)                                                                                    13,979         11,138      25.5          margin to 13.8% on the back
                                                                                                                                                          of economies of scale,
           Adjusted EBITDA margin                                                                                 13.8%         13.1%                     efficiency gains and product
                                                                                                                                                          mix
           Adjusted Operating Profit (EBIT)(1)                                                                     6,482         4,419      46.7
                                                                                                                                                      •   Increase in adj. Operating
           Adjusted Operating Profit margin                                                                        6.4%          5.2%                     Profit (EBIT) to € 6.5m
                                                                                                                                                          proves that investments into
           Financial result                                                                                       -2,226        -1,470                    platform pay off

           Result before tax                                                                                      -7,284         270                  •   Financial result decreased to
                                                                                                                                                          -€ 2.2m in H1 2019 mainly
           Result for the period                                                                                  -7,953         371                      due to increased IC loans

                                                 o/w owners of the company                                        -7,863         335                  •   Due to one-off items,
                                                                                                                                                          amongst others in relation to
                                                o/w non-controlling interests                                        -90          36                      the listing on the stock
                                                                                                                                                          exchange, result for the
                                                                                                                                                          period decreased to -€ 8.0m

Notes: (1) A detailed reconciliation between reported and adjusted numbers can be viewed in the appendix of this presentation

                                                                                                                                                                                          7
Cost management
Improvement in material costs and other operating costs margins

     Material Costs                                                                                                                        Adj. Other operating costs
                                                                                                                            75.0%                                                                                                                         33.0%
     (in €m / in % of net sales)(1)                                                                                                       (in €m / in % of net sales)(2)
                                                                                                                                          200
  200
                                                                                                                                                                                                                                                          28.0%
                                                                                                                            70.0%         150
  150
               65.4%                                                                                                                                                                                                                                      23.0%
                                                    64.5%
                                 63.5%                                                   63.1%             63.1%            65.0%         100
  100
                                                                                                                                                                                                                                                          18.0%

                                                    117.3                                                                   60.0%           50         12.4%             12.6%             12.2%                                12.4%
    50          94.3              102.0
                                                                                                                                                                                                                                                  10.6%   13.0%
                                                                                          53.8               64.0
                                                                                                                                                        17.8               20.3              22.1                                10.5              10.8
      0                                                                                                                     55.0%             0                                                                                                           8.0%
                2016              2017               2018                              H1 2018           H1 2019                                        2016              2017              2018                              H1 2018           H1 2019

200                                                                                                                         35.0%
     Adj. Personnel Expenses                                                                                                   Comments
     (in €m / in % of net sales)(3)
                                                                                                                               •
                                                                                                                            30.0% In H1 2019, Material costs in % of net sales improved further reaching a
150                                                                                                                               level well below the past three years based on efficiency gains, further
                                                                                                                                  integration of our supply chain and product mix improvement
                                                                                                                            25.0%
100                                                                                                                              •       Other Operating costs in % of net sales decreased in H1 2019,
                                                                                                                            20.0%        compared to H1 2018, due to e.g. a lower relative share of energy and
                                                                                                                                         transportation costs
  50                                                                                                       14.0%
                                13.1%              13.5%                                13.3%                               15.0%
             12.7%
                                                                                                                                 •       Personnel expenses increased in % of net sales, in H1 2019, compared
               18.4               21.0              24.5                                  11.3               14.2                        to H1 2018, mainly due to the ramp-up at our Umag (Croatia) plant
    0                                                                                                                       10.0%
              2016               2017               2018                               H1 2018           H1 2019
Notes: (1) Material costs is defined as Cost of materials, supplies and services less temporary personnel, less income from disposal from recycling products, less income from insurance (incl. income from business interruption insurance of EUR 0.2m
in H1 2019), less income from claims and adjusted for changes in finished and unfinished goods; (2) Adjusted for costs for listing on the sock exchange; (3) Adjusted for temporary personnel costs and one-off bonus payments paid by the majority
shareholder                                                                                                                                                                                                                                                       8
Financial Position - overview
As of June 30, 2019

   (in T€)                              30 Jun 2019   31 Dec 2018
   ASSETS                                                           Comments
   Non-current assets                     124,840       100,440
                                                                    •   Increase in non-current assets
   o/w Property plant and equipment        93,690        68,508
                                                                        due to investments into our
   o/w Intangible assets and goodwill      29,797        30,585         platform and Umag expansion
   o/w other non current assets            1,353         1,347
   Current assets                         236,267       96,510      •   IPO proceeds are reflected in
                                                                        Other receivables and assets at
   o/w Inventories                         47,871       49,390
                                                                        the balance sheet date, as the
   o/w Trade receivables                   22,663       22,630          proceeds were only transferred
   o/w Other receivables and assets       142,052        5,514          on 2 July 2019.
   o/w Cash and cash equivalents           23,681       18,976
   Total assets                           361,107       196,949     •   Equity ratio rose to 46.4%

                                                                    •   Net debt position of € 108.7m at
   EQUITY AND LIABILITIES                                               the balance sheet date,
   Total equity                           167,600       25,927          effective net cash position as of
   Non-current liabilities                 52,607        84,116         2 July 2019 with pay-out of IPO
                                                                        proceeds
   Current liabilities                    140,889       86,906
   Total equity and liabilities           361,107       196,949     •   Decrease in working capital

                                                                                                            9
Working Capital management
Working Capital Ratio(1) (LTM) decreased to 16.9%

60.0                                                                                                                      30.0%

                                                                                                                                         Comments
50.0                                                                                                                      25.0%
                                                                        21.0%
40.0                                                                                                                      20.0%          •       Despite increase in sales, inventories decreased by € 1.5m from
                 16.1%                                                                              16.9%
                                                                                                                                                 31 December 2018 to 30 June 2019
                                            14.3%
30.0                                                                                                                      15.0%
                                                                                                                                         •       Trade receivables remained on a stable level despite an
20.0                                                                                                                      10.0%                  increase in sales
                                                                          38.1
                                                                                                     33.4
10.0              23.2                        23.0                                                                        5.0%           •       Increase in Operative Payables by € 3.4m driving improvement
                                                                                                                                                 in Working Capital Ratio
 0.0                                                                                                                      0.0%
                  2016                        2017                        2018                     H1 2019

Notes: (1) Working Capital is calculated as the sum of total inventories and trade receivables less total operative payables. Working Capital ratio is calculated by dividing end of period working capital through the sales of the last 12 months.

                                                                                                                                                                                                                                                       10
Cashflow statement - overview
First six months 2019

   (in T€)                                                    H1 2019   H1 2018
                                                                                  Comments

                                                                                  •   Increase in cash and cash
   Cash and cash equivalents at the beginning of the period   18,976     3,778        equivalents due to capital
                                                                                      increase before listing
   Net cash provided / used in operating activities            8,309     1,032
                                                                                  •   IPO proceeds were
                                                                                      transferred after the balance
   Net cash used in investing activities                      -16,989   -11,419
                                                                                      sheet date on 2 July 2019
   Net cash used in / from financing activities               13.090    10,137
                                                                                  •   Operating cash flow
                                                                                      improved significantly yoy
   +/- effect of exchange rate fluctuations on cash held       297        14          and was negatively impacted
                                                                                      by € 2.2m due to FX
   Cash and cash equivalents at the end of the period         23,681     3,542        valuation of the deferred
                                                                                      receivable Aluflexpack
                                                                                      booked for recognizing the
                                                                                      IPO proceeds at the balance
                                                                                      sheet date

                                                                                  •   Investments of €17.0m
                                                                                      mainly into Umag expansion

                                                                                                                      11
Capital allocation in H1 2019
€ 17.0m invested into future

                                  Finalization of expansion of stand-up pouch
                                            manufacturing capacities

      Capex H1 2019            Additional capacities for Pharma and Coffee/tea, as
         € 17m                   well as Dairy and Confectionery end markets

                                  Efficiency and product quality improvements

                                                                                     12
Construction of Umag well advancing
Over € 20m already invested in infrastructure and new machinery

         Rotogravure printing                                            Slitter/ Rewinder/                           Pouch-Making/ Spout/
    1 & laminating machine                                            2 Laser                                     3 Thomson Die/ Zip                            4 Infrastructure Umag

                   installed                                                    installed                                   installed                                 Well on track

•                                                                                                             •     One pouch making machine and            •     Construction of main production
        Rotogravure printing machine up                           •    Rewinder and laser are up and
        and running since end of July 2019.                                                                         one spout machine installed and               building almost finished
                                                                       running
        Several products already tested and                                                                         running
                                                                  •    Slitter will be installed in October                                                 •     Recuperation will be connected until
        produced successfully                                                                                 •     Additional pouch machine and                  middle of September
•       Laminator also up and running since                                                                         Thomson Die/ Zip will be installed in
                                                                                                                    September with start of production      •     Expansion incl. Relocation of
        mid August 2019 – acceptance tests
                                                                                                                                                                  machines and warehouse, planned
        ongoing, bigger production start in                                                                   •     Theoretical installed capacity of             mainly to be finished in Q3 and
        September                                                                                                   500m pcs by September                         partly in Q4

    “1bn Pouches” expansion
    •    Installed capacity: 500m stand-up pouches p.a. by September 20191
    •    Targeted end markets: Pet food, baby food, liquids etc.
    •    Production for selected blue chip customers
    •    Increased demand for high value-added products at industrial scale
    •    Potential features: zippers, spouts, special formats, etc.

Notes: (1) Stated capacity is referring to 100g standard format

                                                                                                                                                                                                    13
Eliopack update

  As reported previously, a fire occurred at the manufacturing facility of Aluflexpack’s subsidiary
   Eliopack in the industrial zone of Ajeux in La Ferté-Bernard, France, on 24 June 2019

  Production areas not affected by fire have been fully operational within one week. Other machines
   started production within three weeks; electrical infrastructure completely reinstalled; cleaning and
   decontamination process of remaining machines completed by end August. The start-up of the
   affected machines has been initiated and the fine-tuning is ongoing

  Close cooperation with customers, effective contingency plans and alternative production routes
   assured no significant interruption of deliveries

  Based on current facts, management expects all costs related to the incident to be covered by
   existing insurance policies

  As of 30 June, 2019, € 2.5m in depreciation on inventories and € 0.8m impairments on technical
   equipment and machinery recognized, as well as insurance income of € 3.5m1

Notes: Amount of € 3.5m includes income from business interruption of €0.2m for H1 2019.

                                                                                                           14
Strategic positioning
Focus on proven cornerstones in Aluflexpack’s business model

                        Development &             Focus on          Deep integration        Leverage on
                       manufacturing of         fast growing             of the             economies of
                       high value adding        end markets           value chain          scale/operating
                           products                                                           leverage
     Developments H1

                       - Expansion in SUP     Strengthen position   Leverage existing       Decrease of other
                             business          in coffee/tea, pet       lacquering,        operating costs in
                        - Further develop-     food and pharma           extrusion,          % of net sales
                          ment of coffee          end markets         lamination and         achieved, e.g.
                       capsules and blister                         printing capacities        energy and
                           foil business                                                  transportation costs

Source(s): Company information

                                                                                                                 15
Major building blocks for accelerated growth

                                        Capacity
      Stand-up
                                      expansion &   Value accretive
   pouch business
                                       efficiency    acquisitions
                                     improvements

                    Organic growth                   Bolt-on M&A

                                                                      16
Outlook for full year 2019

•   Positive momentum expected to continue in H2 2019

•   Based on healthy end market demand and a gradual ramp-up of our SUP capacities, full
    year net sales are expected to be in a corridor of € 200m to € 210m

•   In addition, the full year adjusted EBITDA margin (in %) is expected to be at a similar level
    to the one reached in H1 2019

                                                                                                    17
Appendix
Overview over earnings adjustments

ADJUSTMENTS ON EBITDA LEVEL (in T€)                                                                                                                        H1 2019                                     H1 2018
EBITDA - IFRS reported                                                                                                                                       4,199                                      9,226
Transaction costs of the initial public offering                                                                                                             2,596                                         0
Extraordinary personnel expenses1                                                                                                                            7,987                                      1,911
Expenses in relation to fire incident2                                                                                                                       2,505                                         0
Income in relation to fire incident3                                                                                                                        -3,308                                         0
EBITDA - adjusted                                                                                                                                           13,979                                      11,138

ADJUSTMENTS ON EBIT LEVEL (in T€)                                                                                                                          H1 2019                                     H1 2018
Operating Profit (EBIT) - IFRS reported                                                                                                                     -5,058                                       1,740
Transaction costs of the initial public offering                                                                                                             2,596                                         0
Extraordinary personnel expenses                                                                                                                             7,987                                       1,911
Expenses in relation to fire incident                                                                                                                        2,505                                         0
Income in relation to fire incident                                                                                                                         -3,308                                         0
Impairment in relation to fire incident4                                                                                                                      803                                          0
Acquisition related amortizations                                                                                                                             957                                         768
Operating Profit (EBIT) - adjusted                                                                                                                           6,482                                      4,419

    Notes: (1) Voluntary one-off bonus payment to management by majority shareholder; (2) Expenses refer to potential write off of stock in relation to the fire incident that occurred at Eliopack on 24 June 2019; (2) Income refers to expected reimbursements for
    stock write off and tangible book value write off in relation to the fire incident that occurred at Eliopack on 24 June 2019 and exclude gains from business interruption insurance in the amount of EUR 0.2 million; (3) Impairments were made to technical
    equipment in relation to the fire incident that occurred at Eliopack on 24 June 2019;                                                                                                                                                                               19
Income statement

(in T€)                                    H1 2019   H1 2018
Gross Sales                                102 729    86 384
Sales deductions                            -1 410    -1 175
Net Sales                                  101 319    85 209
Change in finished and unfinished goods      387       3 897
Other operating income                      7 463      4 106
Cost of materials, supplies and services   -69 890   -60 379
Personnel expenses                         -21 729   -13 065
Other operating expenses                   -13 351   -10 542
EBITDA                                      4 199      9 226
Depreciation and amortisation               -9 257    -7 486
Operating Profit                            -5 058     1 740
Interest income                               25         1
Interest expenses                           -2 481    -1 821
Other financial income                       939       1 401
Other financial expenses                     -709     -1 051
Financial result                            -2 226    -1 470
Result before tax                           -7 284      270
Tax expense/benefit                          -669       101
Result for the period                       -7 953      371
Thereof attributable to:
    Owners of the company                  -7 863     335
    Non controlling interests                -90       36
Result for the period                      -7 953     371

                                                               20
Balance Sheet – Assets

(in T€)                          30 Jun 2019   31 Dec 2018
ASSETS
Intangible assets and goodwill     29 797        30 585
Property, plant and equipment      93 690        68 508
Other receivables and assets         114           114
Deferred tax assets                 1 239         1 233
Non-current assets                 124 840       100 440

Inventories                        47 871        49 390
Trade receivables                  22 663        22 630
Other receivables and assets       142 052        5 514
Cash and cash equivalents          23 681        18 976
Current assets                     236 267       96 510

TOTAL ASSETS                       361 107       196 949

                                                             21
Balance Sheet – Equity and Liabilities

(in T€)                                               30 Jun 2019   31 Dec 2018
Capital stock                                           15 553           86
Capital reserves                                        136 426        1 958
Retained earnings                                       14 828        23 000
Equity attributable to owners of the Company            166 806       25 044
Non controlling interests                                 793           883
Total equity                                            167 600       25 927
Loans from affiliated companies                            0          43 979
Bank loans and borrowings                               26 164        23 527
Other financial liabilities                             20 631         9 934
Deferred tax liabilities                                 4 136         4 343
Employee benefits                                        1 443         1 383
Other liabilities                                         233           950
Non-current liabilities                                 52 607        84 116
Bank loans and borrowings                               16 726        17 581
Loans from affiliated companies                         65 784        23 776
Other financial liabilities                              3 065          923
Current tax liabilities                                   849           978
Provisions                                               2 162           23
Employee benefits                                        1 292          978
Trade payables and advances received from customers     37 150        33 695
Accruals                                                 8 239         2 316
Other liabilities                                        5 632         6 636
Current liabilities                                     140 899       86 906
TOTAL LIABILITIES                                       193 506       171 022
TOTAL EQUITY AND LIABILITIES                            361 107       196 949

                                                                                  22
Cash flow statement

(in T€)                                                                           H1 2019   H1 2018
Income/Loss before tax                                                             -7 284      270
+/- Financial results excluding other financial income/expense                     2 456     1 820
+/- Other non-cash expenses and income                                             7 192     1 417
+ Depreciation and amortisation                                                    9 257     7 486
-/+ Gains and losses from disposals of PPE and intangible assets                      0         -2
-/+ increase and decrease in inventories                                           1 705     -4 023
-/+ Increase and decrease in current trade receivables                               79      -2 096
-/+ Increase and decrease in other assets                                          -5 040      258
+/- Increase and decrease in trade payables                                         631      -3 789
+/- Increase and decrease in accruals                                              1 864       666
+/- Increase and decrease in other payables                                        -1 750     -969
+/- Increase and decrease in provisions                                             203         74
+/- Increase and decrease in liablities for employee benefits                        13          0
-/+ Income taxes paid                                                              -1 017      -81
Net cash provided / used in operating activities                                   8 309     1 032

+ Payments received for disposals of PPE and intangible assets                       0         7
- Payments made for purchases of PPE and intangible assets                        -17 015   -11 431
+ Interest received                                                                 25         1
+/- Other payments received/made for investing activities                            0         4
Net cash used in investing activities                                             -16 989   -11 419

+ Proceeds from the issue of ordinary shares                                      16 564       0
- Payments of lease liabilities (2018: Payments of financial lease liabilities)   -1 752     -429
+ Issuances of financial liabilities (3rd parties)                                 5 255      519
+ Issuances of financial liabilities (MTC group companies)                           0      14 628
- Repayments of financial liabilities (3rd parties)                               -3 655    -3 634
- Repayments of financial liabilities (MTC group companies)                       -2 290      -23
- Interest paid                                                                   -1 032     -925
Net cash used in / from financing activities                                      13 090    10 137

                                                                                                      23
You can also read