Current prospects for a strong European automotive supplier industry - Way forward - Steering automotive supply business through turbulent times ...
←
→
Page content transcription
If your browser does not render page correctly, please read the page content below

Current prospects for a strong European
automotive supplier industry
Way forward – Steering automotive supply business
through turbulent times

Webinar
19 May 2020
Your contacts:

                                Dipl.-Vw. Christoph Stürmer
                                Autofacts Global Lead Analyst
                                Tel.: +49 69 8595 6269
                                christoph.stuermer@pwc.com

            •   Automotive market analysis and forecasting
            •   Business model assessment and risk analysis
            •   Market and brand strategy
            •   Product portfolio management
            •   Industry transformation scenario modelling

                                Dipl.-Ing. Henning Rennert
                                Partner Strategy&
                                Tel.: +49 160 9555 3583
                                henning.rennert@strategyand.de.pwc.com

            •   12 years industry experience
            •   13 years consulting experience
            •   Product- and technology strategy
            •   Efficiency improvement
            •   Product value management
                                                                         19 May 2020
Strategy&                                                                          2
Today we report about two topics: OEM production prognosis and
corresponding supply chain dynamics
PwC perspective

      1 We as PwC Auto practice operate our analyst expert team Autofacts …
                     2 ... delivering an independent market perspective …
      3 … touching key questions of the industry, e.g. governmental incentives ...
                     4 … and regionalization of supply chains – a new trend?
      5 In cooperation with CLEPA – Thanks
Current prospects for a strong European
automotive supplier industry                                                         19 May 2020
Strategy&                                                                                      3
Agenda

1. Global Production Outlook
2. Dynamics in the automotive supply chain - impulses for
   a new tomorrow

Current prospects for a strong European
automotive supplier industry                                19 May 2020
Strategy&                                                             4
Risk Assessment Status as of May 13, 2020

The prolonged COVID-19 mitigation measures have significantly
impacted global vehicle demand, production and value chains

Possible scenarios                                                                                                     Risk assessment of global vehicle production1) 2020
                                                                                                                          Global vehicle production in mn
                        • Original Base Case
                        • After a decline in production due to plant shutdowns of 3-4                                         10
                                                                                                                                       YTD April numbers
                          weeks that have originally been announced, production can
  1     Impact            be resumed without restriction for the most part                                                      9
                                                                                                                                       partially estimated

                        • Production shortfalls in the months February to April will not be                                     8
                          made up but merely return to expected rates in 2nd half year
                                                                                                                                7                                                                            6.7      6.6       6.7
                        • After the end of social measures, broad-based incentive                                                                                                                            6.2      6.1       6.0
                                                                                                                                                                                    5.7        5.7                                            6.2
                          schemes unleash pent-up demand especially in China and EU                                             6     5.6                                                             5.5                                     6.0
  2     Incentive
                        • Due to coordinated planning, vehicle production and supply                                                                                       4.8
                                                                                                                                                                                                                                              5.6
                                                                                                                                                                                               4.9           5.5                5.6
                          chains are recovering rapidly – China up to 80% utilization                                           5             4.5       4.4                                                                                   4.9
                                                                                                                                                                                                              4.8               5.0
                                                                                                                                                                                                      4.6             4.6
                                                                                                                                4                      4.4                          4.4
                                                                                                                                                                                                                      4.2
                        • Actual Base Case
                                                                                                                                                                           3.5                 3.6    3.6
                        • Based on prolonged measures, shutdowns continue into May                                              3
        Deep                                                                                                                                                      2.0
  3                       – with production recovering only slowly in Q2
        Impact                                                                                                                  2
                        • Disruptive effects on the demand side and suppliers/logistics                                                                           2.0
                                                                                                                                                                                           Base scenario (without influence of COVID-19)
                          lead to significant downturn over several quarters                                                    1
                                                                                                                                    Jan      Feb       Mar        Apr      May     Jun     Jul       Aug    Sep      Oct       Nov        Dec
                        • First wave of measures to be quickly relieved due to initial                              Total 2020              Base                 Impact            Incentive          Deep Impact             Double Dip
                          containment successes (see “Impact” scenario)                                             forecast
        Double
  4                     • After summer, a second COVID-19 infection wave to follow,                                 per
        Dip               contained more effectively with more targeted measures                                    scenario                73.6             64.4 (-12%)         58.4 (-21%)         51.0 (-30%)            58.6 (-20%)
                        • Overall effect is structural and extends into the following year
Current prospects for a strong European
automotive supplier industry              1) Passenger Cars (incl. light duty LCV in USA) mn: million                                                                                                                                 19 May 2020
Strategy&                                 Source: PwC Autofacts analysis V 5 as of May 13, 2020       Base case forecast: IHS Markit Release Q1 2020                                                                                            5
Europe:
COVID-19 measures are showing a scalable impact on demand
PC* sales: Risk assessment for sales 2020
2.0
• European demand was Actuals
increasingly stopped in March 1.5
2020, as a direct effect of the
1.0
measures to contain COVID-19.
On the basis of available data, 0.5
new car registrations in Western
0.0
Europe in March fell by about 53% Jan Feb Mar Apr May Jun Jul Aug Sep Oct Nov Dec
compared to the previous year, the
quarter by 27%. Scenario Sales (in millions) Effect Result
• State incentive schemes if 2019 15.9 Basis of comparison
repeated from 2009 will create • -56% in May vs. 2019
Incentive 10.8 -32.1%
significant market distortions and • -7% in H2 vs. 2019
mostly sell pre-produced vehicles; • -35% in May vs. 2019
Impact 12.2 -23.6%
• Recovery in second HY
incentives on eco-cars only would
• -56% in May vs. 2019
fail to create significant volume Deep Impact 9.8 -38.4%
• -20% in H2 vs. 2019
effects. • -35% in May vs. 2019
Double Dip 11.1 -30.5%
• -53% in October vs. 2019
Current prospects for a strong European
automotive supplier industry Basis 2019 Impact Scenario 2020 Double Dip 2020 19 May 2020
Strategy& Incentive Scenario 2020 Deep Impact Scenario 2020 6Europe:
Could electric vehicles save the industry in 2020?
Alternative Fuel Vehicle Sales
• Electrified vehicles are expected to secure growing market
shares due to high customer demand and an expanded 85,2% 8,4%
product offering. Targeted subsidies and sales support have
proven highly effective in overcoming buyer objections.
• Limited production flexibility, lacking product availability and 2,7%
oversold production volumes give AFV a more stable sales
performance, but limit the potential to support the total market. 3,7%
2020 Q1 Comparison to 2019 Q1 Top-5 (YTD March)
Total Sales 2,115,581 100%
BEV 79,000 +120%
of which AFV 312,626* 14.8%
PHEV 56,000 +149%
of which BEV 79,300* 3.7%
Hybrid 177,000 +27% of which PHEV 56,118* 2.7%
Total 313,000 +58% of which Hybrid 117,208* 8.4%
Strategy&Europe:
Vehicle production affected by the decline of local and global demand
PC* production: Risk assessment for production 2020
2.0
Actuals
• Short-term: Based on available 1.5
information, we estimate
1.0
production to have fallen by about
45% in March compared to 2019, 0.5
and to literally be at a complete
0.0
standstill in April at -97% versus Jan Feb Mar Apr May Jun Jul Aug Sep Oct Nov Dec
2019.
• Medium-term: Due to dramatic Scenario Production (in millions) Effect Result
pandemic effects, Italy decreed 2019 15.3 Basis of comparison
the closure of all factories on 22 • -58% in May vs. 2019
Incentive 11.0 -28.3%
March after FCA had already • -13% in H2 vs. 2019
stopped vehicle production, as Impact 13.0 -15.3%
• -10.7% in Version 4.1
• Stronger losses in April
well as in Spain.
• -58% in May vs. 2019
Deep Impact 10.0 -34.6%
• -26% in H2 vs. 2019
• -15.7% in Version 4.1
Double Dip 12.0 -21.2%
• -45% in October vs. 2019
Current prospects for a strong European
automotive supplier industry Basis 2019 Impact Scenario 2020 Double Dip 2020 19 May 2020
Strategy& Incentive Scenario 2020 Deep Impact Scenario 2020 8Risk Assessment Status as of May 13, 2020
Europe:
For the longer term, we assume a full recovery taking beyond 2021
Base Case: Deep Impact Scenario/ U-Shaped Crisis
Comments
18
• Starting in Q4 2018, European production was sent on a
downward trajectory due to (mismanagement of) certification
PC Production Western Europe [Mio].
16 16.7
changes and regulatory changes 16.2
15.3 15.1
14 14.5
• As the industry started to move into 2020 with uncertain
outlook, the COVID-19 freeze-up hit in the wake of numerous 13.3
12
critical product and production ramp-ups, specially of BEV and
PHEV variants which are still short in supply 10
10.3
• Impacts from COVID-19 measures are expected hit economies
8
across Europe deeply, to a level estimated larger than the global
financial crisis: unemployment, company failures, personal
defaults will have negative impact on private and corporate 6
purchasing power and willingness-to-spend
4
• Although state incentives may support short-term demand on
retail and OEM level, following increased taxes and restricted 2
Basis Impact Incentive Deep Impact Double Dip
infrastructure spending will slow down long-term growth and
civil development; changes in mobility preferences will require 0
rapid adaption of industry transformation strategies 2017 2018 2019 2020 2021 2022 2023
Current prospects for a strong European
automotive supplier industry 19 May 2020
Strategy& 9While markets in Europe collapse, USA and China show less decline
The year 2020 up to April
• Collapse of European new car registrations in April:
Sales Decrease vs.
Country
Decrease* YTD Apr 19 – UK, Spain, Italy all lose 99% of registrations to about 4,000 units
China -2,409,501 -35.9% – France loses “only” 89%, Germany 61% vs. April 2019
Japan -220,724 -13.9% – Full stop of sales as social distancing measures take hold
South Korea -18,637 -4.0%
– No alternative means of marketing, sales and registrations established
USA -976,308 -22.7%
– Registration offices mostly closed, so eventual sales not recorded
Rest of NA -271,839 -33.6%
– Used car markets and aftermarket impacted, but still working
Germany -368,605 -31.0%
UK -374,222 -43.4%
France -355,854 -48.0% • Resilience in USA and China:
Italy -361,380 -50.7% – Both markets operate on a stock-based sales model (build-to-stock)
Spain -213,441 -48.9%
– Dealers operate independently and bill their own cars
Remaining EU -584,252 -37.2%
– Ad-hoc online marketing, sales and alternative delivery sprung up
ROW -1,670,742 -32.0%
– More digital-savvy clients and easier legal prerequisites in China
Total -7,866,414 -31.9%
– Sales reported by wholesale/ retail companies, not registration offices
Current prospects for a strong European
automotive supplier industry 19 May 2020
Strategy& 10A few do‘s and don‘ts of incentive programs
Comparison of 2009 to 2020
• Incentive Programs 2009 • Recommendations for 2020
– Different programs in different European countries – Coordinated approach across all countries
– Small programs proved ineffective – Significant billion-Euro size required for credible effects
– Included in-stock and pre-registered vehicles – Only effective for suppliers if focused on new vehicles,
while aftermarket offers complementary opportunities
– Full focus on just automotive retail created a time lag for
effects on production – Overstocking not as pronounced as 2020 allows for
quicker transmission into new-car production
– Scrappage schemes lead to over-proportionate demand
for lowest-price vehicles and import production – Incentives should focus on potential average new-car
buyers in order to focus on demand creation
– General support of “up-to-date” vehicles without
technical discrimination (France offered CO2 bonus) – Too narrow focus on e.g. electric/ plug-in vehicles would
aggravate supply shortages but not support total market
– Showroom traffic was greatly increased due to possible
bargains after the immediate effects of the crisis – Positive secondary effects only to be expected when
overall consumer confidence has stabilized
Current prospects for a strong European
automotive supplier industry 19 May 2020
Strategy& 11Agenda 1. Global Production Outlook 2. Dynamics in the automotive supply chain - impulses for a new tomorrow Current prospects for a strong European automotive supplier industry 19 May 2020 Strategy& 12
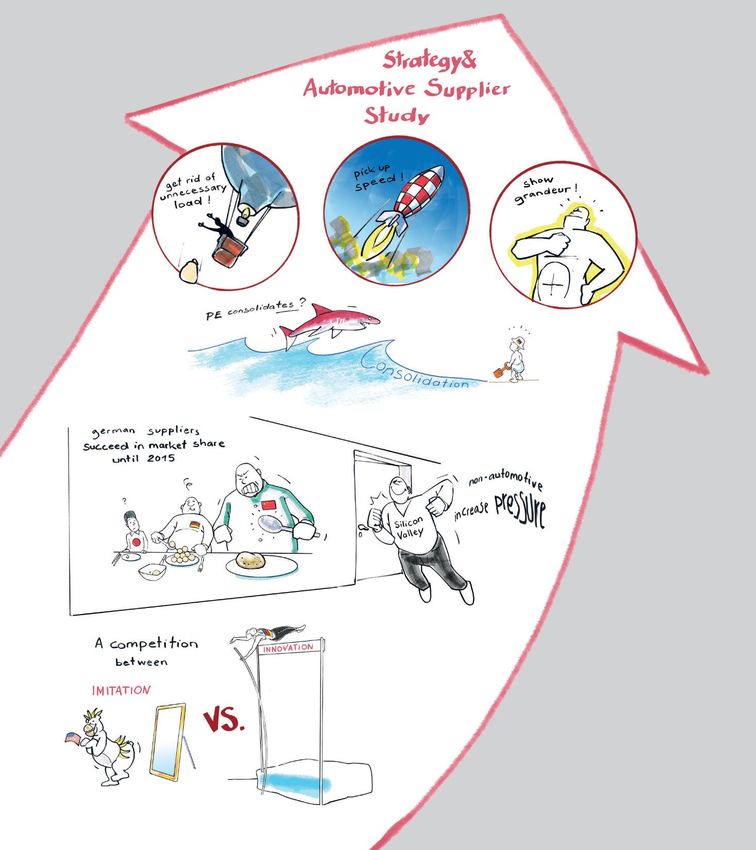
The COVID-19 outbreak makes transparent that the automotive supply
chain is far from invulnerable – will the structure change?
Takeaways
Rethinking the global supply chain
1 The current COVID-19 crisis has made the European automotive industry aware of its dependence on Asian suppliers - current supply
chains are being questioned and rethought
Additional cost down push by OEM
2 In addition to the strategic considerations, the redesign of the supply chain comes together with an additional price push by the OEMs
Insourcing an option again?
3 In addition to direct dependency, topics such as intellectual property, strengthening core competencies and the utilisation of the
company's own workforce are coming back into focus - insourcing seems to be an option in selected cases again
Restructuring as chance for a new tomorrow
4 Combination of relocation and upstream product cost reduction and product qualification: Using the crisis for success!
Current prospects for a strong European
automotive supplier industry 19 May 2020
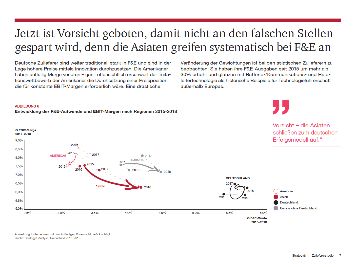
Strategy& 13The crisis demonstrates the high dependency on global suppliers and
might lead to a trend towards more regionalization
Trend towards regionalization after the crisis Calls for more regionalization after the crisis
Foreign trade and dependency on China - quote from Automobil-Industrie
Germany’s auto parts exports to China (in k USD)1)
2015
21.04.2020
2016
+3.7% “Manufacturing in the market for the market and
2017 purchasing components there. We will certainly
CAGR
2018
Dr. Holger
continue to optimize this principle and thus operate
2019 Engelmann, CEO even more regionally. …. taking greater account of
of Webasto SE the regional aspect in the future.”
0 2,000,000 4,000,000 6,000,000 8,000,000 10,000,000 12,000,000
Germany’s auto parts imports from China (in k USD)1)
2015
2016
2017
+11.0%
CAGR 24.04.2020
2018 “The Corona crisis has shown that supply chains in the
2019 automotive industry are heavily dependent on Asia.
0 2,000,000 4,000,000 6,000,000 8,000,000 10,000,000 12,000,000 Dr. Stefan Wolf,
In my opinion, adjusting supply chains more locally
Chairman of the and relying more on solid suppliers in Germany or
board of Elring Europe would be the right way to get out of the one-
Klinger sided dependence on individual regions.”
Dependence on China increases
Current prospects for a strong European
automotive supplier industry 1) Source: ITC – Bilateral trade statistics between Germany and China: Parts and accessories for tractors, motor vehicles for the transport of ten or more persons, motor cars 19 May 2020
Strategy& and other motor vehicles principally designed for the transport of persons, motor vehicles for the transport of goods and special purpose motor vehicles 14To fundamentally understand if there is a trend or not, we conduct a
joint survey. Please join
Dynamics in the Automotive Supply Chain – Impulses for a new tomorrow
Intention of the survey Your participation in our survey
The COVID-19 outbreak makes transparent that the
Survey consists of 12 questions
supply chain is far from invulnerable. It has triggered a
discussion whether the current supply chain needs to
evolve towards a more regional and diversified setup. Takes about 15 minutes of your time
CLEPA and PwC Strategy& collects firsthand We kindly ask you to indicate your company
information to better understand the current situation.
We ensure that data is kept secure
The anonymized results of the survey will be Scan this QR-Code
published in the form of a study.
to get to the
survey!”
Source:
PwC Strategy& https://pwc.qualtrics.com/jfe/form/S
Automotive Supplier
Study 2019
V_77i7TTtrNKpz3yB
Automotive Supplier Study 2020 How to get to the survey?
Current prospects for a strong European
automotive supplier industry 19 May 2020
Strategy& 15Global:
In consequence, vehicle demand is heavily impacted by the shutdowns
PC* sales: Risk assessment for sales 2020
10.0
Actuals
8.0
6.0
• Demand is returning to the end of 4.0
local restrictions at different rates, 2.0
with labour market effects 0.0
amplifying the impact Jan Feb Mar Apr May Jun Jul Aug Sep Oct Nov Dec
• Production bottlenecks caused by
Scenario Sales (in millions) Effect Result
logistical and financial problems of
global suppliers determine the 2019 75 Basis of comparison
production ramp-up in Q2 2020 • -14.3% in Version 4.1
Incentive 60.4 -19.4%
• Lowered expectation for China
• -13.7% in Version 4.1
Impact 65.0 -13.2%
• Recovery in the 2nd HY
• -36.8% in Version 4.1
Deep Impact 53.0 -29.2%
• More positive outlook for China
• -19.5% in Version 4.1
Double Dip 59.3 -20.9%
• -33% in October vs. 2019
Current prospects for a strong European
automotive supplier industry Basis 2019 Impact Scenario 2020 Double Dip 2020 19 May 2020
Strategy& Incentive Scenario 2020 Deep Impact Scenario 2020 16USA:
Extended containment follows the Deep Impact scenario path
PC* sales: Risk assessment for sales 2020
1.4
Actuals
1.2
• After initial slumps in California 1.0
and New England (New York, 0.8
0.6
Boston), vehicle retail showed
0.4
surprising resilience in April.
0.2
• The sharp rise in unemployment is 0.0
dampening purchasing power. Jan Feb Mar Apr May Jun Jul Aug Sep Oct Nov Dec
• In April, vehicle production came
Scenario Sales (in millions) Effect Result
to an almost complete standstill.
2019 13.5 Basis of comparison
• In the meantime, we don‘t expect • -42% in May vs. 2019
Incentive 9.6 -28.9%
a restart before mid-May (Deep • -29% in H2 vs. 2019
Impact Scenario), so that a catch- Impact 12.0 -11.3%
• -33% in May vs. 2019
• Recovery in the second HY
up process lasting several years is
to be expected, as after 2008/09. • -42% in May vs. 2019
Deep Impact 9.0 -33.4%
• -38% in H2 vs. 2019
• -32% in May vs. 2019
Double Dip 11.0 -17.7%
• -8% in October vs. 2019
Current prospects for a strong European
automotive supplier industry Basis 2019 Impact Scenario 2020 Double Dip 2020 19 May 2020
Strategy& Incentive Scenario 2020 Deep Impact Scenario 2020 17China:
Demand shows surprising resilience while production returns
PC* sales: Risk assessment for sales 2020
3
Actuals
• Judging from the example of 2009, 2
incentives on car taxations and
financing can unleash pent-up 1
demand from 2017-18, while
installed capacity allows for 0
production of up to 5 million units Jan Feb Mar Apr May Jun Jul Aug Sep Oct Nov Dec
per month.
Scenario Sales (in millions) Effect Result
• The release of the supplier and
2019 21.1 Basis of comparison
manufacturer plants allows a rapid
• +16.6% in Version 4.1
start of production; however, JV Incentive 20.4 -3.4%
• +22% in H2 vs. 2019
plants of foreign brands still suffer • -12% in May vs. 2019
Impact 18.6 -12.3%
in part from a lack of supply from • Recovery in the second HY
international suppliers. Deep Impact 17.0 -19.5%
• -37.3% in Version 4.1
• -Takeover of PwC China
• -12% in May vs. 2019
Double Dip 15.7 -25.9%
• -49% in October vs. 2019
Current prospects for a strong European
automotive supplier industry Basis 2019 Impact Scenario 2020 Double Dip 2020 19 May 2020
Strategy& Incentive Scenario 2020 Deep Impact Scenario 2020 18You can also read