Gold Fields FY 2020 results - Nick Holland: CEO 18 February 2021
←
→
Page content transcription
If your browser does not render page correctly, please read the page content below
Gold Fields FY 2020 results
Nick Holland: CEO
18 February 2021
Forward looking statement

 Certain statements in this document constitute “forward looking statements” within the meaning of Section 27A of the US Securities Act of 1933 and
 Section 21E of the US Securities Exchange Act of 1934.

 In particular, the forward looking statements in this document include among others those relating to the Damang Exploration Target Statement; the
 Far Southeast Exploration Target Statement; commodity prices; demand for gold and other metals and minerals; interest rate expectations;
 exploration and production costs; levels of expected production; Gold Fields’ growth pipeline; levels and expected benefits of current and planned
 capital expenditures; future reserve, resource and other mineralisation levels; and the extent of cost efficiencies and savings to be achieved. Such
 forward looking statements involve known and unknown risks, uncertainties and other important factors that could cause the actual results,
 performance or achievements of the company to be materially different from the future results, performance or achievements expressed or implied
 by such forward looking statements. Such risks, uncertainties and other important factors include among others: economic, business and political
 conditions in South Africa, Ghana, Australia, Peru and elsewhere; the ability to achieve anticipated efficiencies and other cost savings in connection
 with past and future acquisitions or joint ventures, exploration and development activities; decreases in the market price of gold and/or copper;
 hazards associated with underground and surface gold mining; labour disruptions; availability terms and deployment of capital or credit; changes in
 government regulations, particularly taxation and environmental regulations; and new legislation affecting mining and mineral rights; changes in
 exchange rates; currency devaluations; the availability and cost of raw and finished materials; the cost of energy and water; inflation and other
 macro-economic factors, industrial action, temporary stoppages of mines for safety and unplanned maintenance reasons; and the impact of the AIDS
 and other occupational health risks experienced by Gold Fields’ employees.

 These forward looking statements speak only as of the date of this document. Gold Fields undertakes no obligation to update publicly or release any
 revisions to these forward looking statements to reflect events or circumstances after the date of this document or to reflect the occurrence of
 unanticipated events.

 Further details of potential risks and uncertainties affecting Gold Fields are described in Gold Fields’ filings with the Johannesburg Securities
 Exchange and the US Securities and Exchange Commission, including in Gold Fields’ Annual Report on Form-20F for the year ended 31 December
 2017, Gold Fields’ Integrated Annual Report 2017 and Gold Fields’ Annual Financial Report 2017

FY 2020 results | 18 February 2021                                                                                                                        2
FY 2020 highlights
  ● Covid-19 impact largely contained – c.80koz of lost production (4% of original guidance)

  ● Attributable production of 2,236koz in 2020 vs. 2,195koz in 2019 (+2% YoY)

  ● Mine net cash flow of US$868m

  ● Net cash flow of US$631m – net of interest and Salares Norte expenditure

  ● Normalised earnings of US$879m, 2.5 times 2019 normalised earnings

  ● Final dividend of R3.20/share, taking total dividend to R4.80/share

  ● Salares Norte tracking well

        ̵ Construction progress 15.6% at end-December 2020 vs. plan of 9.9%

  ● Improved balance sheet

                                                                                       31 December 2020             31 December 2019
     Net Debt                                          US$m                                     1,069                    1,664
     Net debt to EBITDA                                times                                    0.56x                    1.29x
     Leases*                                           US$m                                      429                      333
     Net debt (excl leases)                            US$m                                      640                     1,331
     *Increased leases in 2020 was due to renewable energy projects in Australia and increased capacity at Tarkwa

                                                                 Delivering the higher gold price

FY 2020 results | 18 February 2021                                                                                                     3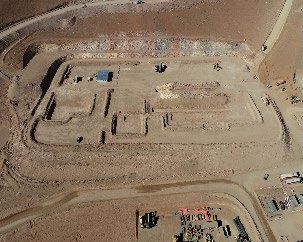
Covid-19 update
                                                                                                                                                                  Group +
                                      Americas                 Australia             South Africa             West Africa                 Group
                                                                                                                                                                  Galiano

               Tested                   52 409                      17                   13 483                   5 573                   71 482                   72 230

              Positive                   1 150                       -                        995                   560                    2 705                   2 829

              Negative                  51 246                      17                   12 370                   4 988                   68 621                   69 245

        Waiting Results                    13                        -                        118                    25                     156                      156

         Active cases                      45                        -                        30                     80                     155                      170

             In Hospital                    1                        -                         1                     3                        5                       5

             Recovered                   1 104                       -                        957                   480                    2 541                   2 649

                Died                        1                        -                         8                      -                       9                      10

    Notes:
    ●   High prevalence in Peru, Ghana and South Africa
    ●   Doing PCR diagnostics
    ●   Testing among our workforce is also more stringent than in public health facilities
    ●   "Awaiting results", "Active cases" and "In hospital" refers to the current figures. South Africa includes the corporate office. West Africa excludes Galiano/Asanko

                                                  Have tested the workforce approximately four times
FY 2020 results | 18 February 2021                                                                                                                                            4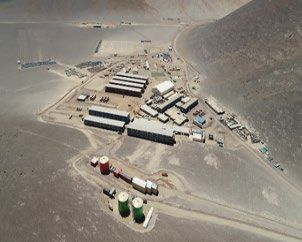
A globally diversified gold miner
                                                                                      FY 2020 results

   Gold Fields Group
   Mines: 9
   Projects: 1
   Countries: 5
   Att. production: 2,236koz
   AIC: US$1,079/oz
   Mine net cash flow: US$868m inflow
   Net cash flow**: US$631m inflow
                                                                            West Africa region
                                                                            Mines: Tarkwa, Damang and Asanko
                                                                            Att. production: 787koz
                                                                            AIC: US$1,060/oz
                                                                            Net cash flow*: US$252m inflow

               Americas region
               Mine: Cerro Corona (Peru)
               Att. production: 206koz (Au eq)                                                                                                               Australia region
               AIC: US$1,119/eq oz                                                                                                                           Mines: St Ives, Granny Smith,
               Net cash flow*: US$84m inflow                                             South Africa region                                                 Agnew and Gruyere
               Project: Salares Norte (Chile)                                            Mine: South Deep                                                    Att. production: 1,017koz
                                                                                         Att. production: 227koz                                             AIC: US$957/oz
                                                                                         AIC: US$1,260/oz                                                    Net cash flow*: US$498m inflow
                                                                                         Net cash flow*: US$34m inflow
*Net cash flow = Cash flow from operating activities less net capital expenditure and environmental payments and lease payments
**Net cash flow = Cash flow from operating activities less net capital expenditure, environmental payments, lease payments and redemption of Asanko preference shares
FY 2020 results | 18 February 2021                                                                                                                                                      5
Delivering on strategy
● Have delivered on key strategic projects
̵ Gruyere: low cost, long life mine ahead of plan
̵ Damang: Delivered the reinvestment plan ahead of schedule, now in the heart of the orebody
̵ South Deep: Restructuring has reset the culture, notable productivity improvements
● Maintained prudent levels of capex through the cycle
● The portfolio is positioned to produce 2.0Moz – 2.5Moz pa for the next 10 years
● Delivered the high gold price to the bottom line in 2020, despite hedges capping some of the
upside
● Further prioritisation and development of long-term ESG targets
FY 2020 results | 18 February 2021 6Focusing on Salares Norte and organic growth
● Focus is now on delivering Salares Norte – next 18 months define success
̵ In construction, production expected in Q1 2023
̵ Construction of plant and pre-stripping has commenced
● Brownfields opportunities across the portfolio:
̵ St Ives: life extension driven by growth at the Invincible complex
̵ Exploration success at Agnew – best position the mine has been in for many years
̵ Exploring potential to extend the life-of-mine at Cerro Corona beyond 2030
̵ Early studies on a potential further cutback at Damang have commenced
● No need to partake in expensive M&A
● Healthy Reserve position outside of SA
̵ 20.5Moz of attributable gold equivalent Reserves outside of SA – c.10 year mine life
̵ Continue to replace depletion and add Reserves in Australia
̵ Replaced depletion and slightly added to Tarkwa’s Reserves in 2020 – second consecutive year
Organic growth provides the best value
FY 2020 results | 18 February 2021 7Gold Fields’ strategic ESG priorities
Strategic Priorities Objectives Strategic Intent
Partnering to ensure the Elimination of fatalities, 1. Zero fatalities and serious injuries at our operations
safety, health and well- serious injuries, illnesses 2. Eliminate vehicular incidents by implementing advanced collision avoidance technologies
being of our workforce and and mental harm that
alleviating such impacts on could arise from our 3. Significantly reduce underground diesel particulate matter exposure
our communities activities 4. Minimise health and environmental impacts on our host communities
Build a diverse and inclusive Increase the proportion 5. Increase the proportion of women in our workforce, including women in leadership and
workplace of women and Indigenous women in mining in all our operating regions
people in our workforce
Unlocking business, Maximise in-country and 6. Maximise Group host community employment
community & stakeholder host community 7. Maximise Group host community procurement spend
value employment and
procurement 8. Maximise Group in-country procurement
Pursuing decarbonisation Reduce carbon emissions, 9. Continue pursuing carbon emissions reductions at all our operations
and building resilience to freshwater use and 10. Increase Group renewable energy use and include at least 20% renewables in all new
climate change in line with exposure to climate- projects
our commitment to the related risks to
Paris Agreement operations, stakeholders 11. Introduce electric vehicles in our underground operations
and the environment 12. Reduce fresh water use and optimise Group water recycling and reuse levels
Full compliance with the Safe and responsible 13. Achieve and maintain compliance with the GISTM as committed by ICMM members
2020 Global Industry tailings management
Standard on Tailings
Management (GISTM)
Delivering enduring value in partnership with our stakeholders
FY 2020 results | 18 February 2021 8Strong cash generation in FY 2020
● Strong cash generation Capital expenditure
̵ Mine cash flow: US$868m in 2020 1 000
vs. US$414m in 2019 800
600
̵ Net cash flow: US$631m in 2020 vs.
400
US$249m in 2019
200
● De-geared faster than expected – 0
2013 2014 2015 2016 2017 2018 2019 2020
c.US$1bn over 24 months (includes
Sustaining capex Non-sustaining capex
equity raise)
● Final dividend of R3.20/share Net Cash Flow
̵ Double interim dividend 700
600
̵ 2020 total dividend 3x 2019 total 500
400
dividend 300
200
● 2021 FCF will be prioritized to fund 100
0
Salares Norte capex (US$508m), pay -100
-200
down more debt and honour the -300
dividend policy 2013 2014 2015 2016 2017 2018 2019 2020
*Net Cash Flow = Cash flow from operating activities less net capital expenditure and environmental payments and finance lease payments
Sustaining capex of US$250/oz – US$300/oz maintained
FY 2020 results | 18 February 2021 9Balance sheet
● Net debt of US$1,069m at end-December 2020 (end-2019: US$1,664m)
̵ Net debt (excl leases) was US$640m (end-2019: US$1,331m)
● Net debt to EBITDA of 0.56x at end-December 2020
● Unutilised facilities (committed and uncommitted) of US$1,117m, R4,035m and A$240m
● US$887m in cash on the Balance sheet
● Repaid outstanding 2020 bonds in October out of a combination of cash and US$ debt facilities
● Refinanced the Australian facility and extended maturity to the 2023
US$m Available facilities at 31 December 2020 US$m Maturity schedule at 31 December 2020
3500 600
3000 500
2500
400
2000
300
1500
1000 200
500 100
0
0
US$ facilities Rand facilities A$ facilities Total facilities
Dec 21
Dec 22
Dec 23
Dec 24
Dec 25
Dec 26
Dec 27
Dec 28
Dec 29
Utilised Unutilised
FY 2020 results | 18 February 2021 10Salares Norte update
● Engineering progress 97.2% at end-December (plan: 90.0%)
● Construction progress 15.6% at end-December (plan: 9.9%)
● Total project progress 27.0% at end-December (plan: 24.4%)
● Camp Phase I completed during Q3 2020
Now have 1,650 bed capacity
● Camp Phase II construction completed post year-end
● US$151m spent on project in 2020, including:
̵ Pre-development costs of US$11m (spent in Q1)
̵ District exploration of US$19m
̵ Initial capex of US$97m
̵ Working capital
● Diversion channel earthworks and precast installation completed by year-end. The bulk earthworks
contractor commenced activities on 21 September
● Mining contractor completed mobilisation and began pioneering works on 1 October
● 87% of orders have been placed and pricing fixed but still subject to escalation
● The pre-strip and construction of the process plant commenced in January 2021
● District drilling 17,504m during 2020 vs. plan of 16,000m
● Relocation of Chinchilla halted until further notice from the authorities
World class project under construction in tier 1 country
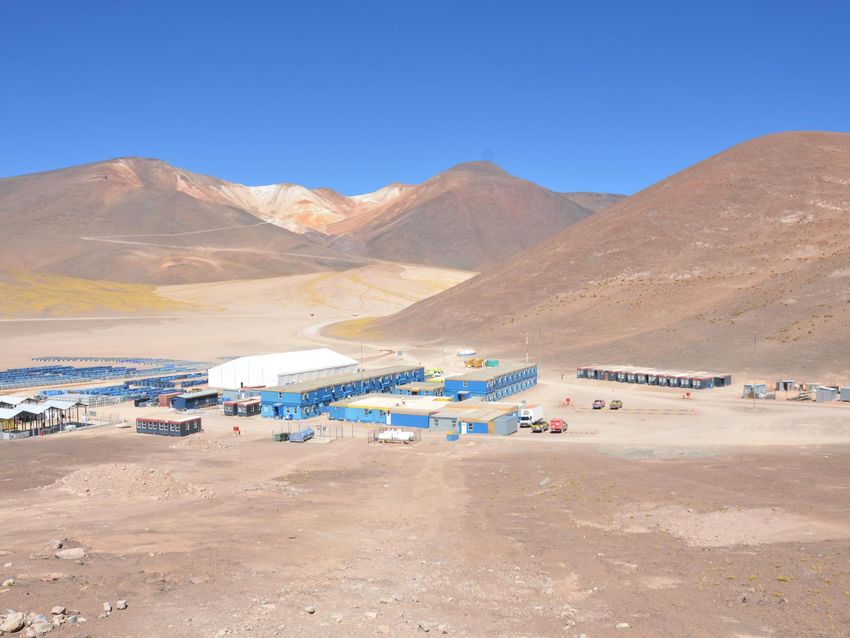
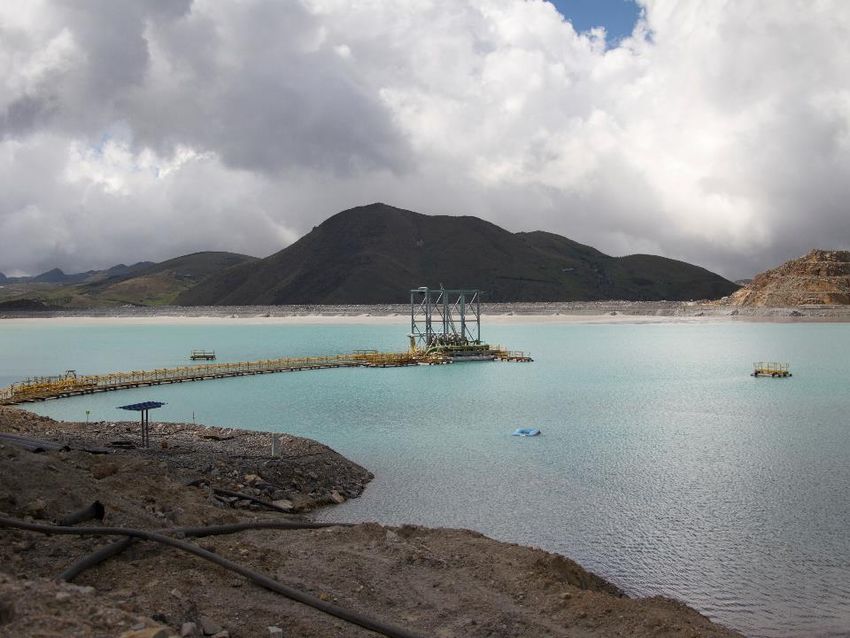
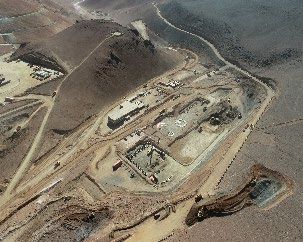
FY 2020 results | 18 February 2021 11Salares Norte progress
Salares Norte camp Plant site
Pre-stripping the pit
HME workshop
FY 2020 results | 18 February 2021 12Growing R&R ex-SA
December 2020 December 2019
Managed Attributable Managed Attributable
Gold equivalent
149.1Moz 116.0Moz 148.7Moz 115.7Moz
Resources
Gold equivalent
56.1Moz 52.1Moz 55.2Moz 51.3Moz
Reserves
Att. Au equivalent Reserves: Dec-2020 Att. Au equivalent Reserves: Dec-2019 Highlights:
Americas: Americas:
6.6 7.0
● 8% YoY increase in Australia
Reserves
Australia: Australia:
● 17% YoY increase in St Ives’
7.5 6.9 Reserves net of depletion – largest
Reserve since 2011
● 19% YoY increase in Agnew’s
South South Reserves net of depletion
Africa: Africa:
31.5
West
29.8
West ● 3% YoY increase in Tarkwa’s
Africa: 6.4 Africa: 6.5
Reserves net of depletion
At end-2020, 20.5Moz of Gold Fields’ attributable gold equivalent Reserves (excluding Gold Fields’ 45% interest in the Asanko
Gold Mine) were outside South Africa, representing 39% of the Group’s Reserve base
Note: Group numbers do not include Gold Fields’ 45% interest in Asanko
Price assumptions for gold equivalent ounce calculation: Reserves: Gold: US$1,300/oz, Copper: US$2.8/lb, Silver: US$17.5/oz. Resources: Gold: US$1,500/oz, Copper: US$3.2/lb, Silver: US$20/oz
The metallurgical recovery rate has not been applied to the conversion
FY 2020 results | 18 February 2021 13Gold Fields’ Mineral Reserve growth
Six year track record (gold only managed net of depletion)
-4.5Moz correction
to South Deep
offset by maiden
Salares Norte
3.48Moz Reserve.
9% Reserve Growth over 5 years net of Depletion
FY 2020 results | 18 February 2021 14Organic growth potential
● Tarkwa: Step out potential from existing pits
● Damang: Main Damang pit and the greater lease
● Australia:
̵ Invincible complex plus historically mined areas
̵ Greater Agnew
̵ Granny Smith at depth (Z150)
̵ Gruyere – further pit extension, potential underground to be evaluated
● Cerro Corona: Beyond 2030
● Salares Norte: District potential
FY 2020 results | 18 February 2021 15Regional overviews
Australia
                                                                                                 2020    2019
                                      Att. Production                          koz               1,017   914
                                      AIC                                    US$/oz              957     986
           44% of Group managed
                                                                              A$/oz              1,388   1,418
           production
                                      Net cash flow*                          US$m               498     139
                                      Att. Gold equivalent Reserves           Moz                 7.5     6.9

                                     * Net cash flow excludes Gruyere project capital for 2019

      ● 11% year-on-year increase in gold produced driven by the first full year of Gruyere
        production – reached commercial levels of production at end-September 2019
      ● Renewable energy projects at Agnew, GSM and Gruyere
      ● Second decline to commence at Granny Smith
      ● Invincible orebody continues to grow at St Ives, both laterally and at depth
      ● Agnew is being configured for increased output over a longer life – first phase of plant
        expansion (crusher)
      ● Region generated net cash flow of US$498m (A$723m) in 2020

                                                            1Moz per year region

FY 2020 results | 18 February 2021                                                                               17
Peru
2020 2019
Au Eq production koz 207 293
Au Eq AIC US$/oz 1,119 810
Au only production koz 119 156
9% of Group managed Cu only production kt 25 31
production Au only AIC US$/oz 715 472
Net cash flow US$m 84 86
Att. Gold equivalent Reserves Moz 6.6 7.0
● Cerro Corona was significantly impacted by the COVID-19 pandemic during H1 2020
̵ Catch up in waste mining required at Cerro Corona in the coming year
● The impact of COVID-19 on gold equivalent production was 46koz for FY 2020
● In addition, the actual lower price factor had a negative impact of 22koz on gold equivalent
production the year compared to guidacne
● Looking at further life extension beyond 2030 with additional drilling planned for 2021
● Despite the challenges presented by COVID-19, Cerro Corona generated net cash flow of
US$84m in 2020, in line with 2019
● Increased stake in Chakana and agreement with Regulus Resources
Integrity of 2030 life extension plan intact
FY 2020 results | 18 February 2021 18West Africa
2020 2019
Production koz 862 840
37% of Group managed
AISC US$/oz 1,027 942
production
AIC US$/oz 1,060 1,039
Net cash flow* US$m 290 184
Att. Gold equivalent Reserves Moz 6.4 6.5
* Net cash flow includes Damang project capital and redemption of Asanko preference shares
Production and cost numbers include 45% of Asanko Gold Mine, Reserves exclude Asanko
● Mining in main Damang pit transitioned through the bulk of the Huni Sandstone during H1 2020
̵ Had a much stronger H2 2020, with mining taking place in the higher-grade, more consistent Tarkwa
Phyllites in the base of the pit
● At end-December, 48 months into the the Damang reinvestment Project:
̵ Tonnes mined were 14% ahead of plan
̵ Gold produced was 17% ahead of plan
● Tarkwa replaced depletion and slightly added to Reserves in 2020 – second consecutive year
● Region generated net cash flow of US$290m in 2020 (2019: US$184m)
● Studies on a further cutback at Damang have commenced
● More exploration potential at Tarkwa – 22km of down dip strike potential being evaluated
Significant organic growth potential
FY 2020 results | 18 February 2021 19South Africa
2020 2019
Att. Production koz 227 222
AISC US$/oz 1,237 1,259
AIC US$/oz 1,260 1,259
10% of Group managed Net cash flow US$m 34 15
production
Att. Gold equivalent Reserves Moz 31.5 29.8
● 1 Fatality during H1 2020: Mr. Abel Magajane
● Q2 2020 severely impacted by Covid-19 related restrictions meters/rig Key productivity metrics tonnes/rig
̵ Placed on care and maintenance 100 14 000
̵ 32koz lost during Covid-19 lockdown and ramp up 12 000
80
● Strong H2 performance after disruptions in H1 10 000
̵ South Deep would have exceeded original production guidance had it 60 8 000
not been for Covid-19
40 6 000
● Despite the Covid-19 interruptions, the mine managed to generate positive 4 000
cash flow of R558m (US$34m) during 2020, more than double that 20
2 000
generated in 2019
0 0
● c.30% year-on-year productivity improvement in destress
2018 2019 2020
● Improved compliance on stoping, up to c.90% Development Destress Stoping (rhs)
● Migration to North of Wrench from Current mine continued during 2020
● Gold production of 9,000kg (289koz) guided for 2021
20% - 30% increase in production over the coming years
FY 2020 results | 18 February 2021 20Outlook
2021 outlook and guidance

   2021 Group guidance
   ● Attributable equivalent gold production: 2.30Moz – 2.35Moz
   ● AISC: US$1,020/oz – US$1,060/oz
   ● AIC: US$1,310/oz – US$1,350/oz
   ● AIC (excl. Salares Norte): US$1,090/oz – US$1,130/oz
   ● Total capex: US$1,177m (Sustaining: US$538m, Non-sustaining: US$639m)

   Focus areas for 2021
   ● Continue to navigate Covid-19 – inherent unquantifiable risk
   ● Salares Norte: stick to project schedule during peak capex year (70% complete by year-end)
   ● Further embed productivity improvements at South Deep – production expected to increase
     28% YoY in 2021
   ● Continue to reduce net debt
   ● Commitment to maintain dividend policy

FY 2020 results | 18 February 2021                                                                22
Thank You QUESTIONS AND ANSWERS
You can also read