PI Financial Presents Lundin Group of Companies - January 14, 2021
←
→
Page content transcription
If your browser does not render page correctly, please read the page content below
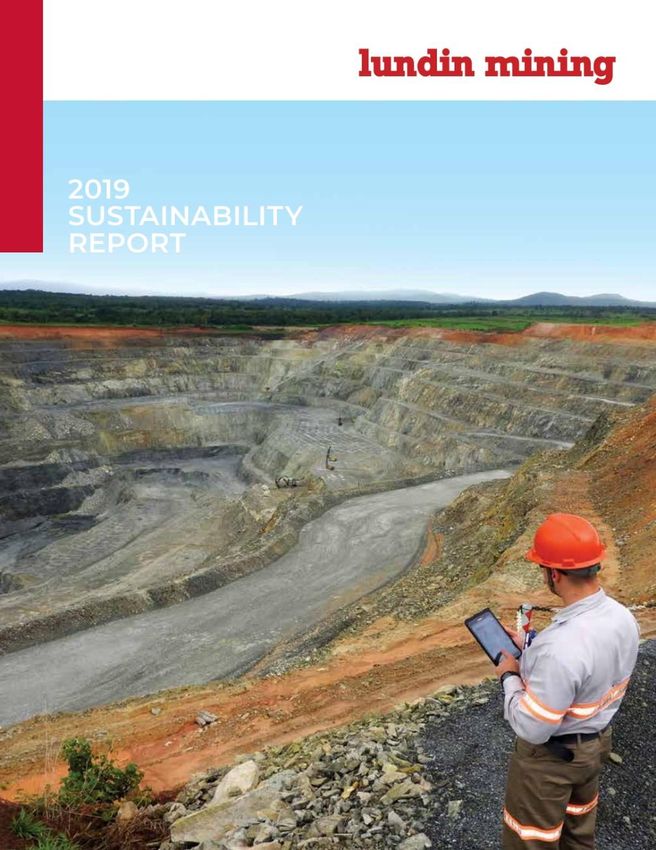
PI Financial Presents Lundin Group of Companies
                                              January 14, 2021

TSX: LUN Nasdaq Stockholm: LUMI                                            Candelaria, Atacama Region, Chile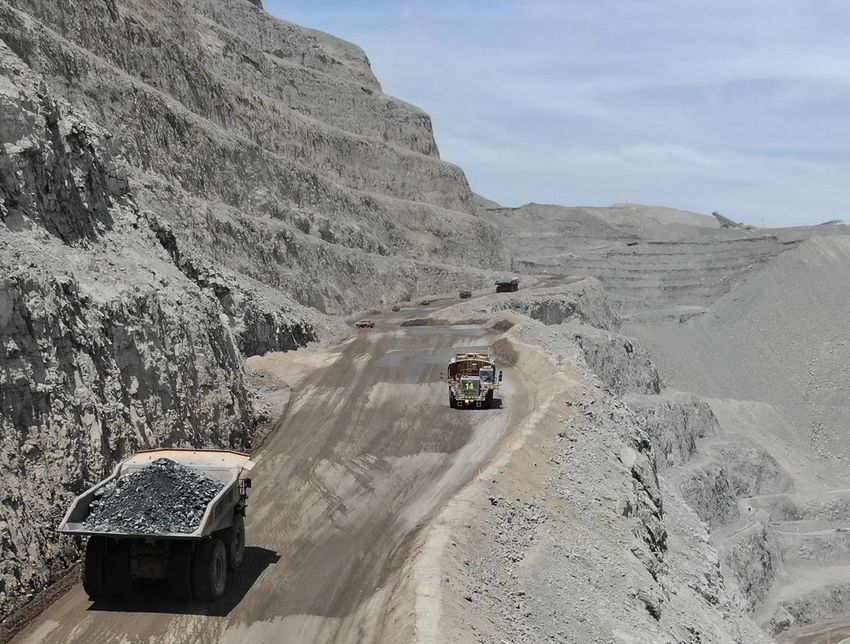
Cautionary Statements
Caution Regarding Forward-Looking Information and Non-GAAP Performance Measures
This document contains “forward-looking information” within the meaning of Canadian securities laws. All statements other than statements of historical facts constitute forward-looking
information, including but not limited to statements regarding plans, prospects and business strategies; timing and amount of future production; expectations regarding the results of operations
and costs; permitting requirements and timelines; timing and possible outcome of pending litigation or labour disputes; timing for any required repairs and resumption of any interrupted
operations; the results of any Feasibility Study, economic studies or Mineral Resource and Mineral Reserve estimations, life of mine estimates, and mine and mine closure plans; market prices of
metals, currency exchange rates, and interest rates; the ability to comply with permitting or other regulatory requirements; anticipated exploration and development activities; and the integration
and benefits of acquisitions. Words such as “believe”, “expect”, “anticipate”, “contemplate”, “target”, “plan”, “goal”, “aim”, “intend”, “continue”, “budget”, “estimate”, “may”, “will”, “can”, “could”,
“should”, “schedule” and similar expressions identify forward-looking statements. Forward-looking information is necessarily based upon various assumptions including, without limitation, the
expectations and beliefs of management, including that the Company can access financing, equipment and labour; assumed and future price of metals; anticipated costs; ability to achieve goals;
the effective integration of acquisitions; the political environment supporting mining projects; and assumptions related to the factors set forth below. While these factors and assumptions are
considered reasonable by Lundin Mining as at the date of this document in light of management’s experience and perception of current conditions and expected developments, these statements
are inherently subject to significant business, economic and competitive uncertainties and contingencies. Known and unknown factors could cause actual results to differ materially from those
projected. Such factors include, but are not limited to: volatility in commodity prices; global financial conditions; risks inherent in mining including but not limited to the environment, industrial
accidents, catastrophic equipment failures, unexpected geological formations or unstable ground conditions, and natural phenomena; uninsurable risks; equity markets volatility; outbreaks of
viruses and infectious diseases (such as COVID-19); negative publicity and reputation risks; reliance on a single asset; fraud and corruption risks; actual ore mined and/or recoveries varying from
estimates; risks associated with the estimation of Mineral Resources and Mineral Reserves and the geology, grade and continuity of mineral deposits; ore processing efficiency; foreign country
and emerging markets risks; security; taxation regimes; health and safety risks; exploration, development or mining results not being consistent with expectations; infrastructure risks;
counterparty and credit risks and customer concentration; environmental regulation risks; exchange rate fluctuations; stakeholder opposition; civil disruption; labour disputes or difficulties;
interruptions in production; uncertain political and economic environments; litigation; regulatory investigations, enforcement and/or sanctions; structural stability of waste rock dumps or tailings
storage facilities risks; changes in laws or policies; climate change; cybersecurity risks; estimates of future production, operations, capital and operating cash and all-in sustaining costs; permitting
risks; compliance with laws; mine closure risks; challenges to title; the price/availability of supplies or services; liquidity risks and limited financial resources; the estimation of asset carrying values;
risks relating to dividends; and other risks and uncertainties, including but not limited to those described in the “Risk and Uncertainties” section of the Annual Information Form and the
“Managing Risks” section of the Company’s MD&A for the year ended December 31, 2019 and the quarter end September 30, 2020, which are available on SEDAR at www.sedar.com under the
Company’s profile. All of the forward-looking statements made in this document are qualified by these cautionary statements. Although the Company has attempted to identify important factors
that could cause actual results to differ materially from those contained in forward-looking information, there may be other factors that cause results not to be as anticipated, estimated, forecast
or intended and readers are cautioned that the foregoing list is not exhaustive of all factors and assumptions which may have been used. Should one or more of these risks and uncertainties
materialize, or should underlying assumptions prove incorrect, actual results may vary materially from those described in forward-looking information. Accordingly, there can be no assurance
that forward-looking information will prove to be accurate and forward-looking information is not a guarantee of future performance. Readers are advised not to place undue reliance on forward-
looking information. The forward-looking information contained herein speaks only as of the date of this document. The Company disclaims any intention or obligation to update or revise
forward‐looking information or to explain any material difference between such and subsequent actual events, except as required by applicable law.

This presentation may contains certain financial measures such as adjusted earnings, adjusted loss, EBITDA, net cash, net debt, adjusted operating cash flow per share, co-product cash costs and
cash costs which have no standardized meaning within generally accepted accounting principles under IFRS and therefore amounts presented may not be comparable to similar data presented
by other mining companies. This data is intended to provide additional information and should not be considered in isolation or as a substitute for measures or performance prepared in
accordance with IFRS.

Note: All dollar amounts are in US dollars unless otherwise denoted.
                                                                                                                                                                                                              2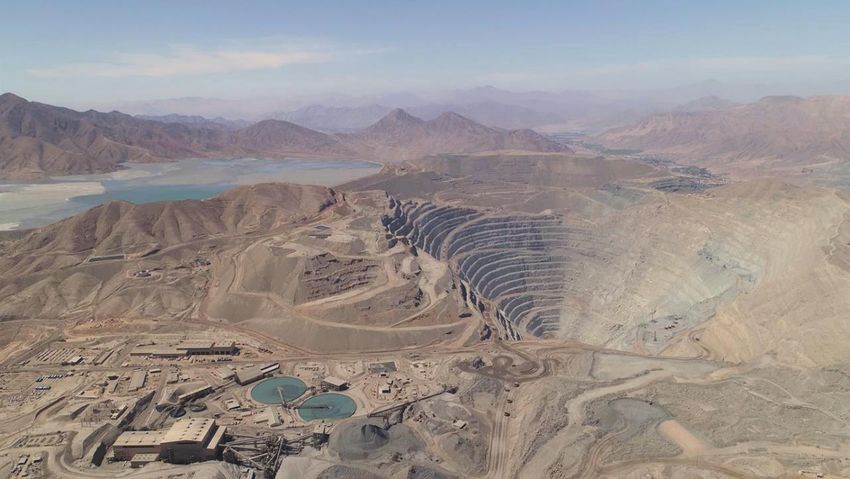
Lundin Mining
Our Strategy
Operate, upgrade and grow a base metals
portfolio that provides leading returns for our
shareholders throughout the cycle

  •    copper dominant - ~65-70% copper
  •    competitive cost position
                                                                                                                                          Eagle                                                                                                                  Zinkgruvan
  •    low-risk mining jurisdictions1                                                                                      Nickel-Copper-PGMs in U.S.A.                                                                                                   Zinc-Lead-Copper in Sweden

  •    pipeline of development and
       exploration projects
  •    low leverage and flexible balance
       sheet
  •    attractive direct shareholder returns

                                                                                                                                                                                                                                                                Neves-Corvo
                                                                                                                                                                                                                                                          Copper-Zinc-Lead in Portugal

                                                                                                   Candelaria2
                                                                                             Copper-Gold-Silver in Chile                                                                                            Chapada
                                                                                                                                                                                                               Copper-Gold in Brazil

1. Fraser Institute’s 2019 Annual Survey of Mining Companies Investment Attractiveness Rankings: Portugal 5 th, Sweden 10th, Chile 17th, and Brazil 46th of 76 jurisdictions included. The State of Michigan in the U.S.A. did not meet the minimum number of survey responses to be included in the 2019 report.
2. Lundin Mining holds an 80% interest in Candelaria
                                                                                                                                                                                                                                                                                                                    3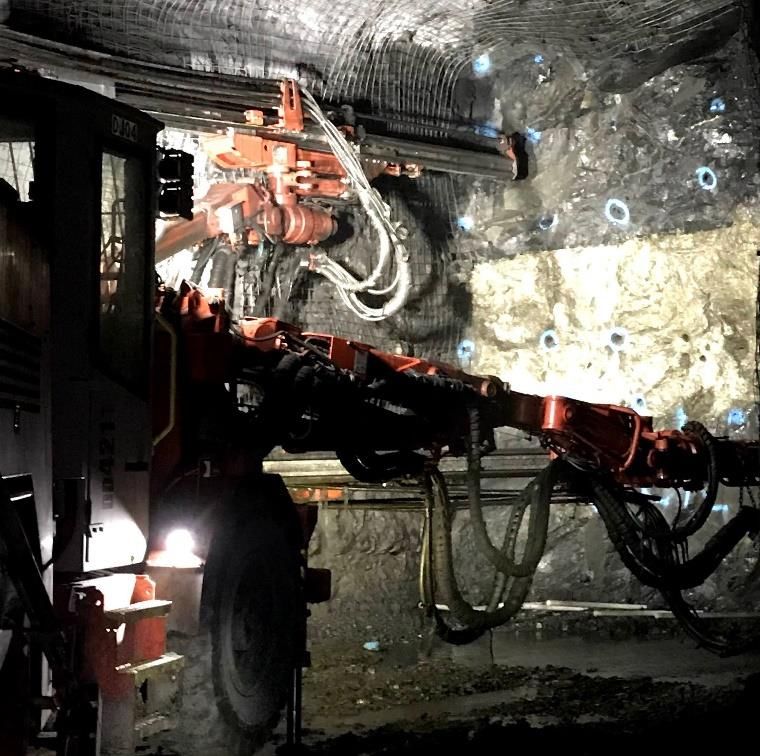
Responsible Mining
•   we recognize the important role of the metals we produce and are committed to
    mining these metals responsibly
•   Lundin Mining has been reporting on our sustainability performance in a
    comprehensive, standalone document since 2011
•   we have demonstrated sustainable improvements in our safety, environmental, social
    and operating performance over the past several years, and with focused disclosure in
    our Sustainability Report
•   since joining the United Nations Global Compact in 2016, we continue to commit to
    the initiative, documenting our support of the 10 Principles on human rights, labour
    standards, environment and anti-corruption, and the 17 Sustainable Development
    Goals, through an annual Communication on Progress

    2019 Highlights

                                                                                            https://www.lundinmining.com/responsible-mining/sustainability-reports/
                                                                                                                                                                      4
Notable Recent Events

                                                                                                                                                                                  Anticipated 50% Dividend Increase1
                                                                                                                                                                                    •     increase in the quarterly dividend to C$0.06 per common share,
                                                                                                                                                                                          C$0.24 annualized, anticipated to be declared in February 2021
                                                                                                                                                                                    •     expected increase reflects the strong free cash flow outlook
                                                                                                                                                                                          from current operations. Well positioned to enhance
                                                                                                                                                                                          shareholder returns with a progressive regular dividend

                                                                                                                                                                                  2021 Guidance & Three-Year Production Outlook1
                                                                                                                                                                                    •     copper production is forecast to increase over 25% in 2021
                                                                                                                                                                                    •     zinc production is forecast to increase 30% in 2022, over 2021, as
                                                                                                                                                                                          the Neves-Corvo Zinc Expansion Project completes its ramp up
                                                                                                                                                                                    •     gold production is forecast to be 175,000 oz at the midpoint of
                                                                                                                                                                                          2021 guidance. Nearly 110,000 oz are unencumbered

                                                                                                                                                                                  Full Production Capacity at Candelaria & Chapada
                                                                                                                                                                                    •     ramp up of Candelaria to full capacity began late November 2020
                                                                                                                                                                                          after reaching new collective agreements
                                                                                                                                                                                    •     Chapada returned to full processing capacity December 20, 2020
                                                                                                                                                                                          with installation of the remaining repaired motor on the ball mill

Candelaria open pit

1. Refer to news release “Lundin Mining Provides Operational Outlook & Shareholder Returns Update” dated November 30, 2020. A 50% increase in the quarterly dividend to C$0.06 per common share is anticipated to be declared with the release of 2020 full-year financial results in February 2021 pending
   approval by the Company’s Board of Directors.
                                                                                                                                                                                                                                                                                                              5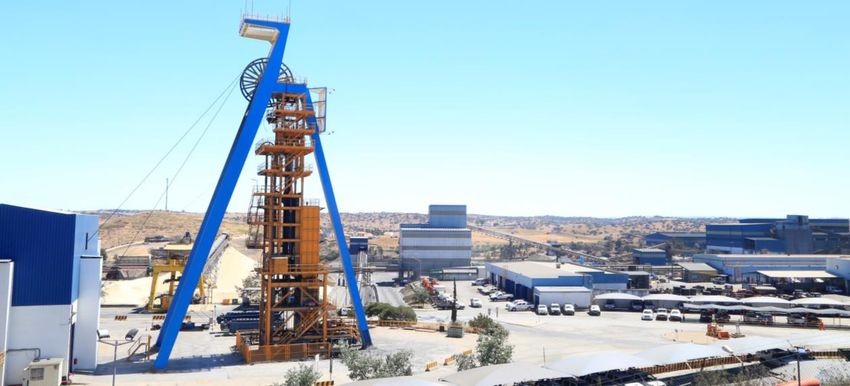
Increasing Production Profile1,2

                                      Copper                                                                                                          Zinc                                                                                                             Gold

                                                                                        300 kt                                                                                                   225 kt
                                                                                                                                                         +60%                                                                                                                                                175 koz

                                                                                        275 kt                                                                                                   200 kt
                          +30%

                                                                                                                                                                                                                                                                                                             150 koz
                                                                                        250 kt                                                                                                   175 kt
                                                                                                                                                                                                                                           ~110,000 oz of
                                                                                                                                                                                                                                           unencumbered
                                                                                                                                                                                                                                         production in 2021
                                                                                        225 kt                                                                                                   150 kt

                                                                                                                                                                                                                                                                                                             125 koz

                                                                                        200 kt                                                                                                   125 kt

                                                                                        175 kt                                                                                                   100 kt                                                                                                      100 koz
      2020                 2021                 2022                 2023                                           2020                2021                2022               2023                                                  2020               2021               2022               2022

1. Production profile based on certain estimates and assumptions, including but not limited to; Mineral Resource and Mineral Reserve estimates geological formations, grade and continuity of deposits and metallurgical characteristics. The 2020 guidance is as most recently revised by news release on
   October 28, 2020 and further updated for the Candelaria operation by news release on November 30, 2020. The 2021-2023 guidance was announced by news release on November 30, 2020.
2. Currently, 68% of Candelaria’s total gold and silver production are subject to a streaming agreement. Chapada’ s gold production is unencumbered.
                                                                                                                                                                                                                                                                                                               6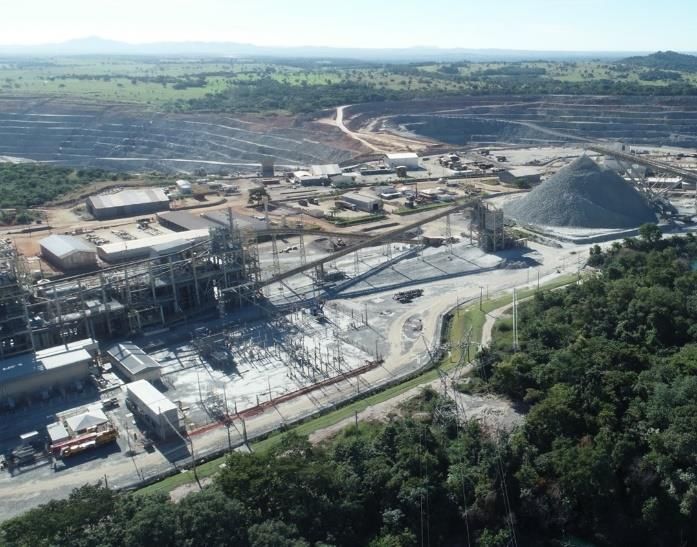
Candelaria

Increase in Production and Reduction in Cash Costs
                                                                                                                 Copper, Gold Production & Cash Costs1 Outlook
•    copper production forecast to increase nearly 45% in 2021, over the impacted-2020,                               (100% basis; kt Cu, koz Au & $/lb Cu, net of by-product credits)
     primarily on improving copper head grades and achievement of planned processing rates
•    safe ramp up to full capacity after reaching new collective agreements with all unions
     representing employees in December 2020
                                                                                                                                                                            180-190                     180-190
•    replacement of remaining ball mill motor completed in December 2020. Candelaria Mill                                                        172-182
     Optimization Project (CMOP) is now 100% complete
•    copper production to increase to 172,000-182,000 t in 2021 at cash costs of $1.35/lb of
     copper, net of gold and silver by-product credits
•    over next ten years copper production forecast to average nearly 180,000 tpa                                    120-125
                                                                                                                                                                                                                      110-115
•    long operational life of +20 years with clear exploration potential to further extend
                                                                                                                                                               95-100                       95-100

                                                                                                           2.4                     70-75
Improved Throughput to Achieve                                                   2.3          2.3
                                                                                                     2.3
Production Growth                                                                                                           $1.50
                                                                                                                                                        $1.35
 •   ore milled increased nearly 20% in Q3/20                 2.0
     over H1/20 average                                                                 2.0

                                                                    1.9
                                                        1.8                                                                  2020                       2021                        2022                       2023
 •   Q1-Q3/20 production of 107,193 t of                                   1.8

     copper and 63,000 oz of gold at cash costs
     of $1.34/lb of copper                                                                                                                                         Copper               Gold

                                                                                                                 1. Currently, 68% of Candelaria’s total gold and silver production are subject to a streaming agreement and as such C1
                                                        Jan   Feb   Mar    Apr   May    Jun   Jul   Aug    Sep      cash costs guidance is based on receipt of $412/oz and $4.12/oz, respectively, in 2020 and $416/oz and $4.16/oz,
                                                                                                                    respectively, in 2021 on the streamed portion of gold and silver sales.
                                                                          Tonnes Milled (Mt); 2020 YTD

                                                                                                                                                                                                                                          7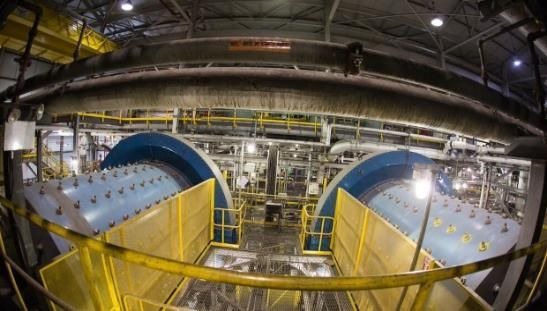
Chapada
Strong Operational Performance Continues
•       returned to full processing capacity following the installation of the remaining repaired                                                        Copper, Gold Production & Cash Costs1 Outlook
        motor on the ball mill on December 20, 2020                                                                                                           (100% basis; kt Cu, koz Au & $/lb Cu, net of by-product credits)
•       processing plant achieved approximately 35% of nameplate capacity while operating only
        the SAG mill and throughput further improved mid-November 2020 with the installation
        of a single motor on the ball mill
                                                                                                                                                                              85-90
•       copper production forecast to increase to 48,000-53,000 t in 2021 at cash costs of
                                                                                                                                                                                                        75-80
        $1.10/lb of copper, net of credits from 75,000-80,000 oz of gold
                                                                                                                                                                                                                                   67-72                      65-70
•       all gold production remains unhedged and receives full market pricing
•       Q1-Q3/20 production of 38,670 t of copper and 65,000 oz of gold at first-quartile copper                                                                                                                        53-58
                                                                                                                                                                                                                                                   50-55
        cash costs of $0.44/lb. One of the lowest cost open pit copper mines in South America2                                                                     45-50                     48-53

Exploration Advancing Well
& Expansion Studies Underway
                                                                                                                                                                                                     $1.10
    •    60,000 m drilling campaign and $8M                                                                                                                              $0.55
         exploration budget in 2021
    •    expansion studies ongoing to optimize
         value and near-mine exploration                                                                                                                                  2020                      2021                       2022                      2023
    •    +30-year operational life based on
         current throughput capacity of 24 Mtpa                                                                                                                                                          Copper               Gold

                                                                                                                                                   1.   Chapada cash costs are calculated on a by-product basis and do not include the effects of its copper stream agreements. Effects of the
                                                                                                                                                        copper stream agreements are reflected in copper revenue and will impact realized price per pound.

                                                                                                                   Chapada processing facilities
2. According to Wood Mackenzie Q3 2020 data set sort for primary copper open pit sulphide mines in South America                                                                                                                                                                    8
Neves-Corvo
Zinc Expansion Project Officially Restarted January 2021
 •   ZEP to double current zinc production capacity and improve per unit operating costs
 •   mobilizing a smaller number of contractors with an extended schedule given the                 Copper, Zinc Production & Cash Costs Outlook
     current safety requirements for social distancing and other personnel limitations                          (kt & $/lb Cu, net of by-product credits)

 •   construction is to be completed in stages over the course of 2021 with production ramp
     up planned to commence in Q4/21
 •   pre-production capital cost estimate of $430M (€360M) remains unchanged with $70M
     estimated to be capitalized in 2021 and the remaining $30M in 2022 to complete                                                                         145-155
 •   zinc production forecast to increase 66% in 2022 to 115,000-125,000 t as production
     ramp up is completed in H1/22                                                                                                          115-125

 •   +10-year mine life based on expanded ZEP throughput capacity with significant
     potential to extend mine life

                                                                                                               70-72           70-75

                                                                                                                       35-40                          33-38
                                                                                                       32-34                            30-35

                                                                                                          $2.10           $2.20

                                                                                                          2020            2021             2022             2023

                                                                                                                               Copper      Zinc

                                                                                                                                                                      9
                                                                            Neves-Corvo headframe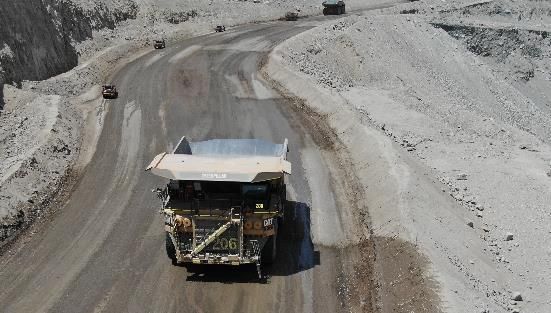
Zinkgruvan

Positioned for Strong Start to 2021
 •   plans call for mining of high-grade stopes driving increased zinc production into 2021               Zinc Production & Cash Costs Outlook
 •   zinc production forecast to increase to 71,000-76,000 t in 2021 at cash costs of                           (kt & $/lb Zn, net of by-product credits)
     $0.65/lb of zinc, net of lead and copper credits
 •   Q1-Q3/20 production of 48,923 t zinc and 3,346t of copper
 •   cash costs remained stable and favorable at $0.54/lb in first three quarters of 2020
                                                                                                                                                        76-81

                                                                                                                          71-76
                                                                 Underground                                72-74
                                                                                                                                         68-73
                                                                 Exploration Advancing
                                                                 •   continuous production since 1857
                                                                 •   +10-year mine life with potential
                                                                     to extend mine life on Mineral
                                                                     Resource conversion
                                                                                                                          $0.65
                                                                 •   exploration drilling from              $0.60
                                                                     underground continues
                                                                 •   focus is on the extension of Dalby
                                                                     and area between Burkland and
                                                                     Nygruvan orebodies                     2020          2021           2022               2023
                                                                 •   2021 exploration expenditure
                                                                     guidance of $6M with 27,000 m of
                   Zinkgruvan mill operator and summer student       drilling planned

                                                                                                                                                                   10
Eagle
To Continue to Generate Impressive Free Cash Flow1
• first-quartile cash costs with minimal Nickel, Copper Production & Cash Costs Outlook
capex to continue through 2025 (kt & $/lb Ni, net of by-product credits)
• nickel production increased nearly 45%
and copper over 25% in Q3/20
compared to Q2/20 on increasing
Eagle East ore grades and metal
17-20 17-20
recovery 17-19 15-18
15-18 15-18
• Q1-Q3/20 production of 11,809 t of 13-16
nickel and 13,535 t of copper at first- 12-15
quartile cash costs of $0.51/lb nickel
• impressive negative $0.63/lb nickel
cash costs in Q3/20
$0.50 $0.50
• $81M of FCF in first three quarters of
2020, including $27M of FCF in Q3/20
• production guidance of 15,000-18,000 t
of nickel and 17,000-20,000 t of copper
in 2021 at cash costs of $0.50/lb of
nickel 2020 2021 2022 2023
Eagle East high grade massive sulphide seam of
• 2021 capital expenditures expected to approximately 7.5% nickel and 5% copper
be minimal, forecast at $15M Nickel Copper
1. Free Cash Flow (FCF) is a non-GAAP measure defined herein as cash flow from operations less sustaining capital expenditures.
112021 Guidance Summary1
Production C1 Cash
(contained metal in conc.) Cost2 Capital Expenditures ($M)
Copper (t) Candelaria (100%) 172,000 - 182,000 $1.353 Sustaining
3
Chapada 48,000 - 53,000 $1.10 Candelaria (100% basis) 345
Eagle 17,000 - 20,000 Chapada 65
Neves-Corvo 35,000 - 40,000 $2.203
Eagle 15
Zinkgruvan 3,000 - 4,000
Neves-Corvo 65
Total 275,000 - 299,000
Zinkgruvan 50
Zinc (t) Neves-Corvo 70,000 - 75,000 Total Sustaining 540
3
Zinkgruvan 71,000 - 76,000 $0.65
Total 141,000 - 151,000 ZEP (Neves-Corvo) 70
Total Capital Expenditures1,2 $610M
Gold (oz) Candelaria (100%) 95,000 - 100,000
Chapada 75,000 - 80,000
Total 170,000 - 180,000
• $40M to be invested in 2021 exploration programs
Nickel (t) Eagle 15,000 - 18,000 $0.50 • over 140,000 m of drilling planned with focus on in and
near-mine targets
Total 15,000 - 18,000
1. Guidance as announced by news release November 30, 2020.
2. Cash costs are based on various assumptions and estimates, including but not limited to production volumes, as noted above, commodity prices (2021 – Cu: $2.95/lb, Zn: $1.00/lb, Pb: $0.85/lb, Au: $1,700/oz and Ag: 16.00/oz), foreign exchange rates (2021 –
€/USD:1.20, USD/SEK:8.50, CLP/USD:675 and USD/BRL:4.75) and operating costs.
3. 68% of Candelaria’s total gold and silver production are subject to a streaming agreement and as such C1 cash costs are calculated based on receipt of $416/oz and $4.16/oz, respectively, on gold and silver sales in the year. Silver production at Zinkgruvan
and Neves-Corvo are also subject to streaming agreements, and cash costs are calculated based on approximately $4.40/oz and $4.30/oz. Chapada cash costs are calculated on a by-product basis and do not include the effects of its copper stream
agreements. Effects of the copper stream agreements are reflected in copper revenue and will impact realized revenue per pound.
12Lundin Mining
High Quality Meaningful Scale
Financial Strength
Competitive Mines Growth Oriented
• demonstrated operational excellence and • increasing copper, zinc and gold production • proven track record for rigorous investment
culture of continuous improvement profiles approach, focused on value creation
• low-risk mining jurisdictions • exploration upside and high-value • strong balance sheet with low leverage
expansion projects underway
13www.lundinmining.com | TSX: LUN | Nasdaq Stockholm: LUMI
You can also read


