Energy Consumption Analysis in Katsuwonus Pelamis sp. Freezing and Storaging Process
←
→
Page content transcription
If your browser does not render page correctly, please read the page content below
E3S Web of Conferences 232, 03017 (2021)                                 https://doi.org/10.1051/e3sconf/202123203017
IConARD 2020

      Energy Consumption Analysis in Katsuwonus
      Pelamis sp. Freezing and Storaging Process
      Khalif Ahadi1, Guntur Tri Setiadanu1,*, Yohanes Gunawan1, Subhan Nafis1, Dedi Suntoro1
      1 Renewable   Energy and Energy Conservation Technology (P3tek KEBTKE), Ministry of Energy and
          Mineral Resources (KESDM), Bogor, 16340, Indonesia

                    Abstract. A fresh fish has a short limited fresh time without treatment. To
                    maintain quality and prevent spoilage, several treatments are carried out
                    especially using a cooling method. In the fish storage industry, most energy
                    consumed by cooling equipment. With the rising of energy prices, the frozen
                    fish industries are looking for possibilities to reduce production costs by
                    saving energy. Energy-saving assessment can be seen from the specific
                    energy consumption (SFC) which is a comparison of the amount energy
                    needed to produce a product (kWh/ton of product). This article will be
                    discussed about data collection and analysis to get the value of SFC for
                    process and storage in the fish freezing and storage services industry. The
                    measurement result shows that the value of SFC for cold storage are 4.2
                    kWh/ton. The SFC used by the air blast freezer (ABF) with 5 tons capacity
                    are 91 Wh/kg. The consumption of electrical energy in ABF is strongly
                    influenced by matched between the capacity specifications of ABF and the
                    number of fish to be cooled. If the 5 tons ABF is only filled less than 2 tons
                    of fish, the SFC will increase more than 50% up to 145 Wh/kg.

      1 Introduction
      Based on data released by the Food and Agriculture Organization (FAO) in 2016, the average
      capture fisheries production from 2003-2012 compared to 2013-2014, Japan fell 12.5% and
      South Korea fell 1%. Meanwhile, in the same period, Indonesian fisheries production
      increased by 26.8% [1]. However, Indonesia has not been included in the top 10 fish
      exporting countries in the world [2]. This is partly due to the way of handling and processing
      fresh fish after catch has not met the criteria needed by export consumers.
          Fresh fish contains up to 80% water and is highly perishable so it has a short limited fresh
      time. If fresh fish is not immediately used or processed into finished products, it will become
      waste [3] The fishery products are usually more quickly damaged when compared with the
      other muscular meat products. Freshly caught fish will changes in quality due to autolysis
      and bacterial activity. This rate of change determines shelf life. Proper storage conditions are
      very important to prevent spoilage of fishery products [4]. To maintain quality and prevent
      spoilage, several treatments were carried out including using high pressure processing,
      irradiation, microwave, ultrasound processing, vacuum packaging, also the use of enzymes

      *
          Corresponding author: guntur.setiadanu@gmail.com

© The Authors, published by EDP Sciences. This is an open access article distributed under the terms of the Creative Commons
Attribution License 4.0 (http://creativecommons.org/licenses/by/4.0/).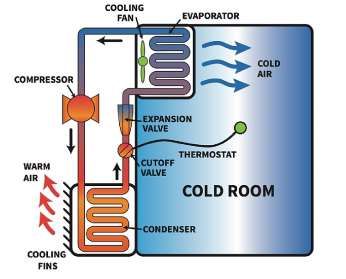
E3S Web of Conferences 232, 03017 (2021)                          https://doi.org/10.1051/e3sconf/202123203017
IConARD 2020

      [5]. In addition, there are other methods that are widely used and simple, such as drying,
      fuming, salting and cooling.
          The food processing industry is a significant user of water, energy and packaging
      materials, and also produces large amounts of waste and emissions. In the UK, the
      greenhouse gas footprint in the food industry is responsible for around 13 MtCO 2e (million
      tons CO2 equivalent) and the main energy consumption of 42 TWh [3]. Typically, in the food
      industry, around 68% of energy is used by direct heating systems, 16% is electrical energy
      used by electric motors, 8% is used by electric heaters, 6% by cooling equipment and the
      remaining 2% by air compressors [5]. But in the fish processing and storage industry, almost
      all of energy is consumed by cooling equipment.
          Energy utilizations in fish processing plants are dominated by refrigeration and freezing
      facilities. About 80% of electricity consumed at the plant is provided for refrigeration
      compressors in freezing and storage facilities. Energy is also needed for cooling the
      production room [6]. The equipment includes air blast freezer (ABF) and cold storage (CS).
      At ABF, high-speed air at temperatures around -30OC is exhaled on top of the product. The
      velocity of air to freeze fish is between 2.5 and 7.5 m/s. High speed can result in faster
      freezing but also higher unit freezing costs and dehydration in the untreated fish [7].
          In general, CS chiller consists of 3 main components as shown in Figure 1, namely:
      condensing unit (compressor and evaporator); air condenser; fan condensing unit (FCU)
      blower; and expansion valve. Components that consume electricity are compressors, air-
      cooling blowers, FCU blowers. The compressor works intermittently based on pressure and
      temperature settings, the air cooler blower works intermittently following the compressor,
      and the FCU blower works continuously.
          Cold storage volume has a significant impact on energy use. For chilled CS, 93% of
      energy use is related to storage volume. For frozen CS, 56% of energy is related to storage
      volume, while for the combination of both CS, 67% of energy consumption is related to
      volume. Cold storage form factors and surface area, ways of use, and environmental
      conditions can influence energy consumption [8].

      Fig. 1. Components and refrigeration piping systems in cold storage [9]

         Based on research others research, Murtono, 2014 said that for CS with a capacity of up
      to 123.5 tons in normal operation has a cooling load of around 82,717.32 Btu/hr [10].
      Meléndez-Pérez, 2011 said that the freezing thermal profile without opening the door shows

                                                       2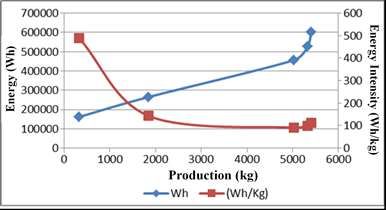
E3S Web of Conferences 232, 03017 (2021)                      https://doi.org/10.1051/e3sconf/202123203017
IConARD 2020

     typical freezing behavior with a total time about 242 minutes: 23 minutes for adjustment, 61
     minutes to the zone of phase change and crystal growth, and 159 minutes to sub cooling [11].
         With the rising of energy prices, producers are looking for opportunities to reduce costs
     without affecting quality. Investment in energy saving technology can make a significant
     contribution to the reduction of production costs [5]. Energy saving performance can be seen
     from the specific energy consumption or energy consumption intensity which is a comparison
     of the amount of energy needed to produce a product [12-13]. Specific energy consumption
     is used as a measure of energy savings. In Indonesia, the calculation of the value for specific
     energy consumption has not been done much, including for fish processing. This is different
     from other countries. Based on studies that have been carried out in Vietnam, specific energy
     consumption in processing fresh fish is around 400 kWh / ton, or 1400 kWh / ton fish fillets
     [6]. As a comparison, generally for the salmon processing industry in 2015 in Norway
     requires energy around 85.1 kWh/ton to 105.7 kWh/ton [14]. Globally, the average fish
     freezing process requires around 120 kWh/ton of energy, and for storage process around 20
     kWh/ton [15].
         The purpose of this study was to determine the specific energy consumption (SFC) in fish
     processing, freezing and storage in one of the fish processing service industries in Sidoarjo –
     East Java. Skipjack (katsuwonus pelamis sp.) is one of the most widely caught and produced
     fish in Indonesia. There is no literature that shows the value of SFC in the production process
     of freezing skipjack fish in Indonesia. So it is difficult to reduce energy consumption in the
     production process. By knowing the specific energy consumption, energy saving evaluation
     can be taken by the plant manager.

     2. Materials and Methods
     The data measurement is carried out at PT. Jala Lautan Mulia (JLM), one of the refrigerated
     fish processing, freezing and storage industry. Primary data collection is done by direct
     observation and measurement without disrupting the production process. In this case, the fish
     produced are frozen skipjack (katsuwonus pelamis), weighing around 300-600 gr.
         Measurements were made to obtain electrical parameters as well as temperature
     parameters as the objective value of the cooling work. The Hioki 3197 power quality analyser
     is mounted on the electrical load panel with data sampling every 30 minutes. There are 2 load
     panels, namely panel 1 which supplies cold storage and air conditioner for the production
     room, and panel 2 which supplies ABF. Measurements were made for 1 week. Cold storage
     and ABF room temperature measurements were performed using a thermocouple connected
     to the Graphtec GL7000 data logger. Whereas secondary data is obtained from the
     production’s log sheets. The analysis was carried out to get the value of specific energy
     consumption in the fish freezing process.

     3. Result and discussion
     The process of fish freezing and storage process at PT. JLM complies with Indonesian
     national standard, SNI 4110-2014 which regulates frozen fish process. This is shown in
     Figure 2 [16].
         At PT. JLM, the fish received have been weeded. This raw material then washed again,
     and weighed. The next process is packing to maintain the water content of the fish. Some
     consumers choose vacuum packaging. After that, the fish is placed on a rack to be put into
     ABF. The next process, the fish are stored in CS.

                                                    3
E3S Web of Conferences 232, 03017 (2021) https://doi.org/10.1051/e3sconf/202123203017
IConARD 2020
Fresh fish Sorting Washing Gillet/Gutting
Washing Weighing Stacking in Pan Frozen glazing
Packaging & Labeling Frozen fish storage
Fig.2. Flow process of frozen fish production [16]
Cold storage room is supported by two CS machines which are used to maintain two
interconnected cooling rooms. This means that the 2 machines work simultaneously to
maintain room temperature. At the time of measurement, CS is used to store about 150 to
170 tons of product, varying according to product entry and exit. For example, full one day
measurement chart is taken, as shown in Figure 3. Based on the temperature graph, the same
operating pattern of CS every day can be divided into two zones. Zone 1 is a ‘production
zone’ between 08:00~17:00. This is indicated by the temperature fluctuations in the cold
room due to opening and closing the door when mobilizing the product. Zone 2 is a ‘storage
zone’ between 17:00~08:00, which shows the temperature becomes more stable,
corresponding with the engine's work cycle.
The compressor works by regulating the refrigerant pressure and temperature, which is a
representation of the temperature inside CS. The compressor works in temperature range of
-15OC to - 17.8OC, meaning that if the CS room temperature is above -15OC then the
compressor and blower air cooler will work until it reaches a temperature of -17.8OC then
return to stand-by conditions. The FCU blowers work continuously to deliver cold from the
refrigerant to CS room.
3.1 Cooling Storage (CS) Energy Consumption
3.1.1 Electricity Consumption of CS during Production Zone
The pattern of cold storage operation showed in Figure 3 and calculation of the amount of
energy used during the production zone can be seen in Table 1. During full load, compressors
and blowers work continuously, this is due to the opening and closing of doors when
mobilizing products and increases the temperature room to exceed -150C. During the
production zone, the compressor starts up 3 times, once at the start of production and 2 times
during recess. The startup process is a momentary process (in micro seconds) that requires
high power. High instantaneous power consumption at the start-up process causes the need
for electric power subscriptions are higher than the power requirements needed.
Fig. 3. The pattern of cold storage (CS) operations at PT. JLM
4E3S Web of Conferences 232, 03017 (2021) https://doi.org/10.1051/e3sconf/202123203017
IConARD 2020
Table 1. Work cycle of CS machines in the production zone (08:00 - 17:00)
Power (W) Avg. Energy
Process Duration
(max-min) (Wh)
Start up < 1 sec 72800 ~ 67000
Full running (compressor + 08:00~12:00
blower are on) 33500 ~ 31700 32600
14:00~17:00
Break time (2 x start up) 12:00~14:00 36700 ~ 31100 33900
Total energy cold storage at production zone (32600 X 7) + (33900 X 2)
(Full run + breaktime) = 228200 + 67800
= 296000 Wh*
*) The average kWh method here is only a rough depiction of the kWh calculation that occurred,
while the real kWh that occurred will be presented at Table 3 below, as confirmation of this
calculation.
3.1.2 Electricity consumption of CS during the storage zone
Storage zone is CS that work after production time (Table 2) which is the machine cycle to
maintain the temperature in the CS chamber. In this condition, the compressor and air cooled
blower only work when the temperature rises to higher than -15OC and only works to reduce
the temperature in a range that is less than about 3OC to reach the targeted temperature of -
17.8OC. This makes the workload of the compressor and blower air cooler not too large, so
the electricity consumed is not as high as during the production zone.
Table 2. Work cycle of CS machines outside the production zone (17:00 - 08:00)
Power (W)
Process Duration
(max-min)
Temperatur cooling after production 17:00~22:00 35500 ~ 11600
zone
Keeping targeted temperatur 22:00~08:00 33100 ~ 4600
Start up (occur eleven times, < 1s 76700 ~ 52000
compressor & blower)
Table 3. Actual electrical energy measurement results on panel 1 for cold storage
Storage Zone Production Zone
Notes
Date (17:00~08:00) (08:00~17:00)
17:00 8:00 Energi (Wh) Energi (Wh)
Sept, 27~28th 210500 615500 405000
Sept, 28~29th 913900 1338900 425000 298400
Sept, 29~30th 1633200 2049800 416600 294300
Sept, 30th~Oct,1st 2344300 2700700 356400 294500
Oct, 1~2nd 2969800 3230700 260900 269100 holiday
Oct, 2~3rd 3531200 3825100 293900 300500
Oct, 3~4th 4118200 4476900 358700 293100
Oct, 4~5th 4777900 5109000 331100 301000
3.1.3 Electricity consumption per day of cold storage
Based on the measurements that have been made, it is obtained the value of electrical energy
consumption (kWh) recorded every hour. With reference to the predetermined cycle, the
amount of energy consumption in the production zone (between 08: 00 ~ 17: 00) and the
storage zone (between 17: 00 ~ 08: 00) is shown in Table 3. The measurement results show
5E3S Web of Conferences 232, 03017 (2021) https://doi.org/10.1051/e3sconf/202123203017
IConARD 2020
the highest value of electrical energy consumption when production is 301 kWh on October
4 and the lowest value is 293.1 kWh on October 3. The average value of electricity
consumption outside of holidays when the production zone is around 296.9 kWh This
confirms the value of energy consumption from the average cycle calculation in Table 1 is
acceptable.
For the amount of electricity in the storage zone, there is a difference in the average
energy consumption between September 27-30 and the later date. The calculation result of
the average energy consumption of kWh on September 27-30th is 415,555 kWh while for the
following day the average is 335,025 kWh, excluding holidays. In storage zones, the most
influential variable is the number of products stored. Due to the lack of detail of the amount
and time of product entry and exit from CS, the analysis is based on the assumption of
maximum and minimum data stored products (between 150 ~ 170 tons). The difference in
power measurements at that date is assumed to be the difference in the number of products
stored in CS, namely that on Sept, 27-30th, the amount reaches a maximum of 170 tons, then
on the next date the product is released so that the amount is reduced to 150 tons. While the
average value of 1 week for storage zones is 375.29 kWh.
Based on these results, the average energy usage per day (24 hours) for CS can be
calculated: the average amount of energy production zone + average amount of energy
storage zone = 296.9 + 375.29 kWh = 672.19 kWh during the day of operation, and for
holidays measured 260.9 + 269.1 = 530 kWh. If the assumption is taken that the average
number of stored products is 160 tons, then the specific energy consumption is 672.19 kWh
/ 160 tons = 4.2 kWh / ton.
3.2 Air Blast Freezer (ABF) Energy Consumption
The analysis carried out is a function of the number of production and cooling cycles. With
the limitation of detailed production data per day, the analysis was carried out at Sept, 27,
28, 30th and Oct, 3rd. On these dates, the amount of production data and information about
ABF was completely obtained.
Just like CS, ABF also consists of compressors, air cool blowers and evaporator blowers
and valve expansion. The difference is that ABF works to catch up to the target temperature
as soon as possible. However, the compressor cannot go directly to the target temperature,
but rather has to be done in several cycles of the compressor working. For example, an
analysis of ABF's work was conducted on 27-30 September with a product in the form of
5024 kg of tuna and a target air temperature of -25OC or around -30OC on the product. The
ABF used is ABF #2, work cycle start at 14:30 and ends at 10:30 the next day or about 20
hours. The compressor works to suppress the coolant every six hours with a working time of
about 15 minutes. The maximum electrical power reaches around 33 kW so that the average
energy while the compressor is working is 25,100 Wh. In one cycle there are 5 times the
compressor start-up. After that the compressor stops working, but the blower stays on and
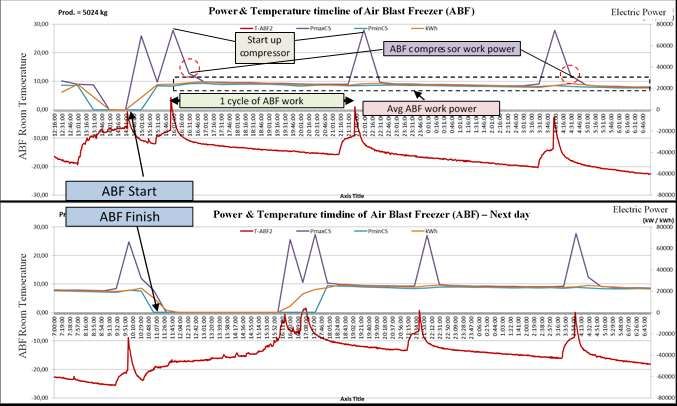
the ABF works in steady run condition. Figure 4 shows the ABF operating pattern.
Table 4 shows the ABF 2 work cycle calculation. Under steady run conditions, when only
the blower is on, the average energy needed is 21,550 Wh. Thus, in one ABF work cycle on
that date requires around 436.6 kWh of energy. The results of this calculation will be
confirmed by the results of the energy measurements presented in Table 5. The energy
measurement cycle in Table 5 is adjusted to the graph reading in Figure 4.
6E3S Web of Conferences 232, 03017 (2021) https://doi.org/10.1051/e3sconf/202123203017
IConARD 2020
Fig. 4. Operating pattern of air blast freezer (ABF) at PT. JLM
Table 4. Work cycle of the ABF #2 engine (14:30 - 10:30) on Sept, 27 ~ 28th
Power (kW) Avg. Energy
Process Duration (max-min) (Wh)
Start up compressor < 1 sec 74800 ~ 69200
Running compressor 5 x 20 min 26100 ~ 24300 25100
(compressor& all blower on)
Steady run (only blower on) 14:30~10:30 (minus 23400 ~ 19700 21550
compressor run time)
Total energi (kWh) of ABF at production zone (1 cycle of = (25100 X 1,6) + (21550 X 18,4)
ABF working time) = 40160 + 396520 = 436680 Wh
= 436.6 kWh*
*) The average kWh method here is only a rough depiction of the kWh calculation that occurred, while
the real kWh that occurred will be presented below at Table 5, as confirmation of this calculation.
Table 5. Electrical energy measurement results in panel #2 ABF.
Cycle of ABF #2 Prod. Energy
Date Energi Qty Intensity Notes
Start (Wh) Stop (Wh) (kg) (Wh/kg)
(Wh)
Sept, 27~28th 14:30 28400 10:30 484700 456300 5024 90.82
Sept, 28~29th 16:00 486800 16:00 1013600 526800 5325 98.93
Sept, 30th ~ 11:30 1020500 14:00 1622300 601800 5405 111.34
Oct, 1st
Oct, 1~2nd 0 0 0.00 Holiday
Oct, 2~3rd 0 5124 0.00 use ABF#1
Oct, 3~4th 13:00 1663700 1:00 1928600 264900 1852 143.03
4~5 Okt 16:30 1959200 0:30 2121100 161900 331 489.12
7E3S Web of Conferences 232, 03017 (2021) https://doi.org/10.1051/e3sconf/202123203017
IConARD 2020
It can be seen from Table 5 that ABF's work is very much determined by the amount of
products cooled, the more products that are cooled, the energy consumption will increase.
However, the lowest value of energy intensity is achieved when production is around 5,000
kg as shown in Figure 5. For production below and above 5,000 kg, the energy needed is
greater. When the production is around 5,000 kg, the specific energy consumption reaches
around 91 Wh / kg, while for the production of around 5,300 - 5,400 kg, the specific energy
consumption increases to 105.1 Wh / kg. Likewise if the production is only around 2,000 kg,
the specific energy consumption reaches 145 Wh / kg. For 1,000 kg of production, it will be
increasingly inefficient with specific energy consumption reaching 250 Wh / kg.
Fig. 5. Graph of energy consumption vs production
Based on the results of the discussion above, the steps that need to be taken by the plant
manager to increase electrical energy savings include:
The use of variable frequency drive [17-19] to regulate the electric motor driving the
compressor on CS and ABF when the load is not full.
Using a soft starter to reduce peak flow at start-up [17, 19], can be used to reduce the
electric power subscriptions from PLN.
The pattern of cold storage operations can be optimized by determining more effective
product transfer procedures to reduce CS doors opened and closed repeatedly.
The use of ABF is better operated with a production of more than 2,000 kg, if you have
to work with a smaller number of products, then consumers need to be subjected to
higher price adjustments.
Need more detailed measurements at regular intervals to determine the efficiency of
existing CS and ABF machines to find out the performance degradation of the equipment
after a long time of operation. This needs to be done because there is no standard
specification of the equipment.
4 Conclusion
Based on cold storage work is determined by the number of products stored. Cold storage
work becomes greater when there are open and close doors when moving products (hours of
production). Specific energy consumption for cold storage reaches around 4.2 kWh / ton or
4.2 Wh / kg.
ABF's work is determined by the number of products frozen. The more production, the
higher the energy needed. However, the optimal value of ABF work will occur if it produces
in the range of 5,000 kg, with the energy needed per production weight is 91 Wh / kg. If
production is higher than 5,000 kg, the energy requirements per weight will be higher.
Likewise, if ABF has to cool the product below 2,000 kg because the value of its specific
energy consumption will increase to reach 145 Wh / kg.
8E3S Web of Conferences 232, 03017 (2021) https://doi.org/10.1051/e3sconf/202123203017
IConARD 2020
Acknowledgement. This research was funded by DIPA Ministry of Energy and Mineral Resources in.
Thank you to PT. Jala Lautan Mulia Sidoarjo which has given permission for this research.
References
1. FAO, The State of World Fisheries and Aquaculture 2016 (2016).
2. D. Wijayanto, Aquat. Procedia 7, 28 (2016).
3. H. Darvishi, M. Azadbakht, A. Rezaeiasl, and A. Farhang, J. Saudi Soc. Agric. Sci. 12,
121 (2013).
4. R. C. Nagarajarao, Aquat. Procedia 7, 201 (2016).
5. H. Wu, S. A. Tassou, T. G. Karayiannis, and H. Jouhara, Appl. Therm. Eng. 53, 332
(2013).
6. H. Ronde, A. Ranne, and E. Pursiheimo, Proc. Int. Conf. Energy Sustain. Dev. Issues
Strateg. ESD 2010 (2010).
7. Y. A. Çengel and A. J. Ghajar, in Heat Mass Transf. Fundam. Appl. Refrig. Freez.
FOODS, 5th ed. (McGraw-Hill Education, 2015), pp. 1–59.
8. J. Evans, A. Foster, J. M. Huet, L. Reinholdt, K. Fikiin, C. Zilio, M. Houska, A.
Landfeld, C. Bond, M. Scheurs, and T. Van Sambeeck, Refrig. Sci. Technol. 2815
(2015).
9. Postharvest Management of Vegetables, Cool Room. URL:
https://www.postharvest.net.au/postharvest-fundamentals/cooling-and-storage/cool-
rooms//. Last update: 17 Februari 2019, (accessed at: 10 February 2020 )
10. A. Murtono, P. N. I. Kalangi, and F. E. Kaparang, J. Ilmu Dan Teknol. Perikan.
Tangkap 2, 89 (2016).
11. R. Meléndez-Pérez, M. E. Rosas-Mendoza, C. M.- Márquez, R. R. Velázquez-Castillo,
and J. L. Arjona-Román, Procedia Food Sci. 1, 363 (2011).
12. Indonesian Agency of National Standardization (BSN), SNI 6196:2011, BSN (2011).
13. Government Regulation of Republic Indonesia, No. 70 Year 2009 about Energy
Conservation.
14. B. Ates, K. N. Widell, T. S. Nordtvedt, and A. L. Cojocaru, Refrig. Sci. Technol. 256
(2017).
15. J. F. Muir, Fuel and Energy Use in the Fisheries Sector - Approaches, Inventories and
Strategic Implications (2015).
16. Indonesian Agency of National Standardization (BSN), SNI 4110:2014, BSN (2014).
17. Sofyar, E. Firmansyah, and Suharyanto, in CITISEE 2016 (CITISEE 2016, Yogyakarta,
2016), pp. 23–24.
18. T. Aditya, Int. J. Sci. Res. 2, 2319 (2013).
19. K. Gandhi, KL. Mokariya, D. Karvat, and M. Raval, IJERT 3, 2128 (2014).
9You can also read