Mineral Exploration in Mawat Region, Kurdistan-Iraq, based on Satellite Data and Terrain Prospection
←
→
Page content transcription
If your browser does not render page correctly, please read the page content below
2021-4107-AJTE

 1   Mineral Exploration in Mawat Region, Kurdistan-Iraq,
 2      based on Satellite Data and Terrain Prospection
 3
 4       The main goal of the presented exploration was to estimate potential for
 5       mineralization in the Mawat Ophiolitic Massif in Kurdistan, Iraq. The aim of
 6       the study was to explore existing copper mineralization and assessor
 7       elements gold, platinoids and chromium. Geological exploration detected
 8       two types of Cu occurrence a) secondary Cu carbonates (malachite) and b)
 9       Cu sulfides (chalcopyrite-pyrite). The Mawat region is mostly built of
10       ultrabasic and basic rocks: peridotites, gabbros, serpentinites and basalts
11       which are heavily deformed, with faults mostly oriented NNW-SSE, and NE-
12       SW. The first phase of exploration comprised digital processing of ASTER
13       and QuickBird satellite images, with appropriate geometrical and
14       radiometric corrections and transformation into coordinate system. Color
15       composite images were produced in different scales. They served to define
16       lithological composition, tectonic settings, location of the points of interest
17       etc. The field work was designed to check satellite data in situ, with focus on
18       perspective rock formations, which might host copper mineralization, and
19       other elements. The host rocks of the ore occurrences are primarily gabbros
20       and metagabbros intersected by diabase dykes, epidote and quartz veins.
21       Secondary mineralization is the product of surficial weathering and its
22       represented by malachite and limonite. The geophysical survey was very
23       useful in the detection of area with elevated induced polarization and low
24       resistivity. Three perspective areas have been selected for detailed explorations:
25       Waraz, Mirava-Chenara and Konjirin-Kuradawi. The concentration of copper
26       varies highly in very wide ranges; the maximum measured concentration of
27       Cu was determined in Waraz area 6.7%. Some rock samples also show
28       concentration of gold from 0.36 to 2.59 ppm Au.
29
30       Keywords: Mawat Ophiolitic Massif, Geologic-geophysical Explorations,
31       Copper Mineralization, Kurdistan-Iraq
32
33
34   Introduction
35
36        The goal of this exploration was to estimate potential for mineralization of
37   Mawat Ophiolitic Massif in Kurdistan, Iraq. The aim of the study was to
38   explore existing mineralization of copper as well as of other metals like gold,
39   platinoids, chromium etc. The explored area has about 250 km2, about 40 km2
40   of which was selected for detailed exploration of mineral resources. In additon
41   to geologic-geophysical survey, satellite ASTER and QuickBird imagery have
42   also been used. Color composite images were produced in different scales,
43   which served for rock discrimination, registration of tectonic elements, location
44   of control and sampling points, etc. The field work was designed to check
45   satellite data in situ, with focus on perspective rock formations, which might
46   host mineralized rocks. The ore host rocks are primarily gabbros and
47   metagabbro intersected by diabase dykes and epidote and quartz vein.

                                                 1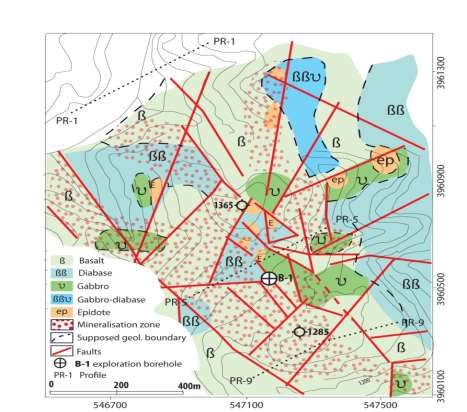
2021-4107-AJTE
1 Secondary mineralization is the product of surficial weathering and is
2 represented by malachite and limonite.
3 The geophysical explorations were applied in detection of anomaly area
4 (inducted polarization-IP, magnetic resistivity and SP methods) and proved very
5 useful.
6 Three areas: Waraz, Konjirin-Kuradawi and Mirava-Chenara area were
7 selected as potential by perspective for increased mineralization and were
8 subjected to detailed exploration and sampling for chemical and petrological
9 analyses. Measurement Cu in rock samples in ppm are as folows: Waraz area 1.53
10 - 60705, Konjirin-Kuradavi 68-36287 ppm and Mirava-Chenaran 135-16803 ppm.
11 Maximum value of 6.7% Cu was determined in Waraz area. In some rock samples
12 the gold concentration of 0.36 and 2.59 ppm were registered.
13
14
15 Study Area
16
17 The study area is situated in northeastern part of Iraq (Kurdistan), about 30
18 km north of Sulaimany City (Figure 1), with topography altitudes which ranges
19 from ca 940 m (south part) to more than 1400 m a.s.l. (north part). The main
20 ultramafic body reperesents low area, surrounded by high peaks made of mafic
21 intrusions which are grey and dark green in color showing pseudo stratification.
22
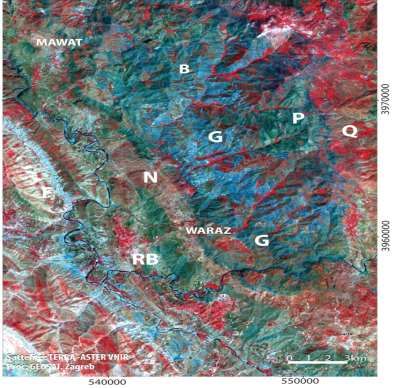
23 Figure 1. Positional of the Explored Area in Mawat Region, Kurdistan-
24 Iraq
25
26
27
28 Geological Setting
29
30 According to previous geological studies, the studied area belongs to the
31 Zagros Mt. chain which extends SE-NW. It is a young Alpine orogeny formed
32 by collision of African elements with Euroasian continental plate, and closing
33 the Tethyan Ocean. The Zagros orogenic system consists of several large
34 distinctive geotectonic units which correspond to Cretaceous - Palaegene
35 subduction of the Arabian plate beneath the Central/East Iran microplate,
2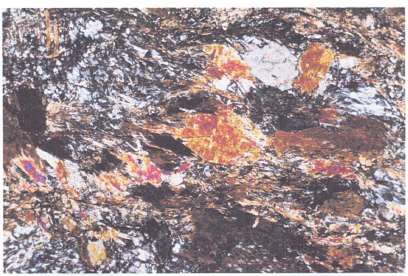
2021-4107-AJTE

 1   which is still active in the prolongation within the Gulf area. A wider area is
 2   built of Arabian platform formations, covered by Tertiary foreland units. Early
 3   foreland formations are Kolosh Tanjero, Shiranish, and Late foreland
 4   formations are Sinjar, Gercus, Pila Spi, Lower Fars and Upper Fars. This
 5   molasse formations are overthrust by ophiolitic mélange incorporated within
 6   the Qulqula Uper Cretaceus hinterland group. They indicate a regional Zagros
 7   nappe system and have a tongue-shaped form, named Mawat Nappe. Its central
 8   part consists of ophiolite and metamorphic rocks, surrounded by outcrops of
 9   Red bed series, as well as Naopurdan Series. More detailed chronological
10   overwiev of earlier studies is given in the following section.
11
12   PREVIOUS STUDIES
13
14        Mawat Ophiolitic massif was studied by numerous geologists. G. M. C.
15   Bolton (1955) made the first geological map of this region and disscused
16   tectonical zones as well as economic prospects of the area, and named , and
17   distinguished both Bulfat and Quandil thrust blocks.
18        Geology of the central sector of the Mawat igneous rocks has been
19   published by S. Z. Jassin (1975). The dispersion of Cu, Ni, and Cr
20   mineralization in Mawat Ophiolite Complex was reported by A. R. Al-Hashimi
21   & H. M. Al-Mehvidi (1975). The northern part of studied area was explored by
22   F. R. Hamasalh (1982) who wrote that Ultramafic rocks comprise peridotites,
23   dunites, pyroxenites and hornblendites which contain more than 90% mafic
24   minerals. The geological prospecting for copper mineralization in Waraz
25   locality, Mawat Igneous complex was performed by group of domestic experts
26   Mussaab A. H. Al-Hilali (1991), etc. According to earlier conclusions, Mawat
27   Massif was generally considerit witout economical importance (Bolton, 1953).
28   Power (1954) considered copper occurrences unimportant and without
29   economical potential. Smirnov & Nelidov (1961) in Waraz area determined
30   3.71% of Cu and concluded that mineralization is insignificiants with no
31   commercial concentrations of copper. However, some newer exploration (Al-
32   Hasimi & Al-Mehaidi, 1975) reported that copper content which in the
33   mineralized zone reaches up to 54140 ppm Cu (5.4% Cu). Detailed geological
34   investigations in the Waraz locality with the one borehole (240 m deep) alows
35   for recognition of two types of Cu occurrence a) secondary Cu carbonates
36   (malachite) and b) Cu sulfides (chalcopyrite-pyrite) which is probably primary
37   mineralization. Geochemical analysis of borehole samples provided
38   concentrations of copper in span from 11 ppm to 4910 ppm (average 638 ppm).
39   Recent exploration of Mawat Ophiolite complex (Yassin et al, 2015.)
40   documented copper sulfides (Chalcopyrite, Bornite, Chalcocite and Covellite)
41   in copper –rich deposits.
42
43

                                           3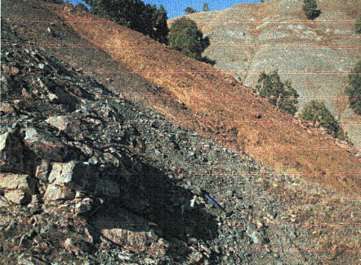
2021-4107-AJTE

 1   Geologic-Tectonically Exploration
 2
 3   SATELLITE IMAGERY - ANALYSIS AND INTERPRETATION
 4
 5        In this study was used Satellite imagery obtained by Tera-ASTER and
 6   QuickBird satellites. ASTER image cover wide spectral region with 14 bands
 7   and spatial resolution which varies from 15 m, 30 m and 90 m, coverse the area
 8   of 60 x 60 km. These resolutions were suitable for regional interpretation of the
 9   Mawat complex. The images were used to evaluate large areas of terrain for a
10   variety of properties like tectonics, rock discrimination, and geomorphology.
11   QuickBird imagery has higher resolution (1 - 4 m) and was useful for more
12   detailed analysis of physical landforms such as outcrops or structural features
13   and for location of control and sampling points etc.
14
15   Figure 2. ASTER Colour Composite (VNIR & SWIR) of Mawat Ophiolitic
16   Complex: B-Basalt, Diabase, Metadiabase; G-Gabbro, N-Wallash-Naopurdan
17   Nappe, Metagabbro; P- Peridotite, Serpentite, RB- Mollase - Redbed Series,
18   F- Fold Zone; Q- Qulgula (Image was Recorded in 2003)

19
20
21        ASTER satellite color composite was produced from different spectral
22   channels: 6, 3, 1; 3, 2, 1; 9, 7, 5 and 3N/3B, in scale 1:25 000, while QuickBird
23   Color composite produced in the scales 1:10 000 and 1:1000. Color composites
24   in the cartographic projection, were used for orientation, basis for drawing of
25   collected data (GPS), and for tectonic interpretation and rock discrimination
26   (Figure 2).

                                            4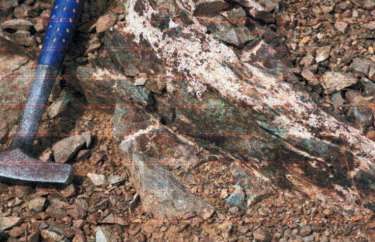
2021-4107-AJTE

 1       In the NE part of the explored area predominant rocks are bsasalt and
 2   diabases (B), meta gabbro and gabbro (G), peridotites and serpentites (P), and
 3   the zone of Mollase - Redbeds unit (RB). In the SW part Mollase – Redbed
 4   series dominates, which extends in zonal form around the central part of the
 5   terrain. Wallash and Naopurdan Nappe have been thrusted ower Redbed series,
 6   which are very intenisiely disturbed (folded), with many plicative structures
 7   (anticlines and synclines). The rocks are intensely ruptured, with numerous
 8   faults predominantely NW-SE orientation (Figures 3-5).
 9
10   Figure 3. Digital Terrain Model of Mawat–Waraz Area (Satellite ASTER
11   Image Shaded Relief Azimutt = 315o)

12
13
14   Figure 4. Linaements in Mawat-Waraz Area Registrered on ASTER Imagery

15
16

                                           5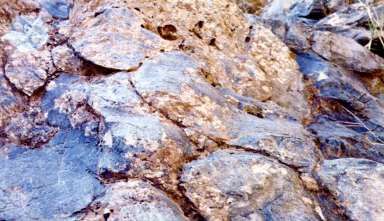
2021-4107-AJTE

 1   Figure 5. Rose Diagram of Lineaments in Mawat-Waraz Area

 2
 3
 4       Dominant strikes of faults are NNW - SSE and NE – SW. Streams and
 5   deep valleys are predisposed by faults and are located along them (direction
 6   NE-SW). The localities on intersections of different fault systems frequently
 7   show enrichment in copper mineralization.
 8
 9   Field Work
10
11        The field work comprised two phases; first, gathering general information
12   on geology of the explored area, and the second focused on detailed
13   observation on the ore occurrences, their host rocks, mineralization, etc. The
14   field work comprised cruises crosscutting geological units of the Mawat
15   Ophiolitic complex to acquire general idea on their mutual relationship with
16   special accent on the position of mineralization. The rock composition is very
17   heterogeneous, and the area is heavily tectonized (Figures 6 and 7). On
18   crosscuts we have observed characteristics of Upprer Cretaceous Shiranish,
19   Tanjiro, and Agra formations, Redbed series (molasses unit), and Naopurdan-
20   Wallash Formation (melange nappe).
21
22   Figure 6. Redbed Sediments - Intensely Folded, in front of Zagros Overthrust

23
24
25

                                           6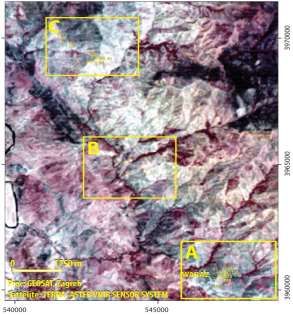
2021-4107-AJTE

 1   Figure 7. Bulfat Rock Complex in Forehead of Zagros Owerthrust

 2
 3
 4       Special attention was given to the Mawat nappe ophiolite rocks including
 5   peridotites, serpentinites, gabbros, basaltic rocks and metamorphics rocks of
 6   the Gimo sequence. More detailed work was carried out on the three separate
 7   areas which were recognized as most promising for copper mineralization.
 8
 9
10   Detailed Exploration of the Separated Locality
11
12        Three localities were identified as potential perspective zones of increased
13   sulfide mineralization, and selected for detailed geological and geophysical
14   explorations. These are Waraz (A), Konjirin-Kuradawi (B) and Mirava-
15   Chenara (C) localities (Figure 8).
16
17   Figure 8. ASTER Color Composite of Waraz-Mawat Area and Perspective
18   Localities (A, B, C)

19

                                            7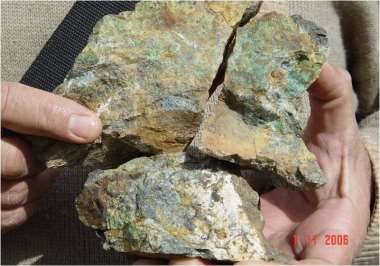
2021-4107-AJTE

 1   Waraz Area (A)
 2
 3        Waraz area is located in southern part of Mawat Ophiolitic Masif and has
 4   the surface of about 12 km2 (Figure 8). Based on interpretation of satellite data,
 5   geological field reconnaissance and geophysical survey, as well as microscopic
 6   and geochemical study, the Geological sketch-map was produced displayng the
 7   host rocks, tectonic elements and mineralisation zone (Figure 9).
 8        The map illustrates distribution of major rock types (upper pillow lavas,
 9   sheeted dykes etc.), and perspective zones of copper mineralization. More
10   dominant rocks are basalts (β) and diabase (ββ), followed by gabbros (Ʋ)
11   which are freqently followed by epidotes veins, isolated in different blocks.
12   The terrain is intensely tectonized and cut by numerous faults in various
13   orientations (Figure 10).
14
15   Figure 9. Geological Sketch-Map of the Waraz Area with Mineralization Zone

16
17
18

                                             8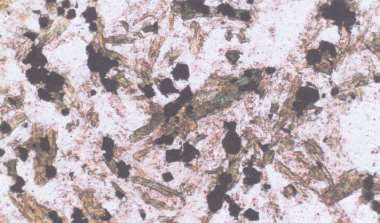
2021-4107-AJTE

 1   Figure 10. Rose Diagram of Ruptures in Waraz Area

 2
 3
 4        The mineralization zone extends coherently in SE-NW direction in the
 5   length of about 1500 m and about 800 m wide in the central part of explored
 6   terrain. Mineralization is mostly located in pillow lavas, basaltic dykes and
 7   gabbro-diabase formation (Figure 11).
 8
 9   Figure 11. Pillow Lava Higly Tectonized Contains Copper Mineralization

10
11
12        Copper ore crops out as thin horizons, ranging from 10 cm to 50 cm in
13   thinckness and between 1 to 5 m in lenght, distributed within an area of about
14   0.4 km2. Mineralization is situated within sheared and fractured zones in the
15   basalts and greenschists, closely associated with acidic rocks¶and quartz veins.
16   The sheared and fractured zone strikes NW and dips 50-70o to NE. Mineral
17   assocciation consists of malachite, pyrite, limonite and chalcopyrite. The
18   copper content in mineralized zone varies in very wide ranges from 1.53 to
19   60505 ppm.
20        Primary minerals in the mineralization zone are represented by:
21   chalcopyrite, bournite and pyrite. In the oxidation process from chalcopyrite,
22   malachite and limonite were developed, and from pyrite formed limonite. The
23   rocks were intensely fractured and dissected by numerous epidotic veins.

                                            9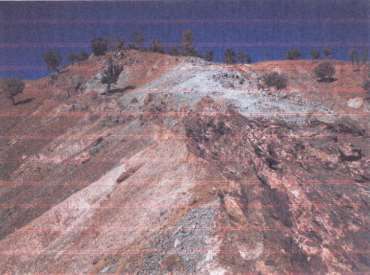
2021-4107-AJTE

 1   Mineralization is evidenced by limonatization which primarily follows epidotic
 2   veins. At places, one may find traces of the secondary copper mineral
 3   malachite, originated by weathering of chalcopyrite.The gabbro-diabase
 4   formation is crosscut by numerous epidote and, in lesser extent, quartz veins.
 5   The intensity of mineralization correlates well with the intensity of
 6   epidotisation.
 7
 8   Geophysical Survey
 9
10        Geophysical survey (geoelectric and geomagnetic tecniques) were utilized
11   with the aim to identify a) the distribution of lithological units with sulfide
12   mineralization, b) faults and fault zones, and c) the intensity of total magnetic
13   field ΔT. Geoelectric mapping and sounding was applied for the
14   geophysical/geoelectric surveys, which included induced polarization (IP)
15   tecniques electrical resistivity method. The used method in combination with
16   field reconnaissance, resulted in data showing sulfide mineralization and its
17   field distribution (Figure 12).
18
19   Figure 12. Induced Polarization (IP) Anomaly and ƍa Value of Lower and
20   Higher Resistivity (B-1 Borehole)

21
22
23        The zones with increased induced polarization-IP value are, as a rule, the
24   zones of increased sulfide mineralization, which were registerd almost in all
25   measured profiles, in the area of about 1.5 km2. The IP values showed that the
26   primary sulfides are situated in the compact gabbro-diabase rocks. Larger
27   zones of lower electrical resistence, characteristic for diabase rocks with
28   enrichment of secondary minerals (limonite, malachite with epidots), are
29   located westwards and eastward of the exploration borehole B-1.
30        The higher IP values were registared in the areas with increased
31   mineralization of secundare minerals (limonite and malachite with epidots).
32   The values of gradients self- potentia (SP) changed from -25 mV to more than

                                            10
2021-4107-AJTE
1 + 45 mV. This data suggest that the increased self-potential IP are related to
2 the areas with increased values of IP polarization. Decreasing values of IP
3 indicate secondary mineralization like in the locality west of borehole B-1.
4 There are registered lower values of eletric resistivity because of increased
5 mineralization.
6 The anomalies of total magnetic field ΔT changed within bounds from
7 46700 to 48600 that indicate strong magnetic field, because of the presence of
8 basalt and metabasalt with magnetic minerals (e.g. piroxene). The expressive
9 anomalies of total magnetic field (ΔT) compared with anomalies of IP are
10 shown in Figure 13. It is obvious that the orientation of anomaly have NW-SE
11 strike, that coincides with tectonic dislocations.
12
13 Figure 13. Waraz Locality: IP Anomaly and Intensity of Total Magnetic Field
14 ΔT
15
16
17 Larger magnetic anomaly in central part of the explored area corresponds
18 with the zone of diabase rocks and secondary minerals – malachite, limonite
19 etc.
20
21 Mineralization
22
23 The main host rock of mineralization in Waraz area are pillow lava
24 formation connected with basalt and basalt dykes and epidote veins, that
25 showed IP measurement. Pillow lava lithofacies is higly tectonized, along the
26 regional sheared zone. The potential area of ore mineralization has the area of
27 about 3 km2. The mineralization host rocks are located at the very contact of
28 the gabbro-diabase formation. Gabbro-diabase formation contains primary and
112021-4107-AJTE
1 secondary mineralization (Figure 14). Locally, pillow lava formation is
2 thrusted over the gabbro-diabase formation or onto the Naopurdan mélange.
3
4 Figure 14. Secondary Copper Mineralization within Gabbro-Diabase
5 Formation
6
7
8 The zone can be recognised by limonitization of sulfides, and limonite
9 staining on the rocks and numerous outcrops of secondary copper
10 mineralization with malachites. The source of copper which occurrs in the
11 pillow lava formation has a significent importance. It is recognized by
12 widespread occurrence of secondary minerals (limonite, malachite, azurite) and
13 primary sulfide minerals (chalcopyrite, pyrite, bornite). The gabbro-diabase
14 formation is crosscut by numerous epidote and, in lasser extent, quartz veins.
15 The intensity of mineralization correlates well with the intensity of
16 epidotization. Massive limonite were formed stainings on the basalt after
17 oxidation of massive vein sulfide-malachite (Figure 15).
18
19 Figure 15. Samples of Secondary Copper Minerals (Malachite)
20
21
122021-4107-AJTE
1 Geochemical analysis of representative rock samples taken in situ showed
2 that the samples have increased Cu and some increased values of Au, Ti, and
3 Fe (Table 1). The other elements Cr, Ni, As, Mo, Ag, Rb, Bi, and Zn contain
4 lesser concentracions.
5
6 Table 1. Contents of Au, Ti, Fe and Cu in the Analysed Samples (10 000 ppm =
7 1% Cu)
Nr Sample No Au (ppm) Ti (ppm) Fe (%) Cu (ppm)
1 W-2062021-4107-AJTE
1 Tectonics in this area was very active and the rocks are very dissured and
2 disarrangement. Specially stressed is the fault zone, NW-SE strike which is cut
3 by numerous transverse faults (Figure 17).
4
5 Figure 17. Rose Diagram of Ruptures in Konjirin Kuradawi Area
6
7
8 At the same time the localities with increased mineralization and
9 limonatisation have been registered. In the diabase-gabbroid rocks were
10 registered Fe-Cu ore effusive cataclastite enriched with iron and copper
11 minerals, which at the surface create limonite and malachite coatings. Flasered
12 metadiabase (altered into greenshist metamorphic facies) have been determined
13 by microscopic analyse (Figure 18).
14
15 Figure 18. Thin-Section of Flasered Metadiabase in Konjirin Area (P32x. N+)
16
17
18 Geophysical Survey
19
20 The map of induced polarization has values of IP between 2 msec and 34
21 msec. Zones with higher values of IP, with higher sulfide mineralization, are
22 determined only on geoelectric profile measured in a creek, probably in a fault
23 zone. On the map of apparent resistivity (ƍa) values of ƍa are in span between
24 less then 600 Ohmm up to more than 2800 Ohmm. The zones of higher
142021-4107-AJTE
1 mineralization IP are probably located on the contact of lower- and higher
2 electrical resistivities and they are also coused by faults.
3 The map of self potential SP shows values of SP in range from -32 mV to
4 over +28 mV. The values of SP also changed polarity on the contact zones.
5 The map of total magnetic intensity field (ΔT) shows values of ΔT in the
6 span of 46200Ý up to 49800Ý. Higher values of total magnetic field ΔT are
7 detected on the north and northwest parts of the exploration area, partly on the
8 same place where induced polarization IP is also high. Based on measurement
9 data, it could be concluded that anomaly zone IP of smaller dimension is
10 situated on the intersection of larger dislocations with NE-SW and NW-SE
11 strike. The zones of lower and higher resistivity generally corrrespond to
12 existeing NW-SE dislocations.
13
14 Mineralization
15
16 The mineralized zone generally stretches from SE to NW, and is the best
17 develloped in central part of the terrain. The main bearer of the mineralization
18 are pillow lavas, connected with basaltic rocks and basaltic dykes, as well as
19 with well developed epidote-quartz, closely associated with leucocratic rocks,
20 supposingly plagiogranite. A wide zone of alteration has been recorded on the
21 southern border of the Konjirin exploration area (Figure 19).
22
23 Figure 19. Alteration Zone with a Few Meters Thick Mineralization
24
25
26 A fairly large number of geochemical analysis have been done, but here
27 are presented only some of them (Table 2).
28
29
152021-4107-AJTE
1 Table 2. The Contents of Some Analysed Sampels (Au, Ti, Fe, Cu)
Nr Sample No Au (ppm) Ti (ppm) Fe (%) Cu (ppm)
1 K-108 1.10 529 8.15 36.287
2 K-7A 0.10 3261 7.12 16.430
3 K-6A 0.12 3118 7.68 21.648
4 K-912021-4107-AJTE
1 Figure 21. Rose Diagram of Ruptures in Mirava–Chenaran Area
2
3
4 Geophysical Survey
5
6 The same geophysical techniques have been used like in the studied areas
7 A and B. Two IP smaller anomalies (15-70 msec) were registered in the zones
8 of increased electric resistivity ƍa which have been caused by gabbro and
9 basalte rocks, that indicate increased sulfide mineralization Figure 22).
10
11 Figure 22. Induced Polarization (IP) Anomalies and ƍa Value of Lower and
12 Higher Resistivity
13
14
15 The zones of lower electric resistivity can be related to the occurence of
16 epidote, and that coincide with tectonic dislocations of NW-SE strike.
17
18 Mineralization
19
20 The main bearer of mineralization in this area is pillow lava formation
21 connected to basalts and basalt dykes. Mineralization is connected with well
22 developed epidote-quartz, closely associated with leucocratic rocks,
23 supposingly plagiogranite.
24 The outcrops with rich mineralization occur along the roadcut near the
25 village of Mirava and Chenaran. It consists of highly limonitized gabbro and
172021-4107-AJTE
1 diabase dykes with occurences of secondary and primary copper mineralization
2 (Figure 23).
3
4 Figure 23. Gabbro-Diabase Formation with Epidote-Quartz Veins and Copper
5 Mineralization (Close to the Road to Mirava)
6
7
8 The rocks are intensely fractured and dissected by several generations of
9 veins. The first system consists of epidote veins, ranging in size from several
10 cm to 0.5 m. The epidote veins are cut by quartz veins. Mineralization consists
11 of secondary copper minerals, malachite and iron oxides. The whole rock unit
12 was intruded by diabase dykes and sills, up to 1 m thick. Mineralization is
13 closely related to the epidote-quartz veining (Figure 24).
14
15 Figure 24. Diabase Dykes Intruded and Tectonically Displaced in the Gabbro
16 Rocks
17
18
19 The Chenaran locality is characterised by a wide limonitizatin zone ,
20 which follows general strikes of the rock formations, mostly built of gabbro-
21 diabase. Its intensity increases toward the Chenaran Village, where epidote-
182021-4107-AJTE
1 quartz ore veins are exposed, with malachite, limonite and primary sulfide
2 minerals . The locality is mostly composed of gabbro-diabase rocks, which
3 incorporate significante masses of plagiogranites (Figure 25).
4
5 Figure 25. Copper Mineralization: Primary Mineralization: Bornite, Chalcopyrite
6 and Pyrite, and Secondari: Malachite and Limonite, (Near Chenaran Village)
7
8
9 Primary mineralization zone it is evident in the Mirava village locality too,
10 in gabbro-diabase formation, which incorporates significante masses of
11 plagiogranites (Figure 26).
12
13 Figure 26. Mineralization Zone in Gabbro-Diabase with Plagiogranites in the
14 Mirava Village Locality
15
16
17 The Mirava locality is build of basalt-diabase formation with variable
18 contribution of diabase, epidote-quartz veinis, gabbro pegmatites, and several
19 zones of plagiogranites which are closely associated with mineralization. The
20 mineralization is recognized in many outcrops in the area which extends from
21 Mirava village to the contact with the Naopurdan formation. The plagiogranites
22 contain 2.5 g/t gold. The area of mineralization is very large, approximates 10
23 km2.
192021-4107-AJTE
1 The clear signs of the primary mineralization are weathering products of
2 sulfide: limonite, malachite, and chalcocite. Primary mineralization, consisting
3 of bornite, chalcopyrite and pyrite (Figure 27) underwent replacement within
4 the cementation zone, by chalcocite. The secondary mineralization is
5 dominated by massive limonite and brown stainings of limonite (e.g. goetite)
6 over the surfice surrounding host rocks. With decreased weathering, oxidizing
7 zone turned sulfides into malachite and limonite, with rare relics of the
8 chalcocite (Figure 28)
9
10 Figure 27. Copper Minerals: Chalcopyrite, Bornite, Pyrite and Malachite and
11 Limonite in the Epidote-Quartz Veins
12
13
14 Figure 28. Copper Mineralization - Highly Weathered Rock, with Malachite and
15 Limonite
16
17
18 The mineralization zone can be followed generaly from SE to NW and is
19 the best developed in the central part of the study area. The southeastern
20 boundary of the mineralization is not constrained; a possible extension of the
21 mineralization zone extends toward Waraz. Mineralization terminates on the
22 north above the Kuradawi village too.
23 Geochemical analysis has been done on 17 elements and gold. The
24 contents of gold in analysed samples is low (< 0.05 - 0.22 ppm) and the
25 contents in other elements is insignificant. Here are presented only Au, Ti, Fe,
26 and Cu (Table 3).
27
28
202021-4107-AJTE
1 Table 3.The content of Au, Ti, Fe and Cu in the analysed samples
Nr Sample No Au (ppm) Ti (ppm) Fe (%) Cu (ppm)
1 M-622021-4107-AJTE
1 Hamasalh, R.F. (1982) Petrochemistry, Petrogenesis and Tectonic Setting of the Pauza
2 Ultramafic Rocks-Bulfat Complex North-East Iraq, Kurdistan Region.
3 Jassim, S.Z. (1975) Geology of the Central Sector of the Mawat igneous rocks,
4 Northeastern Iraq. Journal of the Geol. Soc. of Iraq, vol. 6, 83-92.
5 Fatah R Hamasalh (1982) A Thesis, submited to the College of Science Sulaimany in
6 Partial fulfilment of the requirements for the degree of Master of Sc. in Geology-
7 Igneous petrology, University of Mosul, 1982, pp.115.
8 Oluić, M. et all. (2008) Report on Mineral Exploration in Mawat Ophiolitic Massif,
9 Kurdistan –Iraq. ECOINA, Zagreb, Croatia (unpublished).
10 Pover, G.L. (1954) Iraq mineral survey project, Vol. 3, six monthly report. GSM Lib. No
11 264.
12 Smirnov, V.A. & Nelidov, V.P. (1962) Report on 1/200 000, prospecting correlation of the
13 Sulaymanya-Choarta-penjwin area carried out in 1961. GSM Lib. No 290.
14 Stevanovic, Z. & Iurkiewicz, A. (2009) Groundwater management in northern Iraq,
15 Hydrogeology Journal (2009) 17: 367–378.
22You can also read