Dasin Retail Trust Investor Presentation - November 2018
←
→
Page content transcription
If your browser does not render page correctly, please read the page content below
Dasin Retail Trust Investor Presentation
November 2018
China's Economy

  1   China's economy and prospects in 2017 and
      9M 2018

  2   Overview of China's three economic circles

      Economic circle of Guangdong-Hong Kong-Macau
  3   Greater Bay Area

      Economic overview of Zhongshan in 2017 and
  4
      9M 2018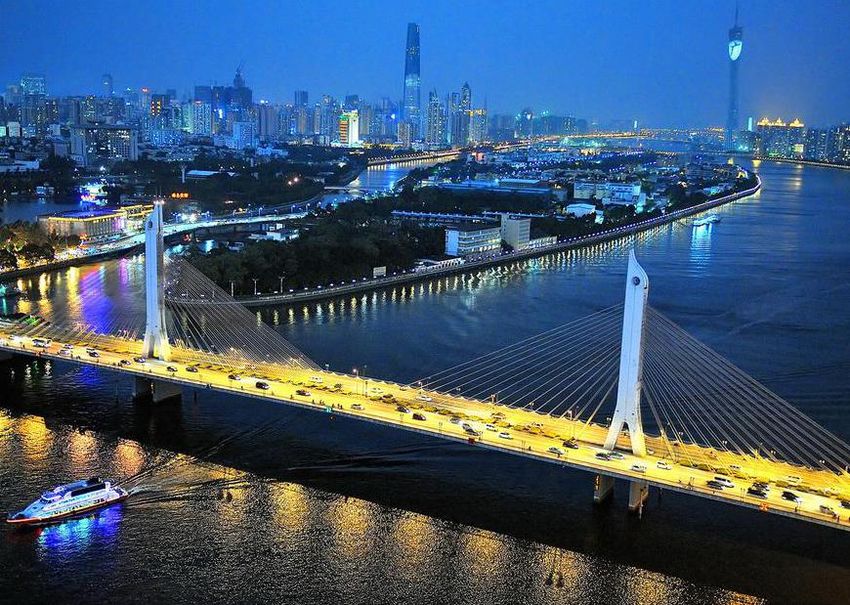
China's Economy Profile in 2017
Stable Politics and Economy
[1] [2]
GDP Growth rate
[1]
Ranked in the world Complete industrial structure
RMB 82.7 trillions econ
6.9% second
Rapid economy development
Sources: Bureau of land statistics
[1]http://www.stats.gov.cn/tjsj/zxfb/201802/t20180228_1585631.html
[2]http://www.stats.gov.cn/tjsj/sjjd/201802/t20180228_1585649.html 3
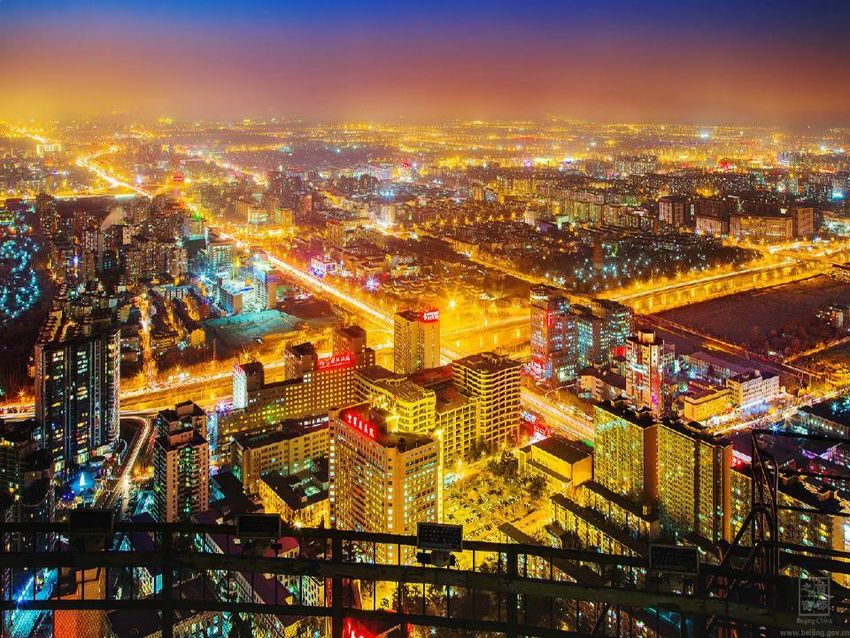
[3] Pictures from the Beijing municipal government website
China's Economy Profile
                                                in 9M 2018

                                    Optimisation and upgrading of demand structure:
                                    With year-on-year growth of 9.3%, amount of retail sales of consumer goods
                                    需求结构优化升级:
China National Economy in 9M 2018   reached RMB 27.4 trillion.
                                    社会消费品零售额18万亿,同比增长9.4%
          Stable Economy            Continuous improvement of trade structure:
                                    贸易结构持续改善:
                                    Imports and exports totaled RMB22.3 trillion with year-on-year growth of
                                    9.9%.
                                    进出口总额14.1万亿,同比增长7.9%
                                    Urban and rural disposable income growth:
                                    城乡居民收入增长:
                                    China's per capital disposable income in 9m 2018 grew 8.8% year-on-year to
                                    全国居民上半年人均可支配收入1.4万元,同比增长8.7%。
                                    RMB  21,035.

                                       Source:Chinese government website(http://www.stats.gov.cn/tjsj/zxfb/201810/t20181019_1628614.html)
                                       Pictures from the Beijing municipal government website
Chinese Three Major Economic Circles
Beijing-Tianjin-Hebei Economic Circle:
Beijing, Tianjin, Hebei (Baoding, Tangshan, Langfang,
Shijiazhuang, Qinhuangdao, Zhangjiakou, Chengde,
Cangzhou, Handan, Xingtai, Hengshui)
GDP: RMB 8.2 trillion, accounting for 9.94 percent of the
whole country.
Total retail sales of social consumer goods: RMB 3.3 trillion,
accounting for 8.98% of the whole country.
Total population: 112.48 million, accounting for 8.09% of the
whole country.
Total area: 216,400 square kilometers, accounting for 2.25%
of the whole country.
Yangtze River Delta Economic Circle:
Shanghai, Jiangsu Province (Nanjing, Wuxi,
Changzhou, Suzhou, Nantong, Yancheng,
Yangzhou, Zhenjiang, Taizhou), Zhejiang Province
(Hangzhou, Ningbo, Jiaxing, Huzhou, Shaoxing,
Jinhua, Zhoushan, Taizhou), Anhui Province (Hefei,
Wuhu, Ma 'anshan, Tongling, Anqing, Chuzhou,
Chizhou, Xuancheng)
GDP: RMB 16.5 trillion, accounting for 19.94
percent of the whole country.
Total retail sales of social consumer goods: RMB
6.4 tirllion, accounting for 17.43 percent of the
whole country.
Total population: 150.23 million, accounting for
10.81% of China's total population.
Total area: 210,600 square kilometers, accounting
for 2.19 percent of the whole country.
GDP: RMB 101.8 trillion, accounting for 12.24% of the
whole country.
Beijing- Yangtze River Guangdong-
Total retail sales of social consumer goods: RMB 3.2 Tianjin-Hebei Delta Hong Kong-
trillion, accounting for 8.62% of the whole country. Guangdong- Hong Kong-Macau Greater Economic Economic Macau Greater
Circle Circle Bay Area
Total population: 69.6 million, accounting for 5% of the Bay Area: Hong Kong, Macau, Zhongshan,
country's total population. Shenzhen, zhuhai, Jiangmen, Foshan, GDP/Area
(Ten thousand
Total area: 56,500 square kilometers, accounting for Dongguan, Guangzhou, Huizhou, 3,799 7,832 18,214
yuan per square
kilometers)
0.59% of the whole country. Zhaoqing
GDP/Population
(Ten thousand 7.31 10.98 14.56
Source: official websites of local statistics bureaus (2017 data) yuan per person)
Economic Circle of Guangdong-Hong Kong-Macau
  Greater Bay Area
Guangdong- Hong Kong-Macau Greater Bay Area refers to the urban agglomeration consisting of Hong
Kong and Macau Special Administrative Regions as well as other nine cities of Guangzhou province including
Guangzhou, Shenzhen, Zhuhai, Foshan, Zhongshan, Dongguan, Zhaoqing, Jiangmen, Huizhou. It is the most
active and densely populated area among the three economic circles in China.

  Economic Circle of Guangdong- Hong Kong-                                        GDP accounting for
  Macau Greater Bay Area                                                          12.2% of the whole country          Picture:
                                                                                                                      Shenzhen

                                                                                 Total Retail Sales of Social
                                                                                 Consumer Goods
                                                                                 RMB 3.2 trillion

                                                                                  Gross Domestic Product Per Capita
                                                                                  RMB 145,600

                                                                                  Total Population accounting for
                                                                                  5% of the whole country.

                                                                                  Accounting for 0.6% of total area
                                                                                  of the whole country

Source: official websites of local statistics bureaus (2017 data)                                                           6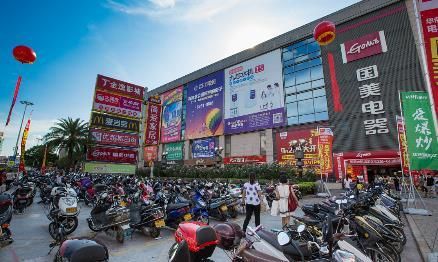
Economic Circle of Guangdong-Hong Kong-Macau
Greater Bay Area
Guangdong- Hong Kong-Macau Greater Bay Area, one of the four major bay areas in the world, is an important development for China to build a world-class
metropolis, together with New York Bay Area, San Francisco Bay Area in America and Tokyo Bay Area in Japan.
                                                                                                                      Launch of strategic development plan of China bay area:

                                                                                                                      The planning of Guangdong-Hong Kong-Macau Greater Bay Area, being
                                                                                                                      prepared by the Chinese Government, will be issued and implemented within
                                                                                                                      the year [2].

                                                                                                                        Data Index of the World's four largest Bay Areas in 2016[3]
                                                                                                                                                Guangdong-
                                                                                                                                                Hong Kong-
                                                                                                                                                            New York San Francisco
                                                                                                                                                  Macau                                     Tokyo Bay
                                                                                                                                                            Bay Area   Bay Area
                                                                                                                                                Greater Bay
                                                                                                                                                   Area
                                                                                                                      GDP(USD Trillion)              1.34             1.4           0.8        1.3
✓ In 2016, the economic growth of Guangdong- Hong Kong-Macau Greater Bay                                              GDP of National
                                                                                                                                                   12.57%             8%           4.3%      26.4%
  Area was 2.26 times, 2.19 times and 2.93 times of New York Bay Area, Tokyo                                          Proportion
  Bay Area and San Francisco Bay Area respectively[1].                                                                Population(Ten
                                                                                                                                                    6,800           2,340          760        3,500
                                                                                                                      thousand)
                                                                                                                      Area(Square
✓ Total GDP and GDP per capita reached as high as US$1.34 trillion and US$20,084                                                                   56,500          21,500         17,900     13,556
                                                                                                                      kilometer)
  respectively[3].
                                                                                                                      Number of cities                11              25            12         10

✓ The import and export volume of Guangdong- Hong Kong-Macau Greater Bay                                              GDP per capita
                                                                                                                                                   20,084          59,800         105,263    371,428
                                                                                                                      (USD/person)
  Area was more than three times that of Tokyo Bay Area, and container                                                GDP per Square
  throughput of regional ports was about 4.5 times that of the world’s three major                                    kilometer
                                                                                                                                                    2,407           6,512          4,469      9,590
  bay areas[4].                                                                                                       (USD/Square
                                                                                                                      kilometer)
                                                                                                                      GDP Growth                     7.9%            3.5%          2.7%       3.6%
Sources:
[1] Website of China People's Government(http://www.gov.cn/xinwen/2018-07/03/content_5303202.htm)
[2] http://baijiahao.baidu.com/s?id=1600676259154737954&wfr=spider&for=pc                                                                                                                               7
[3] Construction Report of Guangdong0Hong Kong-Macau Greater Bay Area (2018) issued by Guangdong Academy of Social Sciences (https://mp.weixin.qq.com/s/XNQksyW3I_mMiurgC2vvOQ)
[4] Shenzhen Dream Comprehensive Nanfang Daily, CCTV "Brilliant China" (http://www.sohu.com/a/218293747_331838)
Economic overview of Zhongshan in 2017 and 9M 2018

                                                                                                                                                                                           GUANGZHOU

                                                                   Guangdong
                                                                                                                                                ZHAOQING                                                                                                  HUIZHOU

                                                                                                                                                                             FOSHAN                                             DONGGUAN

                                                                     Guangzhou
                                                    Zhaoqing
                                                            Foshan          Huizhou
                                                                     Dongguan                                                                                                                                                       SHENZHEN
                                                          Zhongshan     Shenzhen                                                                                                                  ZHONSHAN

                                                             ●
                                                        Jiangmen
                                                              Zhuhai     Hong
                                                                  Macau Kong
                                                                                                                                                               JIANGMEN                                                                 HONGKONG
                             Guangdong- Hong Kong-Macau Greater Bay Area refers to the urban agglomeration consists of Hong Kong and
                             Macau Special Administrative Regions as well as other nine cities of Guangzhou province including Guangzhou,                                                          ZHUHAI
                             Shenzhen, Zhuhai, Foshan, Zhongshan, Dongguan, Zhaoqing, Jiangmen and Huizhou.

                                                                                                                                                                                                               MACAU
  Remarks: Zhongshan will become the central city of the bay area

  According to the official document “Comprehensive Development Plan of Guangdong Coastal Economic Belt (2017-2030)”
  issued by the People’s Government of Guangdong province: Zhongshan will become a hub that connects Greater Bay Area
  and Guangdong Coastal Economic Belt[1].                                                                                                   Remarks: traffic layout of Guangdong- Hong Kong-Macau Greater Bay Area

                                                                                                                                            According to the “Outline of the 13th Five-Year Plan for National Economic and Social Development of Guangdong Province”,
                                                                                                                                            Zhongshan is positioned to be developed into a "regional comprehensive transportation system on the west bank of the pearl river".

 Economic index of Zhongshan in 2017[2]                                                                                                      Economic index for 9M 2018 In Zhongshan[4]

 GDP                                                 RMB 345.0 billion                 Year-on-year growth of 6.6%                           Zhongshan is located in the center of Guangdong- Hong Kong-Macau Greater Bay Area. With strong market
                                                                                                                                             vitality, it is also an important city that connects the east and west sides of the Pearl River estuary. With the
 Added value of tertiary industry                    RMB 164.9 billion                 Growth of 9.1%
                                                                                                                                             rapid development of infrastructure projects in Guangdong- Hong Kong-Macau Greater Bay Area, Zhongshan is
                                                                                                                                             well positioned to benefit from the development of the bay area.

 Fixed asset investment                              RMB 124.8 billion                 Year-on-year growth of 8.7%
                                                                                                                                             In 9M 2018, Zhongshan City's GDP grew 5.9% year-on-year to RMB 275.6 billion.
 Total retail sales of consumer goods                RMB 131.0 billion                 Year-on-year growth of 8.6%
                                                                                                                                             The added value of the tertiary industry was RMB 127.5 billion, an increase of 7.2% year-on-year.
 Total value of imports and exports                  RMB 258.2 billion                 Year-on-year growth of 15.4%                          Retail sales of consumer goods totaled RMB 112.2 billion, an increase of 5.4% year-on-year.
                                                                                                                                             Number of foreign direct investment projects grew 171.4% year-on-year to 475.
 Number of foreign direct
                                                               271                     Year-on-year growth of 103.8%
 investment projects

 Actual utilisation of foreign capital                US$ 0.509 billion                Growth of 7.4%

Sources:
[1] Guangdong provincial people's government (http://zwgk.gd.gov.cn/006939748/201712/t20171205_733883.html)
[2] Zhongshan statistics bureau                                                                                                                                                                                                                                                  8
[3] Southern daily (http://www.sohu.com/a/73338857_222493)
[4] Zhongshan statistics bureau http://www.zsstats.gov.cn/tjzl/tjfx/201807/t20180730_403502.html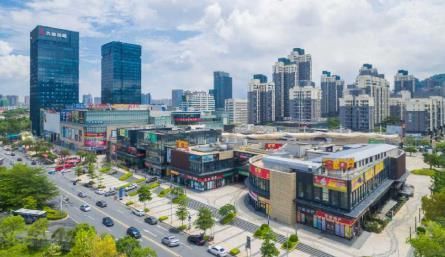
About Dasin Retail Trust

Listed on the Mainboard of Singapore Exchange Securities Trading Limited (“SGX-ST”) on
20 January 2017, Dasin Retail Trust (the “Trust”) is the only China retail property trust
listed on SGX-ST providing direct exposure to the Pearl River Delta region.

The Trust's mandate is to invest in, own or develop land, uncompleted developments and
income-producing real estate in Greater China (comprising PRC, Hong Kong and Macau),
used primarily for retail purposes, as well as real estate-related assets, with an initial focus
on retail malls. As at 30 September 2018, the Trust's portfolio comprise four retail malls
located in Zhongshan City in Guangdong, PRC, valued at approximately RMB7.4 billion
(S$1.5 billion).

                                                 Dasin Retail Trust Management Pte. Ltd.

Dasin Retail Trust is managed by Dasin Retail Trust Management Pte. Ltd. in its capacity as the Trustee Manager (“Trustee-Manager”). The Trustee-Manager strives
to provide unitholders of Dasin Retail Trust (“Unitholders”) with an attractive rate of return on their investment through regular and stable distributions and to
achieve long-term sustainable growth in distribution per unit. The Sponsor of Dasin Retail Trust is Zhongshan Dasin Real Estate Co., Ltd. (the “Sponsor”) with strong
track record as a retail mall developer and operator.

                                                                                                                                                              9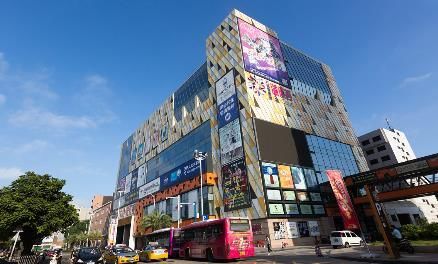
Trust Structure of Dasin Retail Trust
Acts on behalf of Unitholders and
Ownership of units
provides Management Services
大信商用信托管理有限公司
Dasin Retail Trust Management Pte. Ltd.
Unit holders
(Trustee-Manager)
Distribution Management Fee
100% Ownership Dividends
新加坡大信商业控股有限公司
Singapore Dasin Commercial Holdings Pte.
Ltd.
100% Ownership Dividends
溢信投资有限公司 溢信管理有限公司 榄信管理有限公司 盛信控股有限公司
榄信投资有限公司 远信投资有限公司
Yi Xin Management Pte. Ltd. Lan Xin Management Pte. Ltd. Sheng Xin Holdings Pte. Ltd.
Yi Xin Investments Pte. Ltd. Lan Xin Investments Pte. Ltd. Yuan Xin Investments Pte. Ltd.
盛信管理有限公司 盛信物业有限公司
Singapore
Sheng Xin Management Sheng Xin Properties Pte.
Pte. Ltd. Ltd.
People's Republic of China
中山市溢彩大信新都汇商业管理有限公
中山市信腾商业管理有限公司 中山市信瑞商业管理有限公司 中山市远信商用物业有限公司 司 中山市小榄大信新都汇商业管理有限公 中山市石岐大信新都汇商业管理有限公司 中山市信控商业管理有限公司
Zhongshan Xinteng Zhongshan Xinrui Zhongshan Yuanxin Zhongshan Yicai Dasin 司 Zhongshan Shiqi Dasin Zhongshan Xinkong
Zhongshan Xiaolan Dasin Xinduhui Xinduhui Commercial
Commercial Commercial Commercial Management Xinduhui Commercial
Commercial Management Co., Ltd. Management Co., Ltd. Commercial
Management Co., Ltd. Co., Ltd. Management Co., Ltd.
Management Co., Ltd. (大信新都汇小榄店的租赁管理公司) (大信新都会石岐店的租赁管理公司) Management Co., Ltd.
(大信溢彩荟的租赁管理公司)
Property Management Services Marketing services
中山市基信物业管理有限公 中山市大信商用物业管理有限
司石岐分公司 公司
溢彩荟 小榄新都汇 远洋新都汇 大信新都汇石岐店
Zhongshan Jixin Property Zhongshan Commercial
Dasin E-Colour Xiaolan Metro Mall Ocean Metro Mall Shiqi Metro Mall
Management Co., Ltd. Property Management Co.,
(Shiqi Branch) Ltd.
10Investment Highlights
Dasin Retail Trust distribution yield for 2017 was 8.95% based on its
IPO price of S$0.80.
As at 30 September 2018, 9M 2018 DPU was 5.98 Singapore cents.
Based on an annualised 9M 2018 DPU and DRT’s offering price of
S$0.80, DRT’s distribution yield is 9.0%.
1 Strategically located assets in Guangdong- Hong Kong-
Macau Greater Bay Area
2 Strong market performance
3 Quality portfolio and strong operational capability
4 Extensive ROFR Pipeline
Major shareholders’ commitment and confidence in the
5
growth of Dasin Retail TrustThe only China retail property trust listed on SGX-ST
providing direct exposure to the fast-growing Pearl River Delta region
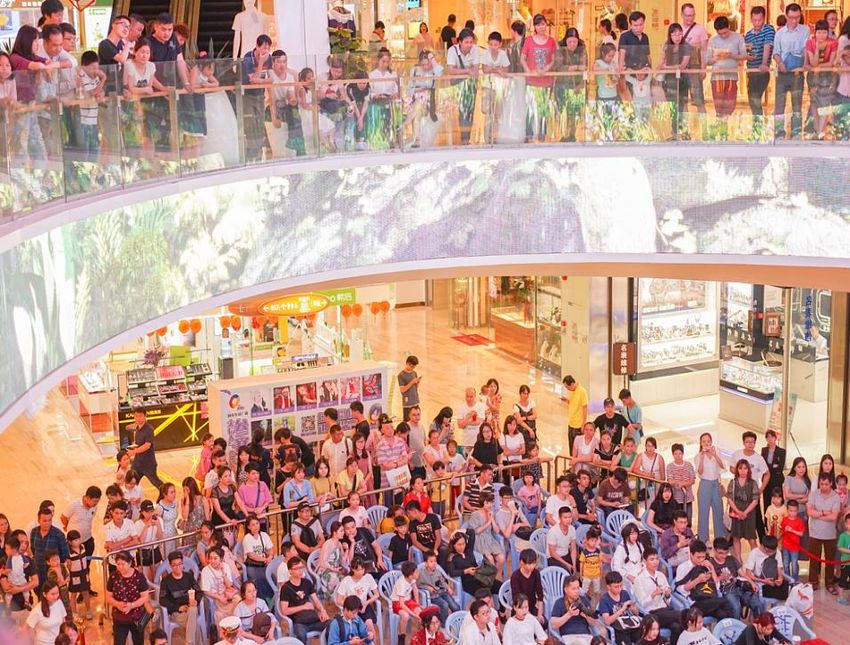
Strategically located assets in Guangdong- Hong Kong-Macau Greater Bay Area
Dasin Retail Trust is the only commercial trust listed on the main board of the Singapore Stock Exchange that invests directly in the Guangdong- Hong Kong-Macau
Greater Bay Area. Based on its strong foundation and experienced management team, Dasin Retail Trust has delivered results that have met expectations since its listing
on 20 January 2017.
ict
Pictures: Cities within the Guangdong-Hong Kong -Macau Bay Area
12Strong Market Performance
Financial performance exceeded expectations
• Revenue in 2017 reached S$58 million, an increase of 16%
compared to forecast.
• For 9M 2018, revenue increased 37% [1] year-on-year to S$55.1
million.
Healthy capital structure
• As at 30 September 2018, gearing stood at 32.5%. The
average all-in cost of borrowing for onshore debt was
5.3% with weighted average term to maturity of 2.8 years.
The average all-in cost of borrowing for offshore debt was
5.2% with weighted average term to maturity of 1.0 year.
High rate of return and distribution
• The distribution yield in 2017 was 8.95% based on IPO
price of S$0.80.
• As at 30 September 2018, distribution per unit was
S$0.0538. Based on an annualised 9M 2018 DPU and
DRT’s offering price of S$0.80, DRT’s distribution yield
is 9.0%.
Note:
[1] Revenue increased largely due to contribution from Shiqi Metro MallQuality Portfolio and
Strong Operational Capability
Shiqi Metro Mall Dasin E-Colour Professional and Experienced
Capital Management
As at 30 September 2018, portfolio occupancy remained
strong at 97.6% with weighted average lease term of 6.2
years by net lettable area and 3.9 years by gross rental
income, providing stability and sustainability of portfolio
and distribution income to unitholders.
Ocean Metro Mall Xiaolan Metro Mall
Positive Capital Upgrading Plan
The Trustee Manager works closely with its
commercial and property managers to optimise the
tenant mix of its malls to enhance shopper traffic. The
Trustee Manager also works closely with existing
tenants to enhance their image and shoppers’
experience. Such works include the upgrading of
IMAX theatre at Ocean Metro Mall to improve
viewing experience. Upon completion of its AEI,
Xiaolan Metro Mall will welcome Hai Di Lao and other
well-known tenants.
14Extensive ROFR Pipeline Spanning Across Four Cities
20 ROFR properties across four cities. Scale may increase 3.1 times if all ROFR projects are injected into the Trust:
Through the sponsor's right of first refusal (" ROFR "), Dasin Retail Trust
can acquire high quality properties at the right time. At the time of listing, Dongfeng Metro
the trust had 15 ROFR assets (including the purchase option for Doumen Mall
Zhongshan
Metro Mall), and as at 30 September 2018,the number of ROFR Nantou Huangpu
Jinshang Metro Mall
properties owned by the trust had increased to 20 (including the Dongfeng Sanjiao Metro Mall
purchase option for Doumen Metro Mall). In order to improve Sanjiao
Xiaolan Metro Mall Fusha Fusha Metro Mall
investment returns, we will continue to adopt strict investment methods. Xiaolan
118 Xiangming
Tanbei Metro Mall
Pacific Ocean Mall Guzhen Dongqu Metro Mall
Dongsheng Gangkou Minzhong
Guzhen Metro Mall Dasin E-Colour
Xinjiayuan Metro Xiqu Shiqi Metro Mall
911 1345 Mall Zhongshangang
Henglan Shiqi Xinyue Metro Mall
Heng Lan Metro Mall
(THIDZ)
Shaxi
Dongqu Shiqi Metro Mall
Shaxi Metro Mall Nanqu Phase 2
434 Nanlang
Dachong
Golden Horse
Xinghui Metro Mall
Square
Wuguishan
Banfu Ocean Metro Mall
Sanxiang
Dasin Retail Trust Portfolio
Foshan Shenwan
Purchase option on Doumen Metro Mall
13 Completed ROFR Properties Tanzhou
6 ROFR Properties Under Development
Macau
Zhuhai
Shunde Doumen Metro Mall
Dasin Macau Financial Centre
Shunde Metro Mall
Dasin Jinlida Garden Mall
15Major shareholders’ commitment and confidence in the
growth of Dasin Retail Trust
Major Unitholders' own approximately
Dasin Holding is a diversified group with commercial real estate development 65% of the issued units, which is a sign of
and operation as its core business, covering a range of businesses including
housing, architecture, technology, finance, hotel, catering, retailing, confidence on Dasin Retail Trust.
education, culture, medicine, etc. Dasin Holding has been awarded
“Comprehensive Top Ten Enterprises in China Real Estate Development”
for seven years from 2011 to 2017, and is recognised for its business
operation capability.
Awards in 2018 include:
✓ Operational Top Ten Enterprises in
China Commercial Real Estate
Development
✓ Top 200 Enterprises in China Real
Estate Development
✓ Typical Commercial Project in China
Real Estate Development- Dasin Metro
Mall
≈65%
Major Unitholders Other investors
Description: Dasin Retail Trust equity structur e
16Financial Performance
The Trustee-Manager adopts a prudent capital management
strategy to sustain a healthy and stable capital structure for
the Trust.
1 Financial Performance in 2017
2 Financial Performance in 9M 2018
3 Distribution Policy
4 Comparative YieldFinancial Performance in 2017
18Financial Performance in 9M 2018(1)
For the period 3Q 2018 9M 2018
S$’000 Actual Forecast Change (%) Actual Forecast Change (%)
Revenue 18,065 17,676 2.2 55,129 52,866 4.3
Net Property Income 14,507 14,610 (0.7) 45,698 43,697 4.6
Amount available for distribution
5,316 5,341 (0.5) 15,821 15,977 (1.0)
DPU (cents)
(With Distribution Waiver) 1.81 1.83 (1.1) 5.38 5.47 (1.6)
DPU (cents)
(Without Distribution Waiver) 0.95 0.96 (0.8) 2.84 2.88 (1.3)
Annualised DPU yield (%)
Based on Offering Price of S$0.80 and with
8.97 9.08 (1.1) 9.00(2) 9.15 (1.6)
Distribution Waiver
• 9M 2018 NPI was 4.3% higher than forecast mainly due to contribution from Shiqi Metro Mall
Note:
(1) The actual results of the Trust’s foreign operations are translated using the average RMB/SGD rate of 4.8657 for the nine months ended 30 September 2018.
(2) Based on annualised 9M 2018 distribution per unit of 5.38¢ (with distribution waiver) and the offering price of S$0.80 as at IPO. 19Balance Sheet and Capital Management as at
30 September 2018
S$'000 Debt Maturity Profile
Key balance sheet items (as at 30 Sep 2018)
(S$'000)
200,000
150,000
Investment Properties 1,480,764
100,000
Cash and cash equivalents
43,138
50,000
Other assets 50,626 0
2019 2020 2021
Total Assets Onshore Facility Offshore Facility
1,574,528
Gearing[1] 32.5%
Loans & borrowings
498,487
Average all-in cost of borrowings
Total Liabilities 796,135 Onshore facility 5.3%
Offshore facility 5.2%
No. of issued and issuable
557,649
units (‘000) Weighted average term to maturity (Years)
Onshore facility 2.8
NAV per Unit (S$) 1.40
Offshore facility 1.0
Note: 20
[1] Gearing is computed based on total gross borrowings divided by total assets.Distribution Policy
• Ties in with rental growth assumptions for the two
•Half yearly distribution; • Major unitholders (Aqua Wealth Holdings Limited and growth assets of Ocean Metro Mall and Dasin E-
•100% of Distributable Income to Unitholders for Year Bounty Way Investments Limited) will waive a portion Colour
2018 of their entitlement to distributions from Dasin Retail • The total amount of the waived distribution will be
•At least 90% of Distributable Income to Unitholders Trust for the benefit of other unitholders distributed to the rest of the Unitholders
for Financial Year 2019 onwards • Expression of major unitholders' confidence in long- • For avoidance of doubt, such waived distribution
term income growth with a strong alignment of will also be distributed to each of the major
interest with other unitholder. unitholder in relation to their Units that are not
subject to the Distribution Waiver in any particular
year
1 2 3
Dividend Policy Distribution Waiver Other Conditions
Arrangement
million 350 100%
85%
300
74% 80%
250
69%
54%
200 60%
150 55% 48% 40%
45% 23%
100 35%
20%
50
15%
0 0%
FY2017 FY2018 FY2019 FY2020 FY2021
Number of Units which will not be entitled to distribution
% of units held by Aqua Wealth Holdings Limited and Bounty Way Investments Limited as at the Listing Date which will not be entitled to distribution
As a % of Total Outstanding units as at the Listing Date (1)
Note:
(1) The total outstanding units was 549,606,331 as at Listing Date on 20 January 2017. 21Comparative Yield
9.0%
5.5%
4.6%
4.3%
3.6%
2.5% 2.5%
0.4%
Dasin Retail Trust FSTREI Yield FTSRE Yield FSSTI Yield China 10-year Govt Singapore 10-year Govt CPF Ordinay Account 12-month Fixed (S$)
Bond Yield Bond Yield Deposit
Notes: (1) Based on annualised 3Q FY2018 distribution per unit of 1.81¢ (with distribution waiver) and the offering price of S$0.80 as at IPO.
(2) Average 12-month gross dividend yield of Straits Times REIT Index as at 30 September 2018.
(3) Average 12-month gross dividend yield of Straits Times Real Estate Index as at 30 September 2018.
(4) Average 12-month gross dividend yield of Straits Times Index stocks as at 30 September 2018.
(5) China Government 10-year bond and Singapore Government 10-year yields as at 30 September 2018.
(6) Prevailing CPF-Ordinary Account savings rate.
(7) Average 12-month S$ fixed deposit savings rate as at 30 September 2018.
22
Sources: Bloomberg, Central Provident Fund (CPF) Board, Monetary Authority of Singapore, Dasin Retail Trust Management Pte. Ltd.Portfolio Review 1 Portfolio Details as at 3Q 2018 2 Weighted Average Lease to Expiry 3 Performance of individual assets
Portfolio Details (As at 30 September 2018)

                                      Shiqi Metro Mall                  Xiaolan Metro Mall                Ocean Metro Mall            Dasin E-Colour         Dasin Retail Trust

GFA (sqm)                                           119,682                            108,690                        180,338                   25,857                  434,567
NLA (sqm)                                            85,902                             78,414                         68,899                   12,507                  245,722
                                             RMB2,980m                        RMB2,312.5m                        RMB1,825m                  RMB322m             RMB7,439.5m
Valuations(1)
                                            (S$593.3m)(2)                      (S$460.0m)(2)                    (S$363.2m)(2)             (S$64.3m)(2)         (S$1,480.8m)(2)
Car Park Lots                                              545                                626                       1,991                          -                   3,162
Commencement of
                                                  May 2004                            Sep 2005                       Dec 2014                 May 2015                               -
Operations

Occupancy Rate                                         98.7%                              94.0%                         99.9%                    99.5%                    97.6%

WALE (Years)
                                                      4.1/2.9                            6.1/4.5                      9.5/5.1                   3.1/2.1                  6.2/3.9
NLA /GRI

                             NLA by Retail Area                                                                                  Lease Structure by NLA

   Shiqi Metro Mall                                     Xiaolan Metro                                                                                                   Fixed Rent
         , 35%                                            Mall , 32%                                         GRI%     15%               63%                  20% 2%
                                                                                                                                                                        Fixed Rent with Built-in
                                                                              Stable assets                                                                             Escalation
                                                                              Growth assets                                                                             Higher of Base Rent or
                                                                                                               NLA                                                      Turnover Rent
                                                                                                                   5%           51%                    41%       3%
          Dasin E-Colour ,                            Ocean Metro                                               %
                                                                                                                                                                        Pure Turnover Rent
                5%                                     Mall , 28%

Notes:
(1) Based on independent valuations by Colliers International (Hong Kong) Limited (”Colliers”) as at 30 June 2018.
                                                                                                                                                                                         24
(2) Based on closing RMB/SGD rate of 5.0245 as at 30 September 2018.
Portfolio with High Occupancy and Well diversified trade mix
Xiaolan Metro Mall Diversified trade mix with no trade sector accounting
for more than 25% of Portfolio NLA & GRI
Trade Sector (By NLA)
Shiqi Metro Mall
3% Supermarket / Hypermarket
3%
Department Store
94.0% Occupied 2%
3% 23% Food & Beverage / Food court
5%
Home Furnishings
5%
98.7% Occupied Leisure & Entertainment
9% Fashion
Xiaolan IT & Electronics
18%
General Retail
Ocean Metro Mall 13%
Services
16% Sports & Fitness
Shiqi
Others
Dongqu
99.9% Occupied
Trade Sector (By GRI)
Supermarket / Hypermarket
4% 4% Department Store
Dasin E-Colour 3%2%
Food & Beverage / Food court
18%
13% Home Furnishings
Zhongshan Leisure & Entertainment
Fashion
9%
99.5% Occupied IT & Electronics
19%
General Retail
14% Services
4% 9% Sports & Fitness
Others 25Well-spread weighted average lease to expiry (WALE)
71.4%
WALE: 6.2 years (by NLA)
3.9 years (by GRI)
42.3%
19.8% 13.8%
11.8% 9.6% 10.8%
7.8%
4.0% 3.1% 3.0% 2.7%
Oct to Dec 2018 FY2019 FY2020 FY2021 FY2022 FY2023 & Beyond
Net Lettable Area as at end-Sep 2018 (sqm) Gross Rental Income in Sep 2018
Gross Rental Income
As at 30 September 2018 No. of leases
RMB’000 % of total
Oct to Dec 2018 131 3,050 11.8%
FY2019 185 5,103 19.8%
FY2020 80 2,470 9.6%
FY2021 49 3,569 13.8%
FY2022 12 694 2.7%
FY2023 & Beyond 66 10,906 42.3%
26Ongoing Asset Enhancement Initiative at Xiaolan Metro Mall
₋ Ongoing works to reconfigure ~5,967.6 sqm of space
₋ At Level 4, reconfigured ~1,249 sqm of space previously leased to a leisure &
entertainment tenant into five new F&B offerings
₋ Upon completion of AEI, the mall will welcome Hai Di Lao and other well-known tenants,
offering shoppers a more diverse mix of retail options
Reconfiguration of Space to Enhance F&B Offerings
27Shiqi Metro Mall
Property Information (As at 30 September 2018)
GFA (sqm) 119,682
NLA (sqm) 85,902
Valuation (S$m) 593.3
Occupancy 98.7%
WALE (NLA/GRI) 4.1/2.9 (years)
Land Lease Tenure 27 July 2041
Lease Structure Trade Mix (By NLA) Lease Expiry Profile
1%
3% 4% 62%
4%
21%
GRI% 18% 58% 21% 3% 8%
2%
3%
36%
24%
23% 21%
20% 17%
14%
NLA% 9% 48% 40% 4% 8% 7%
11% 5% 4%
0% 0%
Fixed Rent Supermarket / Hypermarket Department Store Oct to Dec FY2019 FY2020 FY2021 FY2022 FY2023 &
Fixed Rent with Built-in Escalation Food & Beverage / Food court Home Furnishings
2018 Beyond
Leisure & Entertainment Fashion
Higher of Base Rent or Turnover Rent IT & Electronics General Retail
By Net Lettable Area By Gross Rental Income
Pure Turnover Rent
Services Sports & Fitness 28
OthersXiaolan Metro Mall
Property Information (As at 30 September 2018)
GFA (sqm) 108,690
NLA (sqm) 78,414
Valuation (S$m) 460.0
Occupancy 94.0%
WALE (NLA/GRI) 6.1/4.5 (years)
Land Lease Tenure 1 April 2043
Lease Structure Trade Mix (By NLA) Lease Expiry Profile
2% 84%
3%
9%
7% 5% 0%
GRI% 18% 70% 11%1% 1%
10%
50%
26%
20%
NLA% 3% 61% 32% 3% 16%
12%
8% 9%
16% 3% 3% 3% 6% 5%
2%
Fixed Rent
Supermarket / Hypermarket Department Store
Food & Beverage / Food court Home Furnishings
Oct to Dec FY2019 FY2020 FY2021 FY2022 FY2023 &
Fixed Rent with Built-in Escalation
Leisure & Entertainment Fashion 2018 Beyond
Higher of Base Rent or Turnover IT & Electronics General Retail
Rent Services Sports & Fitness By Net Lettable Area By Gross Rental Income
Pure Turnover Rent Others 29Ocean Metro Mall
Property Information (As at 30 September 2018)
GFA (sqm) 180,338
NLA (sqm) 68,899
Valuation (S$m) 363.2
Occupancy 99.9%
WALE (NLA/GRI) 9.5/5.1 (years)
Land Lease Tenure 21 February 2046
Lease Structure Trade Mix (By NLA) Lease Expiry Profile
2% 1% 5%
6% 79%
0%
26%
GRI% 3% 57% 39% 2% 5%
10% 48%
11% 18%
18%
14% 14%
NLA% 1% 39% 59% 1% 16%
4% 7% 7%
2% 4% 2% 3%
Supermarket / Hypermarket Department Store
Fixed Rent Food & Beverage / Food court Home Furnishings Oct to Dec FY2019 FY2020 FY2021 FY2022 FY2023 &
Leisure & Entertainment Fashion 2018 Beyond
Fixed Rent with Built-in Escalation
IT & Electronics General Retail By Net Lettable Area By Gross Rental Income
Higher of Base Rent or Turnover Services Sports & Fitness
Rent
Others 30
Pure Turnover RentDasin E-Colour
Property Information (As at 30 September 2018)
GFA (sqm) 25,857
NLA (sqm) 12,507
Valuation (S$m) 64.3
Occupancy 99.5%
WALE (NLA/GRI) 3.1/2.1 (years)
Land Lease Tenure 28 July 2045
Lease Structure Trade Mix (By NLA) Lease Expiry Profile
1%
9%
50%48%
3% 5% 26%
GRI% 21% 79%
25%
22%
NLA
%
12% 88% 11% 12%
10%
56% 6% 6%
2% 4% 3%
Fixed Rent Food & Beverage / Food court Leisure & Entertainment
Fashion General Retail Oct to Dec FY2019 FY2020 FY2021 FY2022 FY2023 &
Fixed Rent with Built-in Escalation
Services Others 2018 Beyond
By Net Lettable Area By Gross Rental Income
31Thank you
Key Contacts:
Li Wen
Chief Executive Officer
Dasin Retail Trust Management Pte. Ltd.
Tel: +65 6509 8626/ (+86) 138 2391 0898
Email: liwen@dasintrust.com
Chua Sian Howe
Investor Relations & Public Relations Manager
Dasin Retail Trust Management Pte. Ltd.
Tel: +65 6509 8626
Email: howe.chua@dasintrust.com
32You can also read