Country Insight Snapshot Hong Kong (S.A.R.) - September 2019 - Written 01 September 2019 - Bisnode
←
→
Page content transcription
If your browser does not render page correctly, please read the page content below
Country Insight Snapshot
Hong Kong (S.A.R.)
September 2019

                   Written 01 September 2019
Country Insight Snapshot: Hong Kong (S.A.R.)
September 2019

OVERVIEW
 OVERALL COUNTRY RISK RATING: DB3a
 Slight risk: Enough uncertainty over expected returns to warrant close monitoring of country
 risk. Customers should actively manage their risk exposures.
 Rating Outlook:         Stable

CORE OUTLOOK
      + Hong Kong has exceptional resources to safeguard its economic stability, such as its fiscal
      surplus and currency board system.
      + Few jurisdictions in the region, besides Singapore, can offer the institutional quality of
      Hong Kong and its commercial environment.
      - A battle is underway to maintain the spirit of the 'one country, two systems' in the face of
      Chinese encroachment; if it is lost, then Hong Kong's role as a global business centre will be
      threatened.
      - The US-China trade war, and the risk of a sharp slowdown and debt crisis on the mainland,
      pose further threats to Hong Kong's economy.
      - Long term, the city’s rapidly-ageing population will trigger higher medical and pension
      contributions, forcing difficult policy decisions.
KEY DEVELOPMENT
Dun & Bradstreet downgrades Hong Kong's risk rating again as the protest movement deepens
and intensifies, and China weighs up how to step in to reassert control.
CREDIT ENVIRONMENT OUTLOOK

 Trend:       Stable

      Key Development has had a negative impact on the outlook.
SUPPLY ENVIRONMENT OUTLOOK

 Trend:       Stable

      Key Development has had a negative impact on the outlook.

MARKET ENVIRONMENT OUTLOOK

 Trend:       Deteriorating

      Key Development has had a negative impact on the outlook.
POLITICAL ENVIRONMENT OUTLOOK

 Trend:       Deteriorating rapidly

      Key Development has had a negative impact on the outlook.

© Dun & Bradstreet                                                                                 2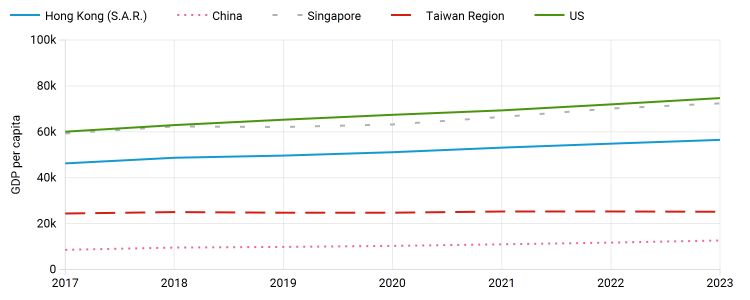
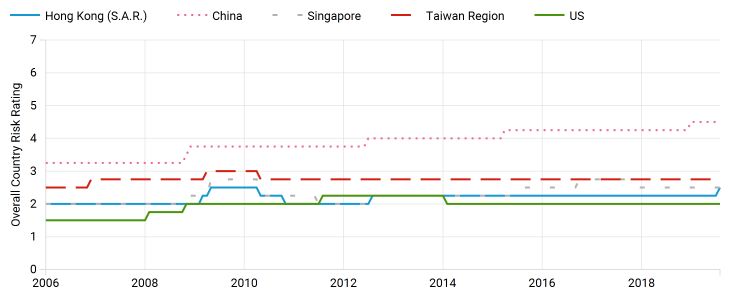
Country Insight Snapshot: Hong Kong (S.A.R.)
September 2019

KEY INDICATORS
Rating History and Comparison

Source: Dun & Bradstreet

Note: 1 = Low Risk, 7 = High Risk

Regional Comparisons

Source: Haver Analytics/Dun & Bradstreet

Industrial Production Growth (Quarterly)

Source: Haver Analytics/Dun & Bradstreet

© Dun & Bradstreet                             3
Country Insight Snapshot: Hong Kong (S.A.R.)
September 2019

Economic Indicators
Indicator                                  2016      2017   2018   2019f   2020f   2021f   2022f   2023f
C/A balance % GDP                              4.0    4.6    4.3     3.3     3.4     3.2     2.5     2.1
Govt balance, % GDP                            2.0    1.7    1.5    -0.4     0.6     0.4     0.8     0.7
Inflation, annual avge %                       2.4    1.5    2.4     2.2     2.2     2.3     1.8     1.8
Real GDP Growth, %                             2.2    3.8    3.0     0.0     1.0     2.0     2.3     2.1
Unemployment, %                                3.4    3.1    2.8     3.1     3.4     3.5     3.4     3.3

Source: Haver Analytics/Dun & Bradstreet

TRADE AND COMMERCIAL ENVIRONMENT
Hong Kong has one of the world’s best trade and commercial environments; maintaining its
competitiveness as a regional entrepot and commercial hub is a government priority. It ranks 4th
in the World Bank’s Doing Business 2019 index, and 7th in the World Economic Forum’s Global
Competitiveness Report 2018, including 2nd for both infrastructure and the financial system. The
business environment is heavily influenced by developments in mainland China, including: the
yuan’s value (as the HKD is pegged to the USD); economic growth; the strength of China’s
financial system (to which Hong Kong banks are exposed); and market volatility, given trading
links to the mainland equity and bond markets.
Growth in the second quarter of 2019 was weak at 0.5% y/y, and we now expect a brief recession
in H2 offsetting the growth in H1 - the weakest result in a decade. Private consumption was
already close to a standstill before protests against the suspended extradition bill intensified, and
the disruptions from three months of mass protests have further harmed commerce and
discouraged tourists. The law would have been a long-term negative for the business environment,
but if there is a hard-line Chinese backlash this could - in theory - still have an even-more-serious
impact, and result in an enduring pattern of capital flight.

TRADE TERMS AND TRANSFER SITUATION
Minimum Terms: OA
The minimum form of documentation or trading method that Dun & Bradstreet advises its
customers to consider when pursuing export trade with the stated country.
Recommended Terms: SD
Dun & Bradstreet's recommended means of payment. The use of recommended terms, which are
generally more stringent than minimum terms, is appropriate when a customer's payment
performance cannot be easily assessed or when an exporter may wish to limit the risk associated
with a transaction made on minimum terms.
Usual Terms: 30-90 days
Normal period of credit associated with transactions with companies in the stated country.
Local Delays: 0-1 month
The time taken beyond agreed terms for a customer to deposit money in their local bank as
payment for imports.
FX/Bank Delays: 0-1 month
The average time between the placement of payment by the importer in the local banking system
and the receipt of funds by the exporter. Such delays may be dependent on FX controls, FX
availability and the efficiency of the local banking system.

© Dun & Bradstreet                                                                                     4
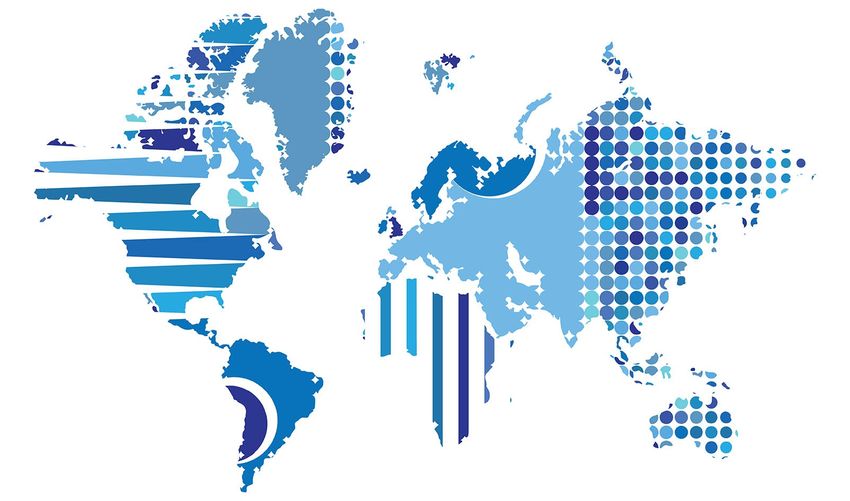
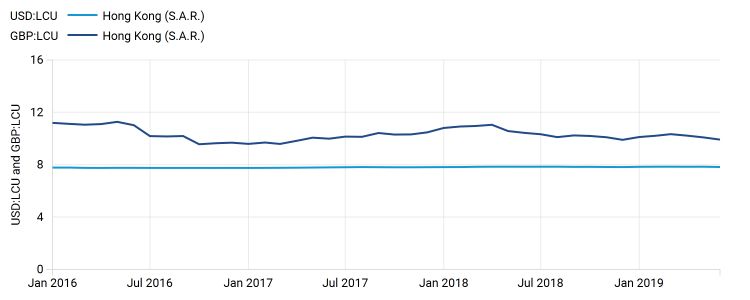
Country Insight Snapshot: Hong Kong (S.A.R.) September 2019 Exchange Rate Source: International Monetary Fund/Dun & Bradstreet LCU (local currency unit) = Hong Kong dollar Credit Conditions Source: Export Credit Agencies Insured export credit exposures, USDm; increase going into 2017 is partly due to methodology changes. © Dun & Bradstreet 5
Country Insight Snapshot: Hong Kong (S.A.R.)
September 2019

RISKS AND OPPORTUNITIES

Political/Insecurity Risk
Risk rating downgraded again
As protests continued for a third month, Dun & Bradstreet has cut the territory's risk rating a
further two notches to DB3a (with a stable outlook). This follows a one-notch cut last
month, when we indicated that the outlook was deteriorating rapidly making another downgrade
likely. A concession to protesters, such as the resignation of Carrie Lam, the chief executive, or an
enquiry into police tactics, might have been sufficient to mitigate tensions.
However, the Hong Kong government - urged on by China - has chosen not to give ground,
hoping that exhaustion and the start of the new academic year would take the protesters off the
streets. That has not happened yet and large numbers continue to turn out, including a rally in
Victoria Park on 18 August, where organisers estimated up to 2m people turned out, and a 50km
human chain on 23 August, deliberately mirroring a similar protest in the Baltic States against the
Soviet Union in 1989.
Furthermore, there was also a general strike on 5 August and sit-ins which led to the airport's
temporary closure on 12 August. There have also been several pro-government rallies, providing a
reminder of the divisions within Hong Kong. Police tactics have stiffened, including the first use of
water cannons on 25 August, and rumours have intensified about planning for a possible Chinese
military intervention.

Short-Term Economic Outlook
Crisis harms tourism and manufacturing
The Q2 GDP release showed that growth had slowed further to 0.5% y/y, from 0.6% y/y in Q1,
and was the slowest rate of growth in a decade. This is a sharp slowdown compared with 4.7%
y/y growth in Q1 2018. The quarterly performance was also weak, declining -0.4% q/q, the
weakest in over three years. The final month of the quarter included the period of protests which
led to the suspension of the extradition bill in June, although it was not until June that the crisis
broadened beyond this issue and became more violent on both sides.
Already in June tourism data showed a marked slowdown, with the total number of visitors
dropping by -13% m/m, compared with only a -4% m/m seasonal decline in June 2018. The
impact of the cyclical slowdown, combined with the protests, was visible in other recent
indicators. The contraction in retail sales continued for a third month and deepened to -6.7% y/y
in June, the most in three years (excluding months distorted by the lunar new year). Imports
declined for an eighth consecutive month and by -8.7%, the most in over three years. The starkest
change was in the Manufacturing Purchasing Managers Index (PMI) which dropped to 43.8, from
47.9. This was the lowest reading since March 2009, at the low point in the global recession, and
also one of the sharpest monthly declines on record. Even unemployment, which has been steady
for over a year and at a 20-year low, ticked up slightly to 2.9%.
The next week will see the release of July retail sales and tourism and the August PMI, all of
which are likely to show further deterioration. Other impacts of the crisis include a delay to the
planned dual listing of Alibaba, the Chinese e-commerce giant. We now expect a mild recession in
the second half of the year, due to weak private consumptions and exports, resulting in no overall
growth in 2019.

© Dun & Bradstreet                                                                                  6
Country Insight Snapshot: Hong Kong (S.A.R.)
September 2019

COUNTRY PROFILE AND STATISTICS
Overview
Hong Kong is a special administrative region (SAR) of the People’s Republic of China. Its Basic
Law was agreed in bilateral negotiations between China and Britain, which returned the territory
in 1997. The SAR retains its own customs arrangements, currency, British-style bureaucracy and
legal system; its 1,000-square-kilometre territory on the South China Sea includes Hong Kong
Island and the ‘New Territories’.
China exercises indirect (but effectively absolute) powers of appointment over the post of SAR
chief executive and enjoys strong influence over its business community, which nominates half the
seats to the legislature. Chinese People’s Liberation Army personnel are stationed in the SAR, but
confined to barracks. Hong Kong moved from being a manufacturing hub in the 1970s to a global
financial centre and regional hub for corporate headquarters. It has benefitted from the growth of
the Chinese economy, but grappled with economic and political issues arising from the
increasingly free movement of mainland citizens in Hong Kong as tourists and consumers, and the
disjuncture between the national education systems of the mainland and Hong Kong.

Key Facts
Key Fact                                       Detail
Head of state                                  President of China Xi Jinping
Capital                                        Hong Kong (S.A.R.)
Timezone                                       GMT +08-00
Official languages                             Chinese (Cantonese), English
Population (millions)                                                                               7.5
GDP (USD billions)                                                                                362.7
GDP per capita (USD)                                                                             48,681
Life expectancy (years)                                                                            84.1
Literacy (% of adult pop.)                                                                         99.9
Surface area (sq km)                                                                              1,092

Source: Various sources/Dun & Bradstreet

Historical Data
Metric                                                   2014         2015      2016     2017     2018
Real GDP growth (%)                                        2.8          2.4       2.2      3.8      3.0
Nominal GDP in USDbn                                      291          309       321      342      363
Nominal GDP in local currency (bn)                       2,260       2,398      2,491    2,663    2,843
GDP per Capita in USD                                   40,310      42,430     43,734   46,228   48,681
Population (year-end, m)                                   7.2          7.3       7.3      7.4      7.5
Exchange rate (yr avge, USD-LCU)                           7.8          7.8       7.8      7.8      7.8
Current Account in USDbn                                   4.1        10.3       12.7     15.9     15.6
Current Account (% of GDP)                                 1.4          3.3       4.0      4.6      4.3
FX reserves (year-end, USDbn)                            328.5       358.8      386.3    431.4    424.6
Import Cover (months)                                      6.4          7.2       7.8      8.1      7.5
Inflation (annual avge, %)                                 4.4          3.0       2.4      1.5      2.4
Govt Balance (% GDP)                                       1.8          2.1       2.0      1.7      1.5

Source: Haver Analytics/Dun & Bradstreet

© Dun & Bradstreet                                                                                    7
Country Insight Snapshot: Hong Kong (S.A.R.)
September 2019

Forecasts
Metric                                                          2019f               2020f             2021f             2022f          2023f
Real GDP growth (%)                                                  0.0                1.0                2.0            2.3            2.1
Nominal GDP in USDbn                                                372                385             402               417            431
Nominal GDP in local currency (bn)                              2,906               2,999             3,128             3,255          3,382
GDP per Capita in USD                                          49,626              51,097            53,093            54,825        56,472
Population (year-end, m)                                             7.5                7.5                7.6            7.6            7.6
Exchange rate (yr avge, USD-LCU)                                     7.8                7.8                7.8            7.8            7.8
Current Account in USDbn                                            12.2               13.2            12.9              10.3            9.1
Current Account (% of GDP)                                           3.3                3.4                3.2            2.5            2.1
FX reserves (year-end, USDbn)                                   395.9               406.5             432.8             451.5          471.0
Import Cover (months)                                                7.0                7.0                7.2            7.3            7.4
Inflation (annual avge, %)                                           2.2                2.2                2.3            1.8            1.8
Govt Balance (% GDP)                                                -0.4                0.6                0.4            0.8            0.7

Source: Haver Analytics/Dun & Bradstreet

Comparative Market Indicators
Indicator                                      Hong Kong (S.A.R.)          China         Singapore         Taiwan Region          US
Income per Capita (USD)                                       49,626           9,831          62,072                    24,734       65,259
Country Population (m)                                              7.5      1,433.8                 5.8                   23.6        329.1
Internet users (% of population)                                87.3             53.2            81.0                      79.7         76.2
Real GDP Growth (% p.a., 2019 - 2028)          1.8 - 3.2                   4.5 - 6.5     3.2 - 5.7         1.5 - 3.5              1.8 - 2.5

Source: Various sources/Dun & Bradstreet

© Dun & Bradstreet                                                                                                                            8
Country Insight Snapshot: Hong Kong (S.A.R.)
September 2019

LINKS
User Guide
      Please click here to visit our online user guide.
Other Dun & Bradstreet Products and Services
Sales                                                     Publisher
Email: countryinsight@dnb.com                             Dun & Bradstreet
Telephone                                                 Marlow International
UK: +44 (0)1628 492700                                    Parkway
US: +1 800 234 3867                                       Marlow
Rest of World                                             Bucks SL7 1AJ
contact your local office                                 United Kingdom
or call +44 1628 492700                                   Tel: 01628 492000
                                                          Fax: 01628 492929
                                                          Email: countryinsight@dnb.com

Dun & Bradstreet provides information relating to more than 285m companies worldwide. Visit
www.dnb.com for details. Additional information relevant to country risk can be found in the
online International Risk & Payment Review, which provides timely and concise economic,
political and commercial information and analysis on 132 countries. This subscription-based
service (www.dnbcountryrisk.com) carries essential information on payment terms and delays. It
also includes the unique Dun & Bradstreet Country Risk Indicator to help monitor changing
market conditions.
Legal and Copyright Notices
While the editors endeavour to ensure the accuracy of all information and data contained in this
Country Insight Report, neither they nor Dun & Bradstreet Limited accept responsibility for any
loss or damage (whether direct or indirect) whatsoever to the customer or any third party resulting
or arising therefrom.
© All rights reserved. No part of this publication may be reproduced or used in any form or by
any means graphic, electronic or mechanical, including photocopying, recording, taping, or
information storage and retrieval systems without permission of the publisher.
Disclaimer
Whilst Dun & Bradstreet attempts to ensure that the information provided in our country reports
is as accurate and complete as possible, the quantity of detailed information used and the fact that
some of the information (which cannot always be verified or validated) is supplied by third parties
and sources not controlled by Dun & Bradstreet means that we cannot always guarantee the
accuracy, completeness or originality of the information in some reports, and we are therefore not
responsible for any errors or omissions in those reports. The recipients of these reports are
responsible for determining whether the information contained therein is sufficient for use and
shall use their own skill and judgement when choosing to rely upon the reports.

© Dun & Bradstreet                                                                                 9
You can also read