Country Insight Snapshot South Africa - July 2019 - Written 28 June 2019 - Bisnode
←
→
Page content transcription
If your browser does not render page correctly, please read the page content below
Country Insight Snapshot
South Africa
July 2019

                    Written 28 June 2019
Country Insight Snapshot: South Africa
July 2019

OVERVIEW
 OVERALL COUNTRY RISK RATING: DB4c
 Moderate risk: Significant uncertainty over expected returns. Risk-averse customers are
 advised to protect against potential losses.
 Rating Outlook:          Improving

CORE OUTLOOK
      + President Ramaphosa is pushing ahead with a political and economic reform agenda to
      improve governance and economic performance.
      + South Africa will continue to attract large amounts of FDI, which will remain a crucial
      source of finance to cover the current account deficit.
      - The economy is being adversely affected by severe load-shedding imposed by the cash-
      strapped national power company Eskom.
      - Property rights protection is uncertain, given potential land reforms that entail
      expropriation without compensation.

KEY DEVELOPMENT
The South African economy stalls in Q1 2019 amid deep power cuts affecting agriculture, mining
and manufacturing.
CREDIT ENVIRONMENT OUTLOOK

 Trend:       Stable

      Key Development has had a negative impact on the outlook.
SUPPLY ENVIRONMENT OUTLOOK

 Trend:       Stable

      Key Development has had a neutral impact on the outlook.

MARKET ENVIRONMENT OUTLOOK

 Trend:       Stable

      Key Development has had a neutral impact on the outlook.
POLITICAL ENVIRONMENT OUTLOOK

 Trend:       Stable

      Key Development has had a neutral impact on the outlook.

© Dun & Bradstreet                                                                            2
Country Insight Snapshot: South Africa July 2019 KEY INDICATORS Rating History and Comparison Source: Dun & Bradstreet Note: 1 = Low Risk, 7 = High Risk Regional Comparisons Source: Haver Analytics/Dun & Bradstreet Industrial Production (Index) Source: Haver Analytics/Dun & Bradstreet © Dun & Bradstreet 3
Country Insight Snapshot: South Africa
July 2019

Economic Indicators
Indicator                                    2016      2017      2018     2019f     2020f     2021f     2022f     2023f
C/A balance % GDP                             -2.8      -2.5      -3.5      -3.4      -3.2      -3.2      -3.2      -3.0
Gold avg USD/ounce                         1,249.0   1,257.6   1,269.2   1,310.2   1,314.7   1,320.3   1,322.5   1,323.8
Govt balance, % GDP                           -3.8      -4.4      -4.4      -4.5      -4.3      -4.2      -4.1      -4.0
Inflation, annual avge %                       6.3       5.3       4.6       4.4       5.0       5.5       5.5       5.5
Real GDP Growth, %                             0.4       1.4       0.8       1.0       1.9       2.2       2.3       2.5

Source: Haver Analytics/Dun & Bradstreet

TRADE AND COMMERCIAL ENVIRONMENT
The South African economy stalled in Q1 2019 as deep power cuts adversely affected output in
various sectors. Subdued economic growth, downbeat business confidence and comfortable
consumer price inflation could prompt the South African Reserve Bank to cuts its benchmark
interest rate in H2 2019 to help boost economic growth. Disappointing economic data and policy
disagreements within the ruling ANC weighed on the South African rand in Q2 2019. President
Ramaphosa has reshaped the cabinet and is pushing ahead with political and economic reforms
that aim to tackle corruption, reassure investors and boost job creation. The authorities
implemented a carbon tax in June, although allowances mean that the effective tax rate will
remain very low until 2023 at the earliest. Currently, Dun & Bradstreet expects the economy to
grow by 1.0% in 2019 and 1.9% in 2020. We continue to recommend LC terms in all trade
dealings with South Africa.

TRADE TERMS AND TRANSFER SITUATION
Minimum Terms: SD
The minimum form of documentation or trading method that Dun & Bradstreet advises its
customers to consider when pursuing export trade with the stated country.
Recommended Terms: LC
Dun & Bradstreet's recommended means of payment. The use of recommended terms, which are
generally more stringent than minimum terms, is appropriate when a customer's payment
performance cannot be easily assessed or when an exporter may wish to limit the risk associated
with a transaction made on minimum terms.
Usual Terms: 30-90 days
Normal period of credit associated with transactions with companies in the stated country.
Local Delays: 0-1 month
The time taken beyond agreed terms for a customer to deposit money in their local bank as
payment for imports.
FX/Bank Delays: 0-1 month
The average time between the placement of payment by the importer in the local banking system
and the receipt of funds by the exporter. Such delays may be dependent on FX controls, FX
availability and the efficiency of the local banking system.

© Dun & Bradstreet                                                                                                     4
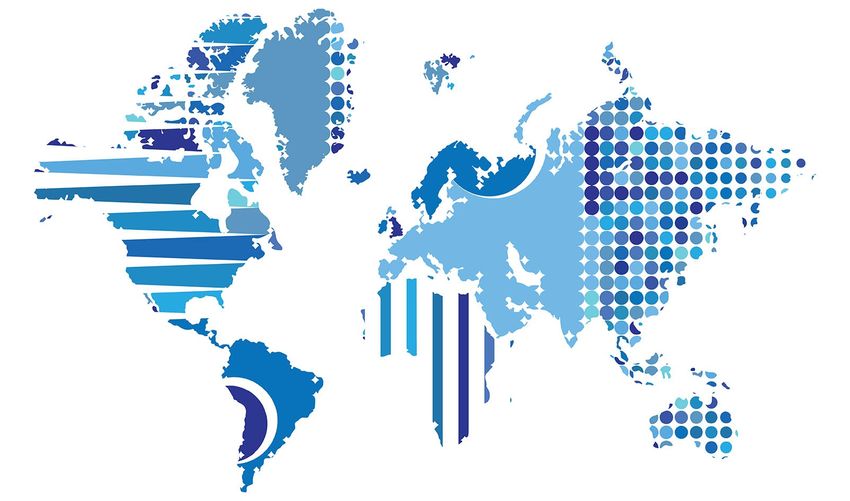
Country Insight Snapshot: South Africa
July 2019

Exchange Rate

Source: International Monetary Fund/Dun & Bradstreet

LCU (local currency unit) = South African rand

Credit Conditions

Source: Export Credit Agencies

Insured export credit exposures, USDm; increase going into 2017 is partly due to methodology
changes.

© Dun & Bradstreet                                                                         5
Country Insight Snapshot: South Africa
July 2019

RISKS AND OPPORTUNITIES

Short-Term Economic Outlook
Economy stumbles in Q1 2019
South African real GDP grew by 0.8% in 2018 and then surprisingly flatlined in Q1 2019. Real
GDP declined by an annualised 3.2% q/q in Q1 2019, which was the equivalent of zero growth
y/y for the quarter. The downturn was the worst quarterly outcome since the recession of 2009
and was largely as a result of deep power cuts that affected manufacturing, mining and
agriculture. Other sectors that contracted were utilities, transport, trade and construction. On the
other hand, personal services, finance and the government sector posted growth in Q1. In addition
to the poor GDP data, consumer and business confidence indicators were generally downbeat
during the first four months of 2019. The composite purchasing managers' index (PMI) was
recorded at 49.3 in May and was just short of the 50.3 registered in April, which suggests a slight
deterioration in the health of private sector business. General business confidence has slipped in
each quarter since the beginning of 2018. Consumer confidence remains slightly more upbeat
largely as a result of continued job creation and slightly higher wages over recent quarters.
Soft GDP data, weak household spending, subdued business confidence levels and modest
consumer price pressures could prompt the South African Reserve Bank to cut its benchmark
interest rate in July or soon thereafter, in order to spur faster economic growth. Annual consumer
price inflation was just 4.5% y/y in May, which is comfortably within the central bank target
range of 3.0-6.0%. Currently, we expect real GDP growth to pick up in H2 2019 as policy levers
boost economic activity and sentiment improves. However, growth will remain modest and
average 1.0% for the year as a whole, while faster real GDP growth of 1.9% is anticipated in
2020.

Business Regulatory Environment
Carbon tax implemented
The South African government implemented a carbon tax on 1 June. The initial carbon tax rate
will be ZAR120 per tonne of CO2 emissions, although various allowances create an effective rate
of somewhere between ZAR6 and ZAR48 per tonne. The starting point in terms of tax burden is
very light for South African industry and way below international standards, while large discounts
will apply until 2023. The government believes the low initial rate will grant large emitters enough
time to adjust their business to shoulder a higher rate thereafter, while prompting a switch in
consumption and more investment in renewable technologies, especially during the mid-to-late
2020s.
However, South Africa's renewable energy road map remains a work in progress: highly uncertain
and greater clarity on the direction of policy is required to attract larger investments into the
renewable energy mix. Currently, the government is clearly focused on resolving the financial and
structural issues at the state-owned electricity company Eskom, and once this headache is resolved
there could be more attention paid to better tackling climate change and greener energy policies.

© Dun & Bradstreet                                                                                 6
Country Insight Snapshot: South Africa
July 2019

COUNTRY PROFILE AND STATISTICS
Overview
South Africa is situated at the southern tip of Africa and is a driving force behind regional trade
through the Southern African Development Community (SADC) and the more compact Southern
African Customs Union (SACU). South Africa has a diversified economy, well-developed banking
and business services sectors, strong trade-facilitating infrastructure and a skilled workforce. The
economy is open to foreign investment and is highly industrialised by regional standards. The
country does suffer from power outages, industrial strike action and a high cost of cime in major
urban areas. The African National Congress (ANC) party has dominated national politics since
1994. Cyril Ramaphosa became national president in February 2018 (following the resignation of
former president Jacob Zuma). He was re-elected as president in May 2019 and the ANC retained
its parliamentary majority. South Africa is attempting to improve its government effectiveness,
enhance the business environment and raise the country's attractiveness as an investment
destination.

Key Facts
Key Fact                                   Detail
Head of state                              President Cyril RAMAPHOSA
Capital                                    Tshwane/Pretoria
Timezone                                   GMT +02-00
Official languages                         Eleven, including- Xhosa, Zulu, Afrikaans & English
Population (millions)                                                                                                 57.8
GDP (USD billions)                                                                                                  368.1
GDP per capita (USD)                                                                                                6,370
Life expectancy (years)                                                                                               62.0
Literacy (% of adult pop.)                                                                                            94.4
Surface area (sq km)                                                                                             1,219,090

Source: Various sources/Dun & Bradstreet

Historical Data
Metric                                                                  2014         2015        2016    2017        2018
Real GDP growth (%)                                                       1.8          1.2         0.4     1.4         0.8
Nominal GDP in USDbn                                                      351         318         296     349         368
Nominal GDP in local currency (bn)                                      3,805       4,050        4,359   4,654      4,874
GDP per Capita in USD                                                   6,433       5,734        5,271   6,129      6,370
Population (year-end, m)                                                 54.5        55.4         56.2    57.0        57.8
Exchange rate (yr avge, USD-LCU)                                         10.8        12.8         14.7    13.3        13.2
Current Account in USDbn                                                -17.7        -14.6        -8.4    -8.9       -13.0
Current Account (% of GDP)                                                -5.1        -4.6        -2.8    -2.5        -3.5
FX reserves (year-end, USDbn)                                            44.3        41.6         42.6    45.5        46.5
Import Cover (months)                                                     4.6          5.0         5.7     5.5         5.4
Inflation (annual avge, %)                                                6.1          4.6         6.3     5.3         4.6
Govt Balance (% GDP)                                                      -4.3        -4.1        -3.8    -4.4        -4.4

Source: Haver Analytics/Dun & Bradstreet

© Dun & Bradstreet                                                                                                       7
Country Insight Snapshot: South Africa
July 2019

Forecasts
Metric                                                    2019f            2020f           2021f          2022f        2023f
Real GDP growth (%)                                             1.0             1.9           2.2           2.3             2.5
Nominal GDP in USDbn                                           357             381          409            440              475
Nominal GDP in local currency (bn)                            5,137        5,492           5,914          6,376        6,886
GDP per Capita in USD                                         6,092        6,417           6,817          7,237        7,728
Population (year-end, m)                                       58.6            59.3         60.0           60.8            61.5
Exchange rate (yr avge, USD-LCU)                               14.4            14.4         14.5           14.5            14.5
Current Account in USDbn                                      -12.0        -12.0           -13.1          -13.9            -14.4
Current Account (% of GDP)                                     -3.4            -3.2         -3.2           -3.2             -3.0
FX reserves (year-end, USDbn)                                  48.0            49.0         49.5           49.5            50.0
Import Cover (months)                                           5.5             5.6           5.6           5.6             5.6
Inflation (annual avge, %)                                      4.4             5.0           5.5           5.5             5.5
Govt Balance (% GDP)                                           -4.5            -4.3         -4.2           -4.1             -4.0

Source: Haver Analytics/Dun & Bradstreet

Comparative Market Indicators
Indicator                                  S. Africa          Brazil           Ghana          Nigeria          Tanzania
Income per Capita (USD)                           6,092                8,871          2,323          2,297             1,018
Country Population (m)                                 58.6            210.7           30.1          201.0                 60.9
Internet users (% of population)                       54.0             59.7           34.7             25.7               13.0
Real GDP Growth (% p.a., 2019 - 2028)      1.5 - 2.5          1.0 - 2.0        4.5 - 5.5      5.5 - 7.0        5.5 - 7.0

Source: Various sources/Dun & Bradstreet

© Dun & Bradstreet                                                                                                             8
Country Insight Snapshot: South Africa
July 2019

LINKS
User Guide
      Please click here to visit our online user guide.
Other Dun & Bradstreet Products and Services
Sales                                                     Publisher
Email: countryinsight@dnb.com                             Dun & Bradstreet
Telephone                                                 Marlow International
UK: +44 (0)1628 492700                                    Parkway
US: +1 800 234 3867                                       Marlow
Rest of World                                             Bucks SL7 1AJ
contact your local office                                 United Kingdom
or call +44 1628 492700                                   Tel: 01628 492000
                                                          Fax: 01628 492929
                                                          Email: countryinsight@dnb.com

Dun & Bradstreet provides information relating to more than 285m companies worldwide. Visit
www.dnb.com for details. Additional information relevant to country risk can be found in the
online International Risk & Payment Review, which provides timely and concise economic,
political and commercial information and analysis on 132 countries. This subscription-based
service (www.dnbcountryrisk.com) carries essential information on payment terms and delays. It
also includes the unique Dun & Bradstreet Country Risk Indicator to help monitor changing
market conditions
Legal and Copyright Notices
While the editors endeavour to ensure the accuracy of all information and data contained in this
Country Insight Report, neither they nor Dun & Bradstreet Limited accept responsibility for any
loss or damage (whether direct or indirect) whatsoever to the customer or any third party resulting
or arising therefrom.
© All rights reserved. No part of this publication may be reproduced or used in any form or by
any means graphic, electronic or mechanical, including photocopying, recording, taping, or
information storage and retrieval systems without permission of the publisher.
Disclaimer
Whilst Dun & Bradstreet attempts to ensure that the information provided in our country reports
is as accurate and complete as possible, the quantity of detailed information used and the fact that
some of the information (which cannot always be verified or validated) is supplied by third parties
and sources not controlled by Dun & Bradstreet means that we cannot always guarantee the
accuracy, completeness or originality of the information in some reports, and we are therefore not
responsible for any errors or omissions in those reports. The recipients of these reports are
responsible for determining whether the information contained therein is sufficient for use and
shall use their own skill and judgement when choosing to rely upon the reports.

© Dun & Bradstreet                                                                                 9
You can also read