OOh!media Covid-19 Pulse Report - Getting you ahead of the curve Making Brands Powerfully Unmissable
←
→
Page content transcription
If your browser does not render page correctly, please read the page content below
oOh!media
Covid-19 Pulse Report
Getting you ahead of the curve

Monday 21st September 2020
Edition 20 – Australian states at a glance: South Australia market spotlight

Making Brands Powerfully Unmissable
As the nation continues to welcome Spring and an opportunity for
localized holidays across the upcoming October Long Weekend, most
Australians continue to enjoy destinations outside the home with fewer/
low active Covid-19 cases in their communities.
With encouraging news coming out of Victoria of declining new case
numbers and the slight relaxing of restrictions extending time spent
outdoors, Victorians continue to gain hope from neighbouring South
Australia and life on the other side of the outbreak curve.
With South Australia declared a success in early April 2020 given the states’
quick containment of Covid-19 as part of the initial nationwide lockdown,
South Australia has at the opportunity to reopen their state economy
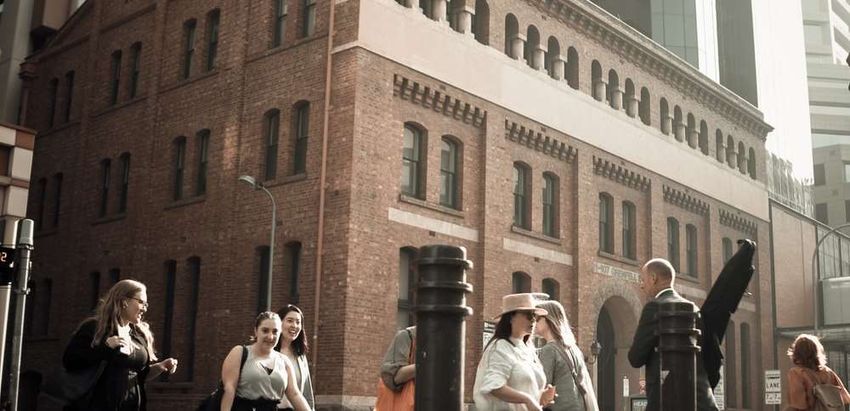
quicker than bordering states. Professionals are reuniting with colleagues at
their place of employment, state-based travel to SA’s natural wonders has
recommenced, and confidence towards future discretionary spend levels
sit above those observed pre Covid-19.
As a continuation of our state-specific insights series, this week’s report
takes a deep dive into South Australians and their confidence towards the
future of the state, their employment and financial wellbeing, and the
trajectory of business performance. This report also takes a look into
resident’s future intentions when it comes to how they plan to spend their
time and money across key categories inside and outside the home.
2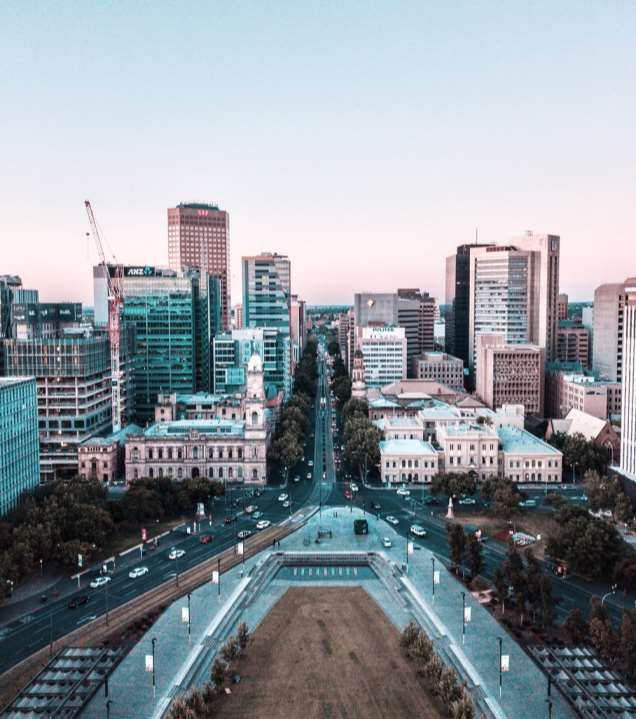
Trends covered

    Here and Now:
    National consumer confidence update

    A Look to the Future:
    Updated spending behavior and consumer
    attitudes and intentions data for SA residents vs.
    the national average

3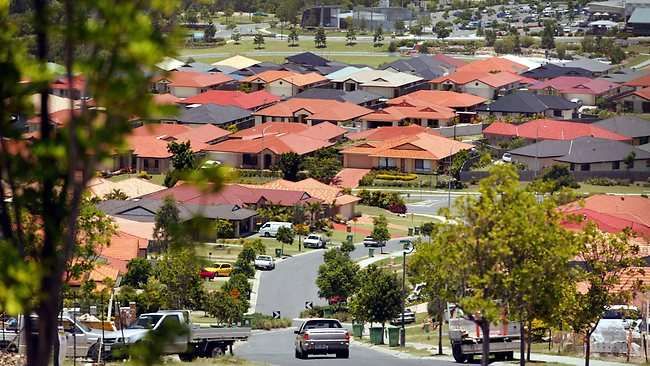
Dspark
    data usage disclaimer

                                                         For Dspark, “Competitor” means each of the entities below and their Related
                                                         Bodies Corporate:
    Whilst we endeavor to share as much as we can        (a) Telstra Corporation Limited, only where the Customer Group is providing
    with our valued partners, due to commercial               services directly to Telstra Corporation Limited or its Related Bodies Corporate
                                                              (services provided by a media agency or other intermediaries to Telstra
    agreements the insights provided by Dspark                Corporation Limited or its Related Bodies Corporate shall not be deemed to be
    within this Pulse report are not available for use        in breach of clause 2.3);
                                                         (b) Google LLC;
    by competitors to Dspark.                            (c) Here Global B.V.;
                                                         (d) TomTom International BV;
                                                         (e) Any person or entity (other than Dspark or its Related Bodies Corporate) which
                                                         is in the business of providing geospatial insights from telecommunications, GPS,
    We thank you for your understanding as we            WiFi and other similar data that informs movement to the public, in the Territory,
                                                         using the retail brand names used or owned by any of the persons or entities listed
    abide by our contractual agreements                  above in (a) to (d), or the Related Bodies Corporate of any such person or entity;
                                                         and
                                                         (f) Any person or entity (other than Dspark or its Related Bodies Corporate) which is
                                                         in the business of providing geospatial insights from telecommunications, GPS, WiFi
                                                         and other similar data that informs movement to the public, in the Territory

4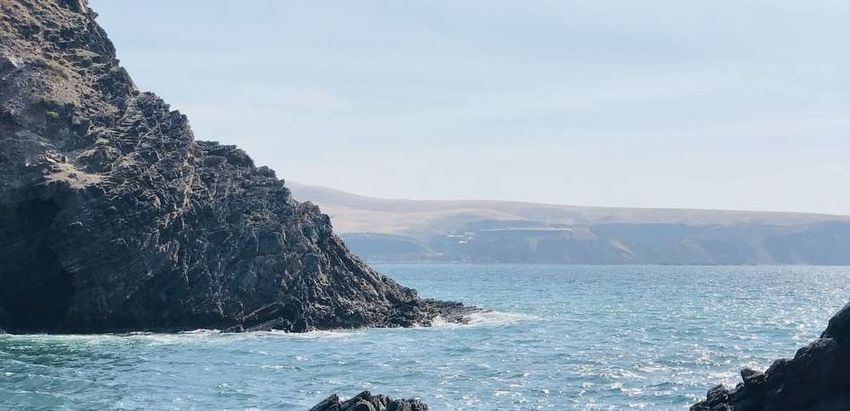
Here & Now

Current Consumer Confidence compared to June 2020 state reopening's
June 2020 across the nation saw the reopening of states prior to
Victoria’s second wave of outbreak. By comparing September 2020
confidence by state compared to June, consumer confidence is
tracking ahead for much of the nation1 with a resurgence in
confidence anticipated with the further relaxation of current
restrictions.
QLD NSW VIC SA WA
+2% +0% -5.6% +3.8% +11.2%
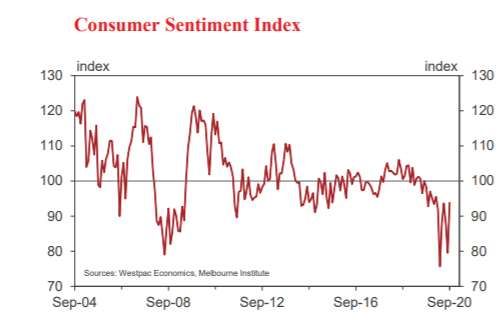
Consumer Confidence extends to the future
Westpac-Melbourne Institute Index of Consumer Sentiment in
September 2020 also reports YOY uplift for confidence towards the
horizon with ‘Family Finances vs. a year ago’ up 3.7%, ‘Family Finances
next year’ up 4.5% and ‘Economic conditions over the next 5 years’ up
2.1% compared to same time last year1.
6
Source: Westpac, Bulletin-Consumer sentiment roars back despite news of recession, 9th September 2020
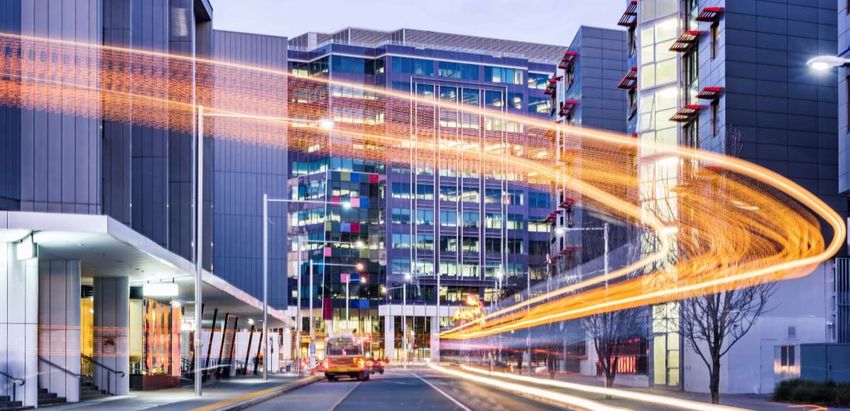
A Look to the Future:
Australian States At A Glance:
South Australia Market Spotlight
SA Covid-19 Community Outbreak                                                                                                      SA State Mobility to outdoor destinations
                                                                                                                                        With no active cases of Covid-19 in the state3 life in South
    With the third highest rates of testing conducted nationally, long
                                                                                                                                        Australia has recovered from initial nation-wide lockdowns earlier
    periods of no new Covid-19 cases and the lowest positive case test
                                                                                                                                        in the year. Google mobility data this month reports an almost full
    rates recorded along with Queensland3, South Australia has been in
                                                                                                                                        return to workplaces, as well as visitation to retail, grocery and
    an enviable position on the other side of the outbreak curve for some
                                                                                                                                        parks above pre Covid-19 levels4.
    months.

                                                                                                                                        SA Travel Modes
                                                                                                                                        Apple South Australia Mobility data for 11th September reports
                                                                                                                                        driving and walking tracking ahead compared to Jan 2020 levels,
                                                                                                                                        +19% and +10% respectively. Additionally travel by transit is only
                                                                                                                                        marginally down at -3% compared to patterns recorded at the
                                                                                                                                        start of the year5.

     Source: 1 Government of South Australia, Department of Treasury, Commercial and Economics Branch 15 November 2019 Public – I2 – A1. Source: 2 ABS, 3101.0 - Australian Demographic Statistics, Dec 2019, Source: 3 ABC.net.au,
8    Charting the Covid-19 spread in Australia, accessed 15th September 2020 (Covid-19 Community Outbreak Graph shown above). Source: 4 Google Community Mobility Reports, 11 th September 2020. The baseline is the median
     value, for the corresponding day of the week, during the five-week period 3 Jan – 6 Feb 2020. (South Australia State Mobility Data shown above). Source: 5 Apple, Mobility Trends Report, 11th September 2020
South Australian’s are returning to
places of work!
Audiences in Adelaide CBD at 80% of
2019 levels, +40% higher vs. the national
average
9 Source: DSpark, oOh! Roadside, Adelaide CBD locations vs. average of Roadside locations across 5 metro markets, week ending September 7 2020NAB State Economic August 2020 Overview reports positive business
conditions in SA for the month prior, the second highest across the nation
behind Tasmania2.
Across the three months ending July 2020, 61% of SA residents report their
jobs haven’t been impacted by Covid-19, 5% points higher than the
national figure and sharing top-position with Queensland1. SA residents leading confidence in their State!
Commsec using ABS data reported payroll jobs in SA rose 1.1%, for the At the end of April 2020 as case numbers drastically dropped across South
period 8th-22nd August 2020, the second highest gain across the nation Australia, State Premier Steven Marshall had the backing of 82% of local
behind Tasmania3. voters with regards to the handling of Covid-194.
And looking to the future, 94% of SA residents are confident their More broadly across the three months ending July 2020, 94% of SA
employment position will be maintained or improve, 4% points higher than residents say their confidence has maintained or grown towards the State
the national average and the highest confidence across the states1. Government given their response to Covid-191.
Confidence held by SA residents towards the State Government is 8%
points higher than the national average and the highest confidence
across the nation, a position shared equally with Western Australia1.
Source: 1 oOh!media Pulse Report | Timing Wave 1: 1st- 4th May, 2020 Wave 2:18th- 19th May, 2020 Wave 3: 1st -
10 3rd June 2020 Wave 4: 24th - 28th July 2020| Research Panel: Dynata| Australians aged 16+, n=3,726, Wave 1:
n=2,212 / Wave 2: n=423/ Wave 3: n=318/ Wave 4: n= 773. All SA reported above n=278. Source: 2 NAB, State
Economic Overview, August 2020. Source: 3 Commsec Economic Insights, Australia’s multi-speed economy, 8th
September 2020 Source: 4 The Australian, Premiers riding a wave of popularity, 28 th April 2020.Compared to before the Covid-19 outbreak, SA residents agree…
74% are generally more 6 in 10 are eager to
appreciative of the outdoors be out for longer
and outdoor destinations1 amounts of time1
7 in 10 are more appreciative of once mundane day-to-day
activities that allow me to be out and about such as commuting
to work, 4% points higher than the national average1
With SA oOh! roadside audience volumes at 94% of 2019 levels for w/e 7th
September 20202, audiences within the state continue to track towards YoY
76% are more alert and 78% are generally happier
mobility levels.
aware of their to be out and about1
surroundings1
So too are SA residents continuing to take full-advantage of the retail
experience with oOh! Retail audiences in SA at 93% for w/e 7th September
2020 compared to same time last year2. Compared to pre Covid-19 levels, SA residents intend to maintain
or increase visitation to destinations outside the home …
81% visit entertainment 77% attend live
precincts e.g. cinema1 sports events1
81% attend state-based 86% visit cafes, pubs
festivals and/or events1 and venues1
Source: 1 oOh!media Pulse Report | Timing Wave 1: 1st- 4th May, 2020 Wave 2:18th- 19th May, 2020 Wave 3: 1st -3rd June 2020 Wave 4:
11 24th - 28th July 2020| Research Panel: Dynata| Australians aged 16+, n=3,726, Wave 1: n=2,212 / Wave 2: n=423/ Wave 3: n=318/ Wave 4:
n= 773. All SA reported above n=278. Source: 2 Dspark data, Roadside and Retail locations, week ending Sept 7 th 2020 vs. same week
2019. Source: 3 Hospitalitymagazine.com.au, Job ads are up for the hospitality industry, 18 th June 2020South Australian Road Trips
64% of SA residents are keen to travel and explore their state, 7% points higher
than the national average, making SA residents most keen to explore their
own backyard, a position shared equally with Queenslanders1.
Half of all SA residents intend to take long road trips of 2+ more nights stay as
restrictions continue to ease1.
In SA w/e 7th September 2020, spend on fuel continues to track to pre Covid-
19 levels with spend for road related travel at 94% of baseline5.
SA Tourism Industry bounce-back
Interestingly, SA residents are 18% less likely than the average Australian to
Historically, SA’s share of international tourists has been much lower than its be open to travel interstate, with only 1 in 3 SA residents keen to explore
share of domestic tourists. With the state tourism industry protected by the another state/s within Australia when easing restrictions are announced1.
global impacts of Covid-19 a quicker bounce-back is expected in the industry
compared to the position of other states2.
Australians across the border keen to travel to SA
Since May 2020, with the reopening of the state post lockdown, there has been With the announcement of borders reopening to most Australians without the
an increase in tourism activity; Big 4 reported that SA had the highest surge in need to quarantine, Australians outside the state are keen to explore SA…
interest and bookings across the country, a boutique luxe villa complex in the
Adelaide Hills had 100 bookings in 10 days, and campground bookings into the 6 in 10 Australians living outside SA are planning to holiday in
National Parks website were up 120%3. another Australian state in the next 12 months1.
“There's been a slight silver lining to the COVID-19 for regional tourism. People Over half of Australians living outside the state would be happy
who have traditionally, in winter, travelled overseas are now saying: 'Well, look, to travel to South Australia with easing border restrictions1.
let's make this an annual trip to outback South Australia or an annual trip to
regional South Australia. There's an uptick at the moment in terms of
transactions in regional South Australia, but that could flow on to a permanent
uptick”4 , State Premier Steven Marshall in September 2020
Source: 1 oOh!media Pulse Report | Timing Wave 1: 1st- 4th May, 2020 Wave 2:18th- 19th May, 2020 Wave 3: 1st -3rd June 2020 Wave 4:
24th - 28th July 2020| Research Panel: Dynata| Australians aged 16+, n=3,726, Wave 1: n=2,212 / Wave 2: n=423/ Wave 3: n=318/ Wave 4:
12 n= 773. All SA reported above n=278. Source: 2 ABC.com.au, Why South Australia could lead the nation in economic recovery from
coronavirus, 7th May 2020. Source: 3 Mumbrella, South Australia welcomes people back as domestic tourism becomes a possibility, 18th
May 2020. Source: 4 ABC.net.au, $20 million fund to boost SA tourism industry's 'silver lining' coronavirus recovery, 13th September 2020.
Source: 5 Dspark data, Roadside locations, week ending Sept 7th 2020 vs. same week 2019.Money Power
Looking to the future, 83% expect their discretionary income i.e. ability to
buy products and services will be maintained or increase, 3% points higher
than the national average1.
SA Property Market
Properties are selling, with the Adelaide clearance rate the second highest
across the nation for weekend 12th/13th September2
"We are in a better position than other states. Our market is less reliant on Other big purchases on the agenda
foreign investment, it's less reliant on investor activity" Real Estate Institute of
SA GM, Andrew Shields3
In the “new-normal” once all social distancing restrictions are
With eased restrictions, SA residents aged under 40… removed and borders reopen to all, SA residents intend to…
Over 1 in 5 intend to buy a new home or apartment1.
Over 1 in 4 intend to buy a new car1.
Over 1 in 10 intend to move to a regional area, as opposed to the
city1.
Half intend to plan a holiday in an overseas
destination/s, once international borders permit1.
Source: 1 oOh!media Pulse Report | Timing Wave 1: 1st- 4th May, 2020 Wave 2:18th- 19th May, 2020 Wave 3: 1st -3rd June 2020 Wave 4:
13 24th - 28th July 2020| Research Panel: Dynata| Australians aged 16+, n=3,726, Wave 1: n=2,212 / Wave 2: n=423/ Wave 3: n=318/ Wave 4:
n= 773. All SA reported above n=278. Source: 2 CoreLogic, A Strong Result Across Sydney’s Auction Market Supports A Capital City
Preliminary Clearance Rate Of 67.3 Per Cent While Activity Across Melbourne’s Auction Market Hibernates, 14th September 2020. Source: 3
ABC.com.au, Why South Australia could lead the nation in economic recovery from coronavirus, 7th May 2020.SA residents are 4.9x more likely to intend to shop more at physical stores
in the future compared to reducing purchases at retail destinations1.
63% of SA residents intend to buy more Australian owned/made products
and/or services1.
In the future SA residents intend to purchase…
89% banking and financial products, of which 64% intend go to a
branch only or blend with online1.
80% health products, of which 68% intend to buy instore for every
purchase1.
93% pharmaceuticals, of 76% home improvements, of
which 82% intend to buy which 82% intend to buy
instore only1. instore only1.
80% large home appliances e.g. fridges, stove, of which 77%
intend to buy instore only1.
85% electronics, of which 78% alcohol, of which
64% intend to buy instore 79% intend to be bought
for all purchases1. instore only1.
6 in 10 lottery tickets, of which 76% intend to buy instore only or
a blend of instore and online1.
Source: 1 oOh!media Pulse Report | Timing Wave 1: 1st- 4th May, 2020 Wave 2:18th- 19th May, 2020 Wave 3: 1st -
14 3rd June 2020 Wave 4: 24th - 28th July 2020| Research Panel: Dynata| Australians aged 16+, n=3,726, Wave 1:
n=2,212 / Wave 2: n=423/ Wave 3: n=318/ Wave 4: n= 773. All SA reported above n=278.Wave 4
Gender: 50% 50%
Male Female
30%
Age: 27% 28%
7% 8%
Research Independent research panel provider, Dynata
Agency on behalf of oOh!media Pre Baby Boomers Baby Boomers Gen X (aged 40- Gen Y (aged 25- Gen Z (aged 16-
(aged 75+) (aged 56-74) 55) 39) 24)
Quantitative research via online consumer
Methodology panel. Nationally representative sample based
on age and geographic location Location:
Sydney metropolitan 22%
Sample Australians aged 16+ New South Wales (Not Sydney) 11%
Total respondents, n=3,726
Melbourne metropolitan 24%
Wave 1: n= 2,212
Victoria (Not Melbourne) 9%
Sample Size Wave 2: 423
Brisbane metropolitan 10%
Wave 3: 318
Queensland (Not Brisbane) 6%
Wave 4: 773
Adelaide metropolitan 5%
South Australia (Not Adelaide) 1%
Wave 1: 1st- 4th May, 2020 Perth metropolitan 8%
Wave 2: 18th- 20th May, 2020 Western Australia (Not Perth) 1%
Research Timings
Wave 3: 1st- 3rd June, 2020 Darwin metropolitan 1%
Wave 4: 24th- 28th July, 2020 Northern Territory (Not Darwin) 0.1%
Tasmania 2%
ACT 1%
Source: oOh!media Pulse Report | Timing Wave 1: 1st- 4th May, 2020 Wave 2:18th- 19th May,
2020 Wave 3: 1st -3rd June 2020 Wave 4: 24th - 28th July 2020| Research Panel: Dynata|
16 Australians aged 16+, n=3,726, Wave 1: n=2,212 / Wave 2: n=423/ Wave 3: n=318/ Wave 4: n=
773. Wave 4 results displayed right.You can also read