Identifying Optimal Soybean Planting Dates across the U.S - CoolBean
←
→
Page content transcription
If your browser does not render page correctly, please read the page content below
Identifying Optimal Soybean
Planting Dates across the U.S.
Spyridon Mourtzinis, James E. Specht, and Shawn P. Conley
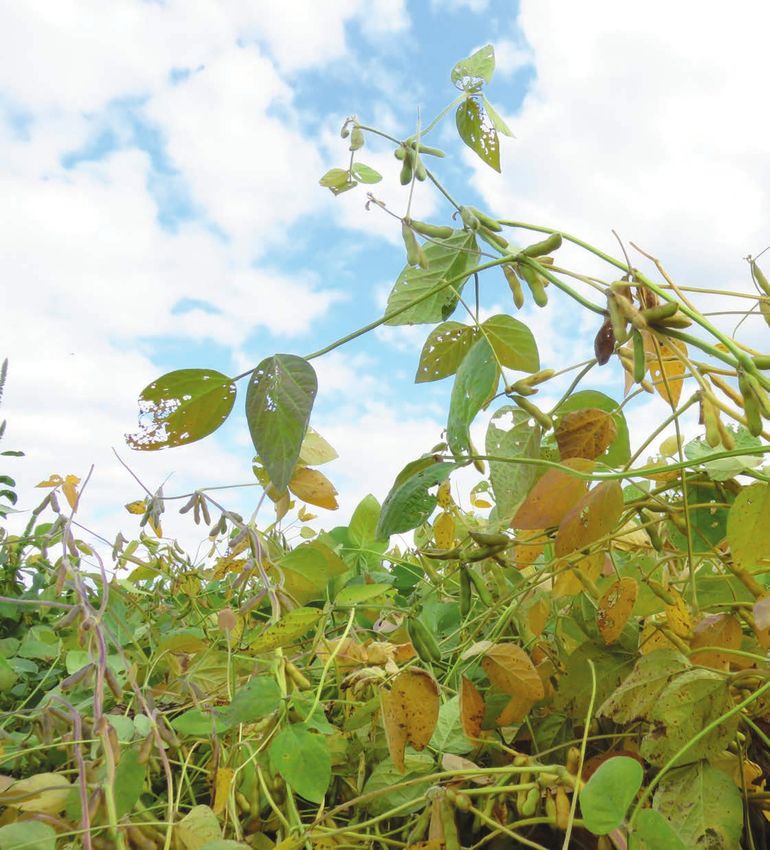
In a bean pod:
XX Across the U.S., planting 12 days earlier than what was practiced during 2007–
2016 would have resulted in a 10% greater total yield.
XX Southeastern state producers could adjust planting dates by 30 days earlier than
those typically used.
XX Soybean producers in Iowa and Ohio could have experienced a 0.4 and 1.1 bu/ac
yield increase, respectively during the past decade by 8–10 days earlier planting,
respectively.
XX In Nebraska, Illinois, and Wisconsin, producers appear to be already using near
optimum planting dates.
XX Minnesota, North Carolina, and Kansas would have experienced the greatest mon-
etary gains from earlier planting that could have reached ca. U.S.$0.9–1.5 billion.
XX Overall, planting date adjustment across the continental U.S. from 2007–2016
would have resulted in a cumulative gain of ca. U.S. $9 billion.
Note that the typical planting date is the average planting date in farmer’s fields (since trial planting
dates are similar to farmers planting dates), while optimum planting date is the date that planting would
have resulted in highest yield (based on our analysis).
Introduction
The U.S. is a major soybean producing country that supplies 34% of global annual
soybean production. Most U.S. soybean-producing regions are rainfed, and thus are
highly vulnerable to extreme weather events. Drought and elevated air tempera-
tures, now more increasingly frequent due to climate change, are important con-
straints in crop production across major agricultural areas globally. Thus, the chal-
lenge to increase crop yields to meet future demand can be achieved by increasing
the rate at which climate change adaptation practices are identified and adopted.
Vapor pressure deficit (Vpd) is a measure of atmospheric water demand with a
strong influence on plant transpiratory water loss (Lobell et al., 2013). Increasing Vpd
values are generally associated with drought and heat. Improved genetic traits and
crop management strategies could help mitigate the projected negative impacts
of climate change on crop yields. For example, drought-tolerant traits, introduced
through conventional breeding, resulted in soybean transpiration rates that pla-
teaued at Vpd levels above 1.4-2.1 kPa (Devi et al., 2014). Crop management strate-
gies, such as earlier-than-typical planting, has also been proposed as a strategy to
increase yields in regional studies (Rattalino Edreira et al., 2017). However, soybean
exhibits different sensitivities to weather during varied developmental stages (Pur-
cell and Specht, 2004), and therefore, the sensitivity of a crop to climate adaptation
strategies and their effectiveness in mitigating drought-induced yield reduction
remains unclear.
An important step towards adapting to climate change and mitigating its impact on
yield is accurate identification of the weather conditions that most affect crop yield.
1
As has been reported earlier, one option is planting date adjustment. Regional trials
                                                       have shown the benefits of earlier planting (Rattalino Edreira et al., 2017); however,
                                                       there is a limit to how much the regional field trials can extrapolate results. Our objec-
                                                       tive was to examine crop sensitivity to varying in-season weather conditions and to
                                                       model optimal planting dates and associated yield and monetary benefits due to
                                                       planting date adjustment across the U.S. To date, there is no similar previous work.

                                                       Materials and Methods
                                                       We used data from soybean seed yield cultivar trials performed by agricultural univer-
                                                       sity personnel in 27 states during 2007–2016 (Fig. 1). These multiple-site trials were
                                                       conducted each year (n=1,323 location × year yield data) in representative soybean
                                                       production areas. Within each state, the trial planting date data bracketed the 50%
                                                       planting date progress reported by USDA-NASS for each state and year. These 27
                                                       states accounted for ~99% of total U.S. soybean cultivated area (2007–2016 average).
                                                       The 1,323 location × year yield data were aligned with 1-K-resolution daily weather
                                                       data. State-wide average yield and weather conditions were calculated resulting in
                                                       186 state-year soybean yield and weather condition data.

Figure 1. Soybean area distribution in the U.S. Circles show the locations of the rainfed soybean yield cultivar trials conducted during 2007-2016 in 27 states
(n=1,323 location × year combinations), and the yellow-to-brown coloration denotes relative soybean crop density. Location-specific (A) and state-wide
(B) average cultivar trial sowing dates expressed as day of year (DOY) across the U.S. from 2007–2016 (see chart below for corresponding calendar date).

 Day of Year      Corresponding
 (DOY)            Calendar Date                        To identify weather variables during the growing season that had the strongest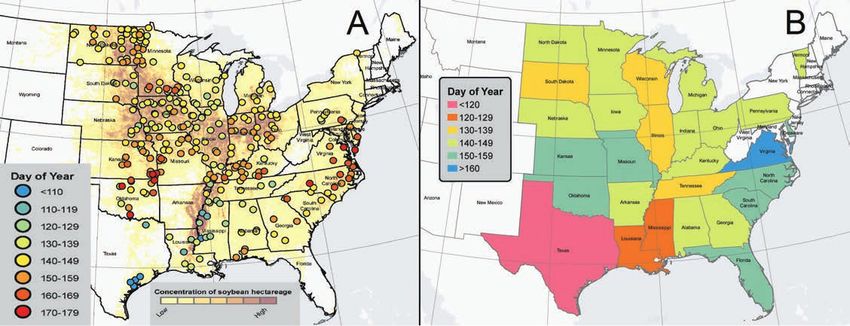
Figure 2. Conditional inference tree for
186 U.S. state-year soybean trial yields (bu/ac)
distributed across 27 states during 2007-2016
(Fig. 1). In each boxplot, the central rectangle
spans the first to third yield quartiles. The solid
line inside the rectangle is the mean which is
also numerically shown at the bottom (Y). The
number of state-year yields (total=186) is shown
on top of each boxplot (n). The white circles show
outlier yields. The acronyms DAP, DBP, and Vpd
are, respectively, days after planting, days before
planting, and vapor pressure deficit, with Vpd
reported in kPa and precipitation in inches. States
in group 1 include: AL, FL, GA, IA, KS, LA, MN,
MO, NC, ND, OK, TN, TX, and VA. States in group 2
include: AR, DE, IL, IN, KY, MI, MS, NE, OH, PA, SD,
SC, and WI. States in group 3 include: AL, GA, ND,
OK, and TX. States in group 4 include: FL, IA, KS,
LA, MN, MO, NC, TN, and VA.

                                                       The monetary effect of optimum planting was calculated by considering the per-
                                                       centage of yield change due to optimum planting within each state, and the total
                                                       state-wide non-irrigated soybean production change in each year (2007 to 2016).
                                                       Then, the estimated state-year-specific total income ($) was adjusted for inflation to
                                                       2016 U.S.$ values. Finally, frost probabilities were calculated using binomial distri-
                                                       bution of event occurrence (spring frost vs. no frost) for different daily minimum
                                                       temperature thresholds in all locations of the study (n=289 locations distributed in
                                                       27 states). The last 46 years of weather data (1981–2016) for each location were used
                                                       to calculate the probabilities.

                                                       Results and Discussion
                                                       The conditional inference tree analyses revealed that Vpd during 61–90 DAP was
                                                       the most important predictor of soybean yield (Fig. 2), which was consistent with
                                                       a finding in a previous study that focused on just three Midwestern states (Lobell
                                                       et al., 2014). The lowest trial yields were observed in state-years in which Vpd was
                                                       greater than 2.44 kPa from 61–90 DAP, and Vpd from -30 to 0 DBP was greater than
                                                       1.79 kPa. The highest yielding trials were those in which Vpd was lower than 2.44
                                                       kPa from 61–90 DAP, in 13 states as listed in Fig. 2 legend, and with precipitation
                                                       greater than 3 inches from 61–90 DAP. These results show that the state and amount
                                                       of precipitation from 61–90 DAP are important yield limiting factors mainly in non-
                                                       drought conditions.

                                                       The sensitivity of soybean yield to variable in-season weather conditions were
                                                       examined by creating weather datasets that differed from the typical state-specific
                                                       planting dates (trial planting dates set to zero) in 10-day increments (spanning a total
                                                       of -30 to +30 days) for all states and years in the study. A machine learning model,
                                                       calibrated to predict state-year-specific trial soybean yield across the U.S. based on
                                                       coordinates and weather variables, was applied to estimate yields for each hypothet-
                                                       ical planting date in every state from 2007–2016.

                                                       A clear trend of increased yields due to earlier planting was observed within most
                                                       states (Fig. 3 A) across the 10 years of the study. Excluding Texas and Mississippi,
                                                       where later planting by 30 and 6 days, respectively, increased yield, planting 12 days
                                                       earlier than what was practiced during this decade (2007-2016) across the U.S. would
                                                       have resulted in a 10% greater total yield. Our results suggest that Southeastern
                                                       state producers could adjust planting dates by 30 days earlier than those typically
                                                                                                                                                3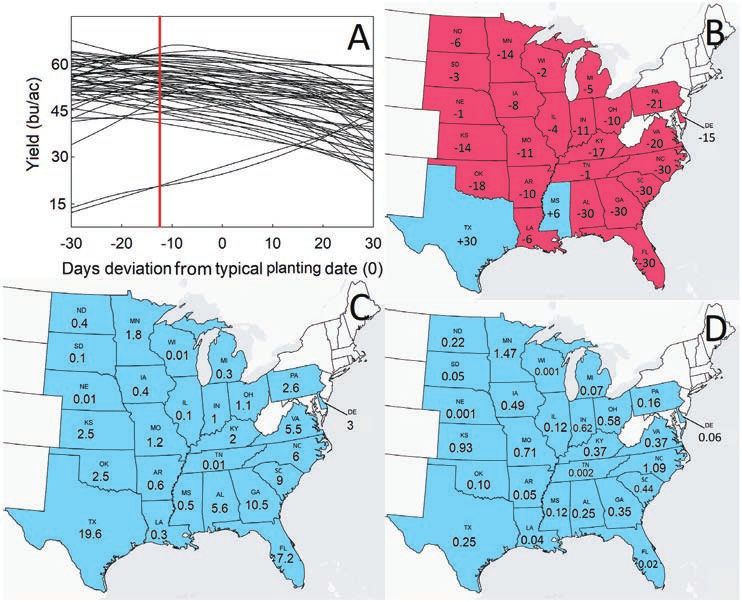
Figure 3. Ten-year average state-specific
(n=27 States) effect (A) of planting date on
soybean yield (bu/ac) using weather data sets
that differed from the typical planting date (trials
planting date set to zero) in 10-day increments
(spanning a total of -30 to +30 days). The red
vertical line shows the U.S.-average predicted
optimum planting date difference from typical.
(B) Ten-year state-specific optimum planting
date difference from typical. Earlier optimum
predicted planting dates (negative numbers)
were identified in red-colored states, but later
than typical optimum dates (positive numbers)
were identified blue-colored states. (C) Simulated
10-year average yield increase (bu/ac) when
using the optimum predicted planting dates in
each state. (D) Simulated ten-year state-specific
cumulative effect of optimum earlier planting
than typical when expressed in terms of soybean
producer income (in 2016 inflation-adjusted
billion U.S.$).

                                                       used (Fig. 3 B). Such adjustment would have resulted in a 5.6 to 10.5 bu/ac average
                                                       yield increase (Fig. 3 C). Mississippi and Texas growers have already adopted an early
                                                       planting date strategy ca. 1994 (Heatherly, 1999), and it appears that later planting by
                                                       5 and 30 days, respectively, from what currently is used would have increased yields
                                                       from 2007–2016. In the Midwestern U.S., soybean producers in states such as Iowa
                                                       and Ohio could have theoretically experienced a small yield increase (0.4 and 1.1 bu/
                                                       ac, respectively (Fig. 3 C)) during the past decade by 8 to 10 days earlier planting,
                                                       respectively. This result is in agreement with recent regional estimates of early plant-
                                                       ing date effect on farmers’ fields (Mourtzinis et al., 2019). In other states with large
                                                       cultivated areas, such as Nebraska, Illinois, and Wisconsin, producers appear to be
                                                       already using near optimum planting dates. It has been reported that earlier planting
                                                       dates resulted in a longer planting-to-first trifoliolate growth stage (V1) period but
                                                       also advances V1 occurrence on a calendar date basis (Bastidas et al., 2008). This leads
                                                       to earlier node accrual and floral induction which can optimize the final number of
                                                       main stem nodes and result in greater yield potential (Bastidas et al., 2008).

                                                       Using state-year-specific total income data ($) and the previously calculated yield
                                                       change due to planting date adjustment (Fig. 3 C), a 10-year cumulative monetary
                                                       effect was estimated for each state (Fig. 3 D). A substantial monetary gain from earlier
                                                       planting was estimated in most soybean producing states. Minnesota, North Caroli-
                                                       na, and Kansas would have experienced the greatest monetary gains that could have
                                                       reached ca. U.S. $0.9–1.5 billion. The gains would have been lower in Southern and
                                                       Southeastern states, despite the greatest yield change due to planting date adjust-
                                                       ment from the Northern states, mainly due to the smaller cultivated area. Overall,
                                                       planting date adjustment across the continental U.S. from 2007 through 2016 would
                                                       have resulted in a cumulative gain of ca. U.S. $9 billion. We note that earlier planting
                                                       may be associated with an additional cost for farmers to update or add additional
                                                       planting equipment. Still, because such costs can be amortized out over time, we
                                                       consider our estimates as an upper bound of hypothetical monetary benefits.

                                                       An important consideration in early planting is spring frost occurrence, which can
                                                       damage or destroy the crop (but only after emergence at 15–25 DAP) (Meyer and
                                                       Badaruddin, 2001). The current common recommendation to soybean producers is to
                                                       plant the first field when frost probabilities are less than 20% on or after emergence.
                                                       Minor frost damage on emerged seedlings may occur when temperature drops

4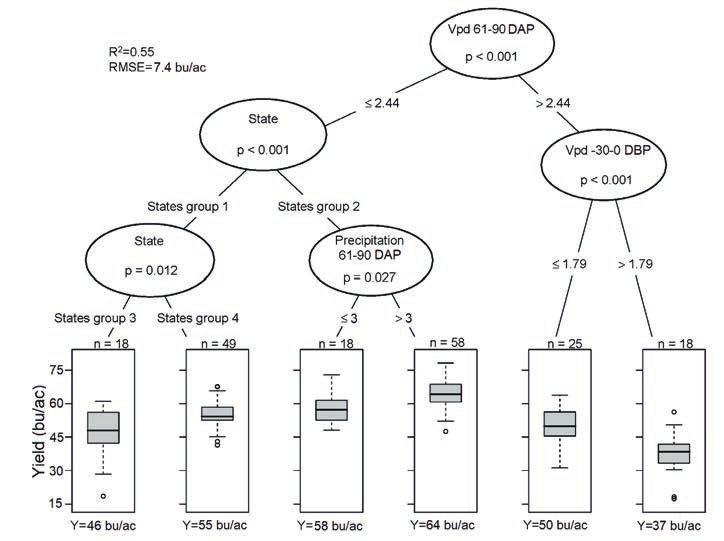
Figure 4. Location-specific (n=289 locations distributed in 27 states across the U.S. – Fig 1) spring frost probability for 32, 30, 28, and 26 °F at soybean
emergence (at 15 DAP) for 30 DBP to a 30-DAP date bracketing the actual planting date (set to 0). The red line shows the 20% spring frost probability threshold.
The probabilities for each location were calculated using last 46 years of weather data (1981 to 2016).

                                                        below 32 °F, but becomes more damaging when temperature drops below 28° F
                                                        for prolonged periods. In Northern and Midwestern states, where the risk for early
                                                        frost damage is higher, optimum planting dates were observed for up to 21 days
                                                        earlier than what are typically used (Fig. 3 B). Using the 21 days earlier planting as a
                                                        threshold, 2% of all 289 locations (all in North Dakota, South Dakota, and Minnesota)
                                                        exceeded the 20% probability threshold for daily minimum temperatures to drop
                                                        below 32 °F at emergence and only 0.3% had exceeded the 20% probability for daily
                                                        minimum temperatures to drop below 30 °F (Fig. 4). In the Southeastern states, frost
                                                        probabilities (Tmin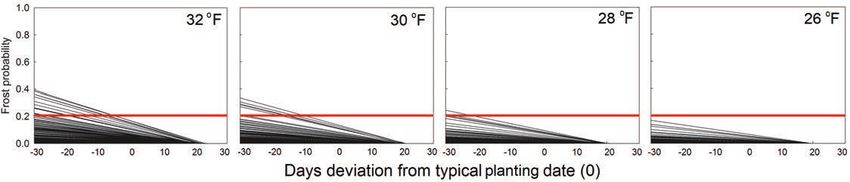
References
    Bastidas, A.M., et al. Soybean sowing date: The vegetative, reproductive, and agro-
    nomic impacts. Crop Sci. 48, 727–740 (2008).

    Challinor, A.J., et al. A meta-analysis of crop yield under climate change and adapta-
    tion. Nat. clim. change 4, 287-291 (2014).

    Devi, J.M., Sinclair, T. R., Chen, P. & Carter, T. E. Evaluation of elite southern maturity
    Soybean breeding lines for drought-tolerant traits. Agron. J. 106, 1947-1954 (2014).

    Heatherly, L.G. Early soybean production system (ESPS). In Soybean production in the
    Midsouth; Heatherly, L.G., Hodges, H.F., Eds.; CRC Press: Boca Raton, FL, USA, 103-118
    (1999).

    IPCC Climate Change 2013: The Physical Science Basis (eds Stocker, T. F. et al.) (Cam-
    bridge Univ. Press, 2014).

    Lobell, D.B. et al. The critical role of extreme heat for maize production in the United
    States. Nat. Clim. Change 3, 497-501 (2013).

    Lobell, D.B., et al. Greater sensitivity to drought accompanies maize yield increase in
    the U.S. Midwest. Science 344, 516 (2014).

    Meyer, D.W. & Badaruddin, M. Frost tolerance of ten seedling legume species at four
    growth stages. Crop Sci. 41, 1838–1842 (2001).

    Mourtzinis, S. et al. Climate-induced reduction in U.S.-wide soybean yields under-
    pinned by region- and in-season specific responses. Nat. Plants 2, 14026 (2015).

    Mourtzinis, S., et al. Sifting and winnowing: analysis of farmer field data for soybean
    in the U.S. North-Central region. Field Crops Res. 221, 130-141 (2018).

    Purcell, L. & Specht, J.E. in Soybeans: Improvement, Production, and Uses 3rd edn (eds
    Boemma, H.R. & Specht, J.E.) 569-620 (American Society of Agronomy, 2004).

    Rattalino Edreira, J.I., et al. Assessing causes of yield gaps in agricultural areas with
    diversity in climate and soils. Agric For Meteorol. 247, 170-180 (2017).

    Specht, J.E., Hume, D.J. & Kumudini, S.V. Soybean Yield Potential-A Genetic and Physi-
    ological Perspective. Crop sci. 6, 1560-1570 (1999).

    Walsh, J., et al., Ch. 2: Our changing climate. Climate change impacts in the United
    States: The third national climate assessment, J. M. Melillo, Terese (T.C.) Richmond,
    and G. W. Yohe, Eds., U.S. Global change research program, 19-67 (2014).

6
You can also read