Annual Press Conference 2019 - Frankfurt, 14 March 2019 - Lufthansa Group
←
→
Page content transcription
If your browser does not render page correctly, please read the page content below
Annual Press Conference 2019

Frankfurt, 14 March 2019
Disclaimer
The information herein is based on publicly available information. It   This presentation contains statements that express the Company‘s
has been prepared by the Company solely for use in this                 opinions, expectations, beliefs, plans, objectives, assumptions or
presentation and has not been verified by independent third parties.    projections regarding future events or future results, in contrast with
No representation, warranty or undertaking, express or implied, is      statements that reflect historical facts. While the Company always
made as to, and no reliance should be placed on, the fairness,          intends to express its best knowledge when it makes statements
accuracy, completeness or correctness of the information or the         about what it believes will occur in the future, and although it bases
opinions contained herein. The information contained in this            these statements on assumptions that it believes to be reasonable
presentation should be considered in the context of the                 when made, these forward-looking statements are not a guarantee
circumstances prevailing at that time and will not be updated to        of performance, and no undue reliance should be placed on such
reflect material developments which may occur after the date of the     statements. Forward-looking statements are subject to many risks,
presentation.                                                           uncertainties and other variable circumstances that may cause the
                                                                        statements to be inaccurate. Many of these risks are outside of the
                                                                        Company‘s control and could cause its actual results (positively or
The information does not constitute any offer or invitation to sell,    negatively) to differ materially from those it thought would occur.
purchase or subscribe any securities of the Company. Without the        The forward-looking statements included in this presentation are
Company’s consent the information may not be copied, distributed,       made only as of the date hereof. The Company does not undertake,
passed on or disclosed.                                                 and specifically declines, any obligation to update any such
                                                                        statements or to publicly announce the results of any revisions to
                                                                        any of such statements to reflect future events or developments.

Page 2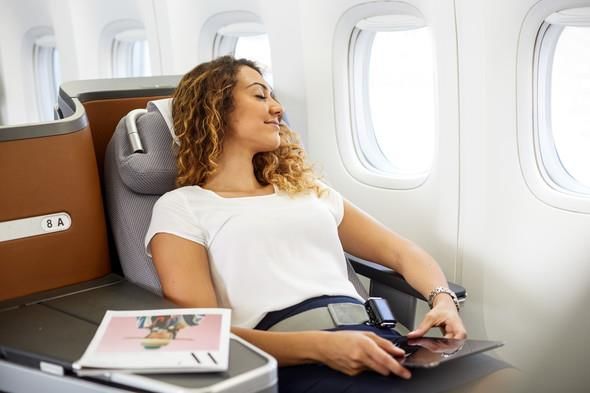
Annual Press Conference 2019
Carsten Spohr, CEO and Chairman of the Executive Board

Frankfurt, 14 March 2019
Despite one-off costs, Lufthansa Group’s result only slightly below last year

  Highest revenue in                                                                                       Europe’s first and only 5 Star
  history                                                                                +10% passengers   airline

   35.8                        bn €

  2nd best result in history
                                                                          100 years     Cost reduction     Good perspectives for staff
                                                                         anniversary
  2.8 bn €                                                               of the crane   -1.7%
                                                                                        (CASK1)
                                                                                                           8,000                     new hires
  ( Adj. EBIT Margin: 7.9%)                                                                                (LH Group: 142 k employees)

1 excl. Fuel and FX;
Without effect from change in accounting for engine maintenance events: 1.2%

Page 4
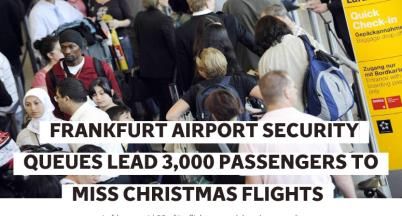
Strong growth poses tremendous operational challenges for the industry

                                                             Delay reasons

              +50%                                      Airline
                                                               in 2018*

                                                                             Airport
            Intra-EU passengers
                 in 10 years                                                processes

                                                            ~1/3          ~1/3

                                                                   ~1/3

                                                           Air traffic control

1 Without force majeure/weather

Page 5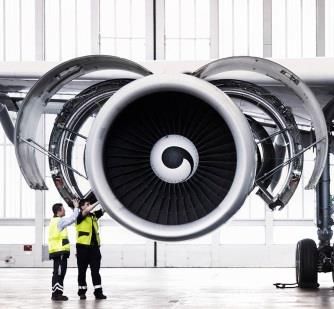
In 2019, Lufthansa Group invests significantly in stable flight operations

                                                    Focus on the first scheduled
            37                                      flights of the day
            Spare aircraft                          to reduce
                                                    rotational delay

   10-15%                                                600
   Faster turnaround                                     additional employees,
                                                         thereof 200 mechanics

                Reduction of growth               Improved
                to
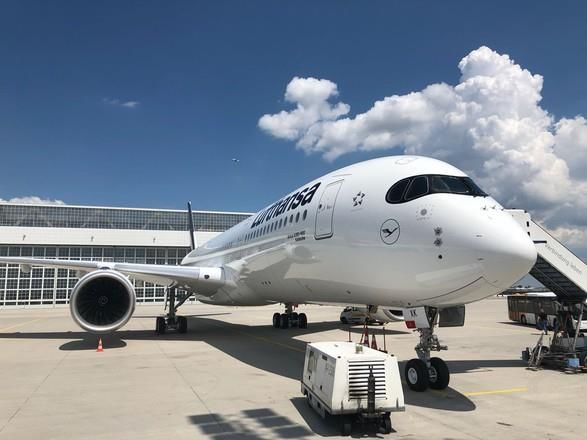
Lufthansa Group long-haul fleet will be entirely modernized

  Recent fleet order                                  Long-term impact

                                                      Simplifying long-haul fleet
                                                      • Phase-out of 7 aircraft types
                                                      • Entire fleet modernization until mid of next decade

         New 787-9 as of 2022:         20 aircraft
                                                      Lowering emissions
                                                      • Reduction of fuel consumption by ~25% per ASK
                                                      • 1.5 m tons less carbon emssions per year

                                                      Reducing cost
         Additional A350 as of 2023:   +20 aircraft
                                                      • Reduction of operating cost by ~20% per ASK
                                                      • Standardized and market proven aircraft

Page 7
Annual Press Conference 2019
Ulrik Svensson, CFO and Member of the Executive Board

Frankfurt, 14 March 2019
Significant headwinds almost compensated by underlying improvements
Group Adjusted EBIT Comments
2,969 Adjusted EBIT performance in line
2,836 with initial guidance
-122 2,714
Headwinds from fuel cost increase,
-855 integration costs at Eurowings and
+1,106
rising irregularity costs larger than
originally expected
-170
Profitable growth and cost
-214
reductions drive underlying
improvements
1.2bn EUR headwinds
Adj. EBIT Fuel EW Irreg. Underlying Adj. EBIT acc. change Adj. EBIT
FY 17 one-offs cost improvement FY 18 FY 18
1
Restated increase Reported Excl. EOVH
1 EOVH = Capitalization of Engine Overhaul events
Page 9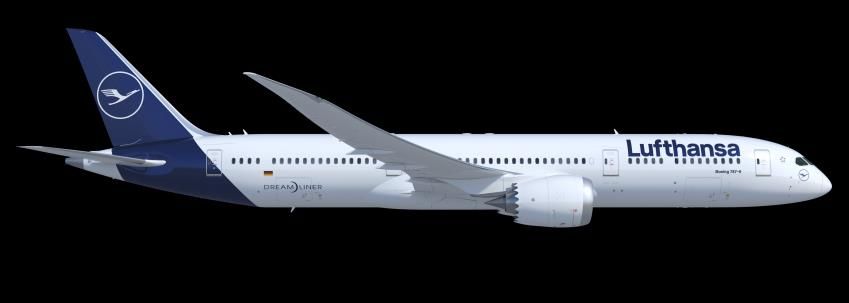
Capitalization of engine overhauls improves view on airlines’ performance

                             • Capitalization of engine overhauls provides better view on underlying profit performance of the Airlines by reducing volatility in MRO costs
 Context

                             • Change in accounting makes Group airlines more comparable to competition
                             • Restatement of 2017 and 2018 assets, expenses, depreciation and capex in the FY 2018 financial accounts

                             Effect on Profit & Loss:                             Effect on Balance Sheet:                           Effect on Cash Flow:
 Effect on Lufthansa Group

                                                      +122
                                                                                                        -488                                                 ±0
                                2,714                        470      2,836         9,598                                                           470
                                                                                                               138       9,110          250                                250
                                              -348
                                                                                                 -626                                                             470

                                Adj. EBIT     Depr.     Own work      Adj. EBIT    Sh. Equity    Engines   Def. taxes   Sh. Equity       FCF        Op. CF        Capex     FCF
                                          1
                               excl. EOVH               capitalized   reported     excl. EOVH1                           reported     excl. EOVH1                         reported

                             Accounting change increases 2018 Adjusted EBIT by 122m EUR
1 EOVH = Capitalization of Engine Overhaul events

Page 10
Strength in long-haul continues, short-haul remains challenged by oversupply
Revenue KPIs Q4 FY
+10.9% +11.8%
Comments
Europe
+1.1pts.
47%
-0.8pts. -2.7%
European yield affected by a tough
-4.9%
ASK SLF Yield1 ASK SLF Yield1 comparison base, the Group’s
+9.4% +7.3% Yield NA:
response to competition and high
Yield NA: +1.9% market-wide capacity growth,
Americas
0.9pts. +3.5%
29%
+0.4pts. +0.2% especially towards the end of the
-1.0% year
ASK SLF Yield1 ASK SLF Yield1
Performance in the US accelerates in
+5.9%
+4.5% the fourth quarter, South America
Asia/Pacific
+4.7% +1.9%
+1.0pts. impacted significantly by weak
16%
-0.1pts. Brazilian market
ASK SLF Yield1 ASK SLF Yield1 Japan and China drive yield
+10.0% +6.5% improvement in Asia/Pacific
Mideast/Africa
+5.0%
8% 0.3pts. +0.6pts.
-0.6%
ASK SLF Yield1 ASK SLF Yield1
1 Excl. currency and IFRS 15
% of Traffic Revenues as of FY 18
Page 11Network Airlines grow full year unit revenues
Revenue KPIs Q4 FY
+9.3%
Passenger Airlines +8.2% Comments
Passenger +0.2pts. +0.5pts. RASK of all Network Airlines up in the
Airlines
-1.4%
-0.2% -0.5% full year due to strength in long-haul
-3.0%
ASK SLF Yield1 RASK1 ASK SLF Yield1 RASK1 RASK decline of Network Airlines in
Q4 entirely due to pressures in
Network Airlines
+7.5%
short-haul
+5.7%
Eurowings RASK declines due to
+0.2pts. +0.4pts. +0.5% +0.3% non-recurrence of prior year demand
-0.8% -1.2% surge after Air Berlin market exit
ASK SLF Yield1 RASK1 ASK SLF Yield1 RASK1
Eurowings +21.3%
+17.5%
+0.1pts.
+1.4pts.
-3.7%
-1.9% -2.9%
-11.2%
ASK SLF Yield1 RASK1 ASK SLF Yield1 RASK1
1 Excl. currency and IFRS 15
Page 12Irregularity costs and one-offs mask even better underlying cost performance
Cost KPIs Q4 FY
CASK1 CASK1 Comments
-2.0%
Passenger ex. integration
CASK reduction at Network Airlines
Airlines costs
driven by crew productivity
-1.2%
improvements, the renegotiation of
-4.5%
infrastructure contracts and the
Network Airlines
reorganization of administrative
structures and processes
Costs for the integration of former
Air Berlin aircraft at Eurowings
-3.6%
-1.7% amount to EUR 170 million, Group-
wide irregularity costs increase by
Eurowings -2.9% 70% to EUR 518 million (2017: EUR
ex. integration 304 million)
costs
+1.9%
Non-recurrence of prior year
acquisition-related costs support
-8.1%
reduction at Eurowings in Q4
1 Excl. currency, excl. fuel
Figures exclude the effect of the capitalization of engine overhaul events
Page 13Fuel cost increase significantly in 2018
Fuel Cost Q4 FY Comments
+855 / +16% Average jet fuel price 15% above
prior year level
Around EUR 250 million of full year
increase attributable to capacity
growth
Hedging limits fuel cost increase
Lufthansa
Group 6,087
+318 / +25% 5,232
1,611
1,293
Q417 Q4 18 FY 17 FY 18
Page 14Network Airlines fully offset rising fuel costs
Adjusted EBIT Q4 FY
-1% 0% Comments
316 313 2,263 2,273
Lufthansa offsets higher fuel costs
Q4 17 Q4 18 FY 17 FY 18 by growing unit revenues and
reducing unit costs
+21% -1%
Profit growth at SWISS driven by
222 269 1,627 1,615 higher loads and yields
Q4 17 Q4 18 FY 17 FY 18 Austrian Airlines impacted by tough
market situation in short-haul
-9% +14%
100 91 542 616
Q4 17 Q4 18 FY 17 FY 18
nmf. -55%
-6
-44 94
42
Q4 17 Q4 18 FY 17 FY 18
Figures exclude the effect of the capitalization of engine overhaul events
Page 15Eurowings results distorted by one-off effects
Adjusted EBIT Q4 FY
nmf. nmf. Comments
-51 94
-113
-178 Full year loss largely due to expenses
Q4 17 Q4 18 FY 17 FY 18 of around EUR 170 million related to
the integration of former Air Berlin
aircraft
Irregularity costs more than double
compared to the previous year
Operational KPIs
Reported Adjusted EBIT of negative
EUR 231 million includes a negative
Passengers +18% effect of EUR 53 million related to
the change in the accounting of
engine maintenance
Aircraft1 +77
1 Integrated in the wake of the Air Berlin insolvency
Figures exclude the effect of the capitalization of engine overhaul events
Page 16Profits grow across all Aviation Services
Adjusted EBIT Q4 FY
-22% +10% Comments
144 112 242 265 Cargo profits up in the full year, Q4
Q4 17 Q4 18 FY 17 FY 18 result reflects normalization after
prior year record level
+26% +2%
Technik benefits from improvements
82 103 415 425 in engine overhaul business towards
Q4 17 Q4 18 FY 17 FY 18
the end of the year
Restructuring of European business
nmf. +74%
at LSG Group is making progress
16 66 115
0
FY 17 FY 18
Q4 17 Q4 18
Others & nmf. nmf.
Consolidation
-78 -107
-94 -186
Q4 17 Q4 18 FY 17 FY 18
Figures exclude the effect of the capitalization of engine overhaul events
Page 17Group investments focus on fleet modernization
Gross Investments1 Comments
+5% 3.757 Investments broadly on prior year
3.287
level excluding the effect of the
470
3.141 capitalization of engine overhaul
events
3.3bn EUR invested in aircraft and
engines
46 aircraft added in 2018
FY 17 FY 18 FY 18
Reported Excl. Acc. Reported
in 2017 EOVH change in 2018
1 Excluding cash-outs from equity investments
Page 18Allocation of investments is driven by capital return performance
Adjusted ROCE after tax Gross Investments and Adjusted ROCE after tax per business
1,582
-1.3pts.
26%
774
15%
11.9% 13%
10.6%
515 7% 7% 7%
374
241 220
79
FY 171 FY 18 Lufthansa Swiss Eurowings Logistics MRO Austrian Catering
-8%
Pre-tax ROCE amounts to Capital return performance drives investment allocation decision
14.2% Hurdle rate consists of WACC plus division-specific risk premium
High investments at Eurowings reflect unique opportunity to
consolidate the German market
1 2017 restated for capitalization of engine overhaul events
Page 19Balance sheet remains strong
Operating Cash Flow Free Cash Flow Net Debt / Pension Provisions
-23% -88%
5,368 2,117 9,354
8,000 Net debt
4,109
+15% 5,865 Pension provisions
5,116
250 3,489
2,884 +21%
FY 171 FY 18 FY 171 FY 18 31 Dec. 17 31 Dec. 18
Decline due to non-recurrence of Decrease due to lower operating cash Pension provisions increase due to
positive prior year effects (trade flow and higher investments negative performance of plan assets
working capital) as well as higher
Adj. Net debt/Adj. EBITDA at 1.8
variable compensation and tax comfortably below upper end of
payments in 2018 target range of 3.5
1 2017 restated for net presentation of interests
Page 20Dividend proposal amounts to 80 Cents per share
Dividend per share in EUR
0.80 0.80
0.70
0.60
0.50 0.50
0.45
0.25
0 0 0
FY 2008 2009 2010 2011 2012 2013 2014 2015 2016 2017 2018
Dividend Policy FY 2018
Base EBIT 2,974m EUR
Pay-out 10% - 25% 13% (0.80 EUR per share = 380m EUR)
Page 21Group Airlines further reduce capacity growth
Europe
Market-wide seat growth SU 19: +3%
Market-wide capacity growth
moderates significantly
Group unit revenues expected to
benefit from moderating yield pressure
Americas
Market-wide seat growth SU 19: +6%
Good demand expected to
continue Asia / Pacific
Market-wide seat growth SU 19: +9%
Market-wide capacity growth in
line with demand growth
Middle East / Africa Demand continues to hold up well
region-wide
Market-wide seat growth SU 19: +4%
China- and HK-based carriers drive
Smallest and most volatile area capacity growth
No growth among Middle Eastern
carriers
Lufthansa Group will moderate capacity growth from originally 3.8% to 1.9% in Summer 2019
Page 22Lufthansa Group Airlines will further reduce unit costs in 2019
Successful CASK reduction … …set to continue in 2019
Process improvements
New aircraft
(c. 20% less operating
cost each) Ambition:
1% to 2%
CASK
reduction
-1.8% -1.7% every year Continuous optimization
-2.5% of MRO costs
Staff productivity gains
FY 16 FY 17 FY 18
Lower distribution cost
Turnaround (increasing share of direct sales)
Page 23Lufthansa Group expects EBIT margin between 6.5% and 8.0% in 2019
Passenger Airlines
Network Airlines Eurowings
Capacity growth (ASK) c. +4% c. +2%
Unit revenue (RASK, at constant currency) stable to down low-single digit stable to up low-single digit
Unit cost (CASK, at constant currency, excl. fuel) -0.5% to -1.5% -7.0% to -9.0%
Fuel (year-on-year change) +550m EUR +100m EUR
Adjusted EBIT margin 7.5% to 9.5% around 0%
Non-PAX
Logistics MRO Catering Others
Revenue growth up high-single digit up mid-single digit stable
Adjusted EBIT margin 7% to 9% 7% to 8% 2% to 4%
Adjusted EBIT (year-on-year change) -150m EUR
Lufthansa Group
Revenue growth up mid-single digit
Adjusted EBIT margin 6.5% to 8.0%
Page 24Annual Press Conference 2019 Carsten Spohr, CEO and Chairman of the Executive Board Frankfurt, 14 March 2019
Lufthansa Group: #1 for customers, employees and shareholders
                                         Customer

                 Shareholder               #1                     Employee

                 Network Airlines                            Eurowings
                    #1 in Europe                         #1 in home markets

                                          Logistics

                                   Aviation Services
                                        #1 worldwide
                         MRO               Catering                Aviation Training

                               Cost Focus & Operational Quality

Page 26
Lufthansa Group: #1 through modernization, innovation and growth Network Airlines Eurowings Operational stability Operational stability & product campaign & turnaround Fleet Innovation Strategic Training running modernization, & cooperations realignment at full speed digitalization Page 27
Network Airlines start 360° product campaign
Innovative booking     Further 7,000 m2         Renewal of all seats       More choices        New entertainment
service                lounge area until 2023   until 2026                 and transparency    system as of 2020

Common App             Introduction of          New Business in 2020,      Stronger            Control via own device
                       biometric boarding       new Economy in 2019        individualization   possible

Before trip            On ground                On board                   F&B                 IFE

                                                                       • Individualization               160+
                                                                       • Comfort                       product-
                                                                       • Hospitality                  initiatives
                     #1 2019

Page 28
Eurowings has strongly expanded its market position, 2019 focus on turnaround
#1 position in home market
Eurowings #3 position in Europe
2018 4.2 bn € revenues; 38.5 m passengers
205 aircraft (every 4th LHG aircraft)
Integration of AB parts burdened 2018 result Turnaround measures in 2019
Adjusted EBIT development, 170 m € one-off costs in 2018
Improvement of crew and aircraft productivity –
1 one AOC per base
60
-104 +60
-231
2 Reduction of irregularity costs
-104
2016 2017
-231 2018 2019 3 Refinement of long-haul strategy
Page 29Lufthansa Group launches an extensive sustainability package
Stronger commitment in Germany;
encourage corporate volunteering
100% CO2 compensation
For all duty trips of employees
100% Eco-electricity
For Lufthansa Group buildings in Germany,
Austria and Switzerland1
100% CO2 neutral mobility
For ground transportation in Germany,
Austria and Switzerland1
1 Wherever possible
Page 30Lufthansa Group: #1 for all stakehholders
Qualitative growth & Investments in stable operations,
actively consolidating the industry fleet and product
Strong financials & Good perspectives
sustainable approach for our employees
2.8 bn € profit
CO2 compensation
0.80 € dividend1
1 Dividend proposal
Page 31Thank you for your attention
You can also read